Public Data

Freedom of Information Act (FOIA) Request
Since 1967, the Freedom of Information Act (FOIA) has provided the public the right to request access to records from any federal agency.
Federal agencies are required to disclose any information requested under the FOIA unless it falls under one of nine exemptions which protect interests such as personal privacy, national security, and law enforcement.

FOIA Request Exemptions
Exemption 1: Information that is classified to protect national security.
Exemption 2: Information related solely to the internal personnel rules and practices of an agency.
Exemption 3: Information that is prohibited from disclosure by another federal law.
Exemption 4: Trade secrets or commercial or financial information that is confidential or privileged.
FOIA Request Exemptions
Exemption 5: Privileged communications within or between agencies, including:
- Deliberative Process Privilege
- Attorney-Work Product Privilege
- Attorney-Client Privilege
Exemption 6: Information that, if disclosed, would invade another individual's personal privacy.
FOIA Request Exemptions
Exemption 7: Information compiled for law enforcement purposes that:
- 7(A). Could reasonably be expected to interfere with enforcement proceedings
- 7(B). Would deprive a person of a right to a fair trial or an impartial adjudication
- 7(C). Could reasonably be expected to constitute an unwarranted invasion of personal privacy
- 7(D). Could reasonably be expected to disclose the identity of a confidential source
- 7(E). Would disclose techniques and procedures for law enforcement investigations or prosecutions
- 7(F). Could reasonably be expected to endanger the life or physical safety of any individual
Exemption 8: Information that concerns the supervision of financial institutions.
FOIA Request Exemptions
Exemption 9: Geological information on wells.
How to Make a FOIA Request
https://www.foia.gov/how-to.html
FOIA Request Example

@JasonLeopold
Sr investigative reporter @BuzzFeedNews investigations team.
src: https://twitter.com/JasonLeopold/status/814504328362741760

Public Data
Data that is freely available for anyone to use and republish as they wish
eg Government (taxpayer-funded) data available in the public domain such as data.gov or Public Genome Data used in scientific research
Private Data
Private, or protected data, that is privately owned by individuals or companies

Case Study 1

What's up with RealFeel® being a registered trademark?
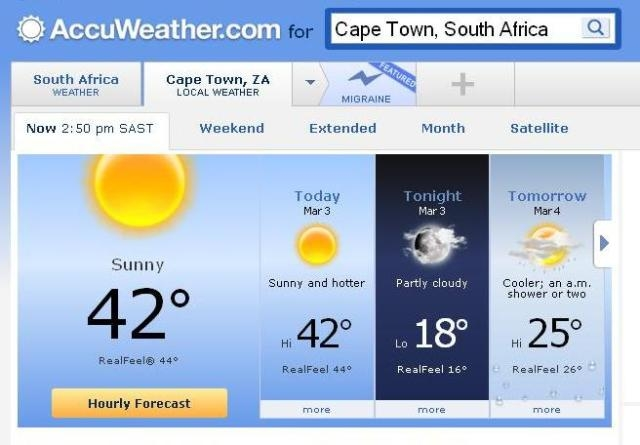

Where does AccuWeather's Data come from?

Where does AccuWeather's Data come from?
The National Weather Service, which provides large amounts of the data that AccuWeather repackages and sells for profit, also provides that same information for free by placing it in the public domain:
National Weather Service GIS Weather Portal http://www.nws.noaa.gov/gis/
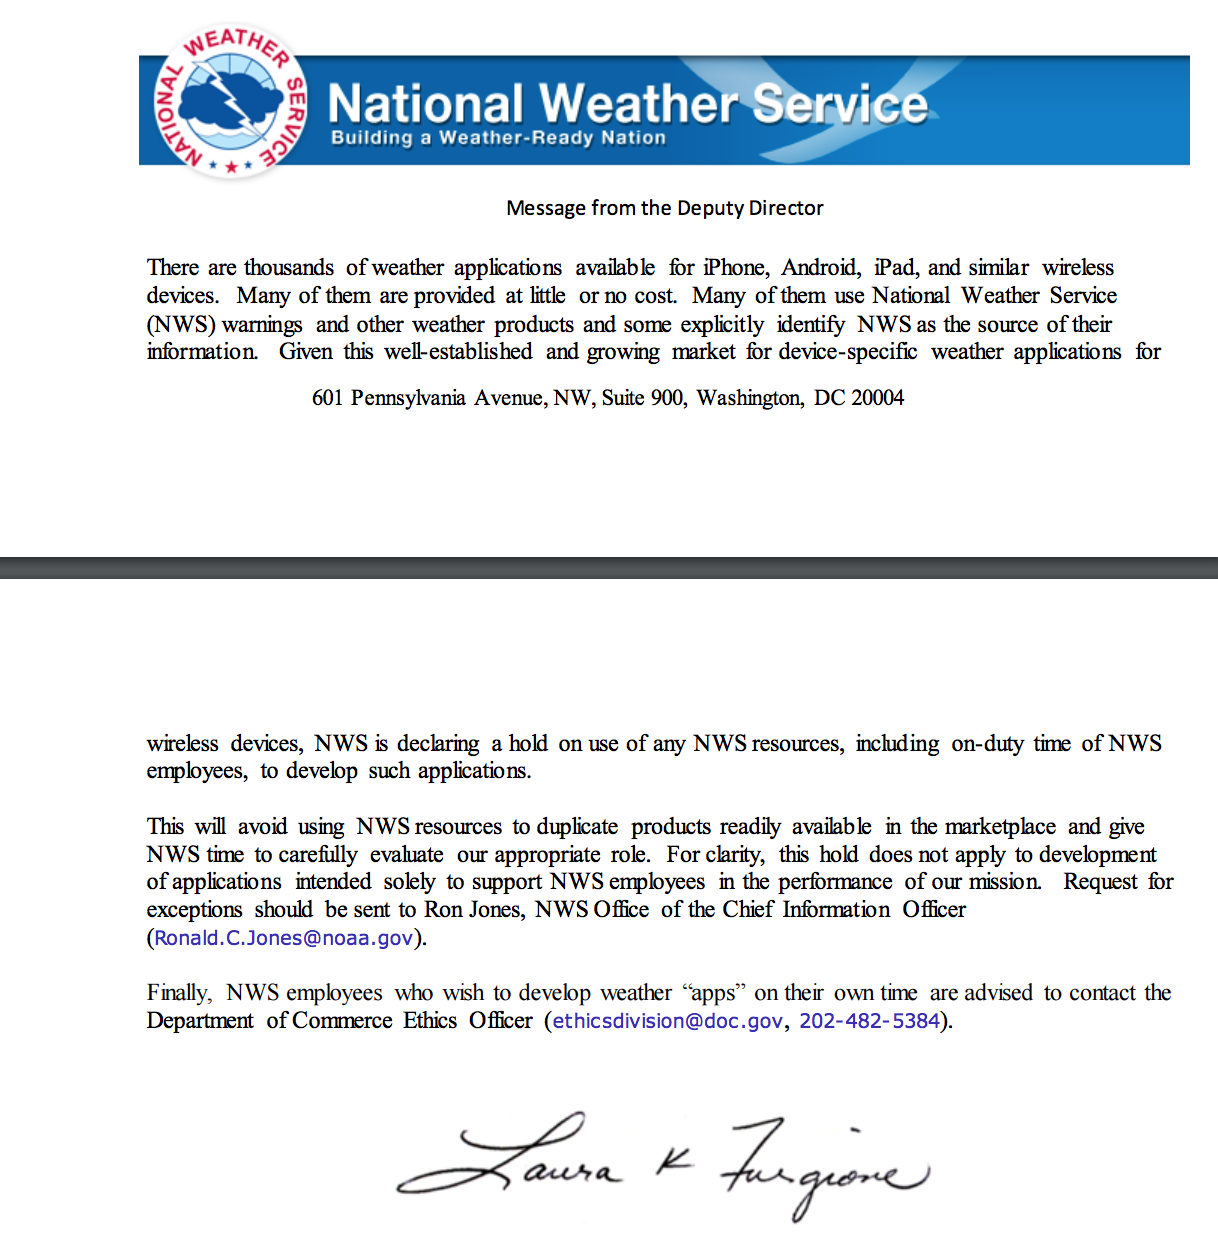
Why can't I find an official National Weather Service app?
S.786 - National Weather Service Duties Act of 2005
https://www.congress.gov/bill/109th-congress/senate-bill/00786
- Who sponsored the bill?
- What was the purpose of the bill?
- What would have been the end result of the bill?
- Why do you think the bill was written?
- Did the bill become law?

Further reading
https://www.washingtonpost.com/blogs/capital-weather-gang/post/national-weather-service-hold-on-mobile-apps-stirs-controversy/2012/01/08/gIQAjWKUlP_blog.html
http://www.nwseo.org/Four%20Winds/11_12_28_Sobien_Lubchenco_Letter.pdf
https://web.archive.org/web/20111020154327/http://newsmeat.com/ceo_political_donations/Joel_Myers.php
Case Study 2
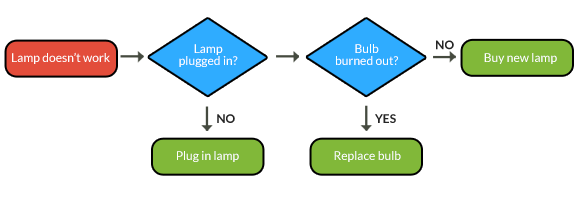
Algorithm
An algorithm is process or set of rules to be followed in calculations or other problem-solving operations.
We must also ask: an algorithm built by whom, an algorithm designed by whom, an algorithm trained by whom?
Bias
Reading: When Algorithms Discriminate
https://www.nytimes.com/2015/07/10/upshot/when-algorithms-discriminate.html
Activity: Understanding Bias in Algorithms
- With a partner, choose and research an algorithm such as
- the algorithm used for credit scores based upon Facebook friends or the algorithm for Facebook's newsfeed
- an algorithm used to decide which ads to show you
- Netflix's recommendation algorithm
- Google's vs Bing's search algorithm
- a predictive policing algorithm
- Be able to answer the following questions:
- Is the algorithm biased? What supporting evidence exists?
- Who wrote the algorithm? Who was it written for?
- What are the unintended results of the algorithm, if any?
- Could you show the class the algorithm in action?
How Data is funded

How Government
Data is Funded & Collected
- Contracts, Grants, Loans (https://www.usaspending.gov/)
- Under the terms of the 2013 Federal Open Data Policy, newly-generated government data is required to be made available in open, machine-readable formats, while continuing to ensure privacy and security. (https://www.gsa.gov/portal/category/25729)
https://www.whitehouse.gov/sites/default/files/omb/memoranda/2013/m-13-13.pdf
(https://obamawhitehouse.archives.gov/ or https://archive.org/web/)
How Government
Data is Made Available
- Wordpress: https://wordpress.com/
- Open-source data portal platform: https://ckan.org/
- data.gov source code: https://github.com/GSA/data.gov/

Data Design & UX

Web Pages
- Static Content
- Limited Interativity
Web Apps
- Data-centric
- Dynamic
- User Actions
- Flexibility
Designing for data is challenging
Sources of data
- Big Data
- Large machine-generated quantitative data sets
- Site analytics, shopping history, social media activity, and website click maps
- Thick Data
- Qualitative data
- Insights from user interviews and focus groups, and quantitative data like online surveys

Data as storytelling device
- Crafting a compelling narrative
- Help users find relevant patterns and trends
- Steer users through large amounts of information
- Prioritizing which data is shown
- Reducing information to only shown what is most relevant rather than showing everything which results in fighting for the user’s attention
Know Your Users
- Determine who your target audience is
- Know and trust their abilities
- Establish the right level of complexity for your target audience
- Design for both returning visitors and first timers
Tips from a User Experience Strategist
- 1. Talk to users until you're bored
- 2. Obsess over efficiency of frequent use cases
- 3. Solve first-time use last, and test it hard
https://storify.com/miniver/why-you-should-save-ux-design-for-first-time-use-f
Establish Clear Paths to Discovery
- Overview
- Zoom
- Filter
- Details on Demand
- Relate
- History
- Extract
Visual Information Seeking Mantra
Overview first, zoom and filter, then details-on-demand
Data Visualization

Designing for Visualizations: Best Practices
- Use fewer than 6 colors
- Use opposing colors for comparisons
- Use opposing cool colors for backgrounds, warm colors for data
- Always include a title and label your axes (context is important)
- Legends should be larger and not rely on color alone
- Use as many tick marks as necessary without losing readibility (fall back to zoom + tooltips if more discrete ticks are necessary
5 Categories of Organizing Information
- Chronologically
- Alphabetically
- Geographically
- Categorically
- Hierarchically
Infographics
- Chronological narratives
- Narratives that require simple illustrations or multiple charts to tell the full story
- Cohesiveness in color
- Particular attention to hierarchy of text and each element
- Consistency in color and style
Visualizations
- Pie chart
- Donut chart
- Line graph
- Bar graph
- Scatter plot
- Tree map
- Node diagram
- Area
- Heat map
- Bubble
- Force-directed graph
http://peoplemaps.org/
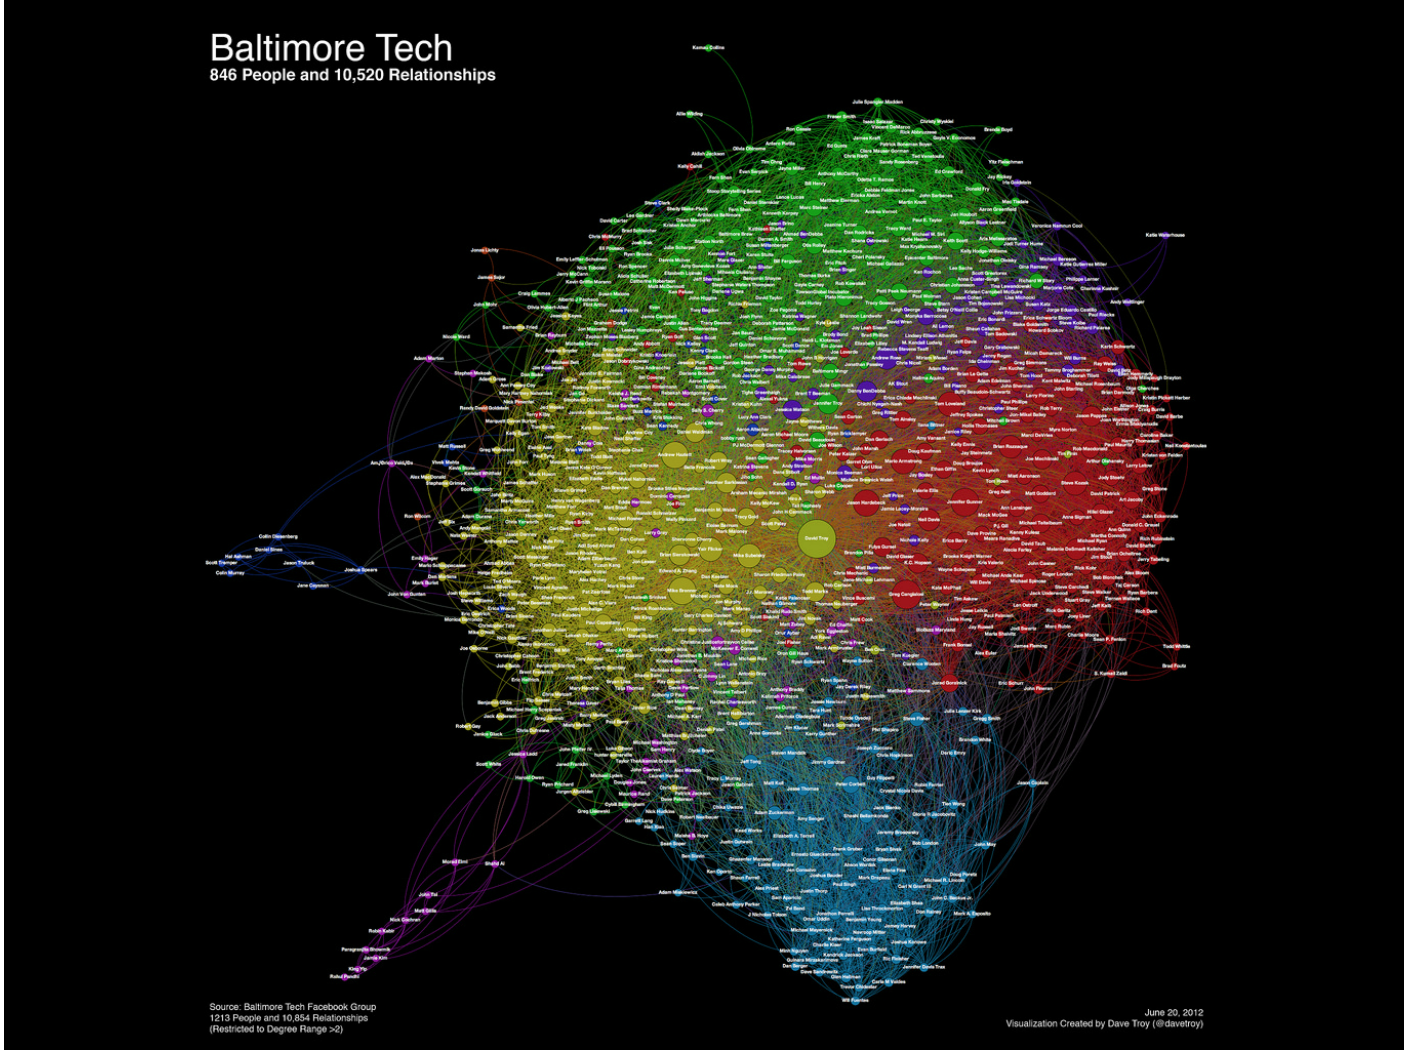
http://davetroy.com/posts/the-math-behind-peoplemaps
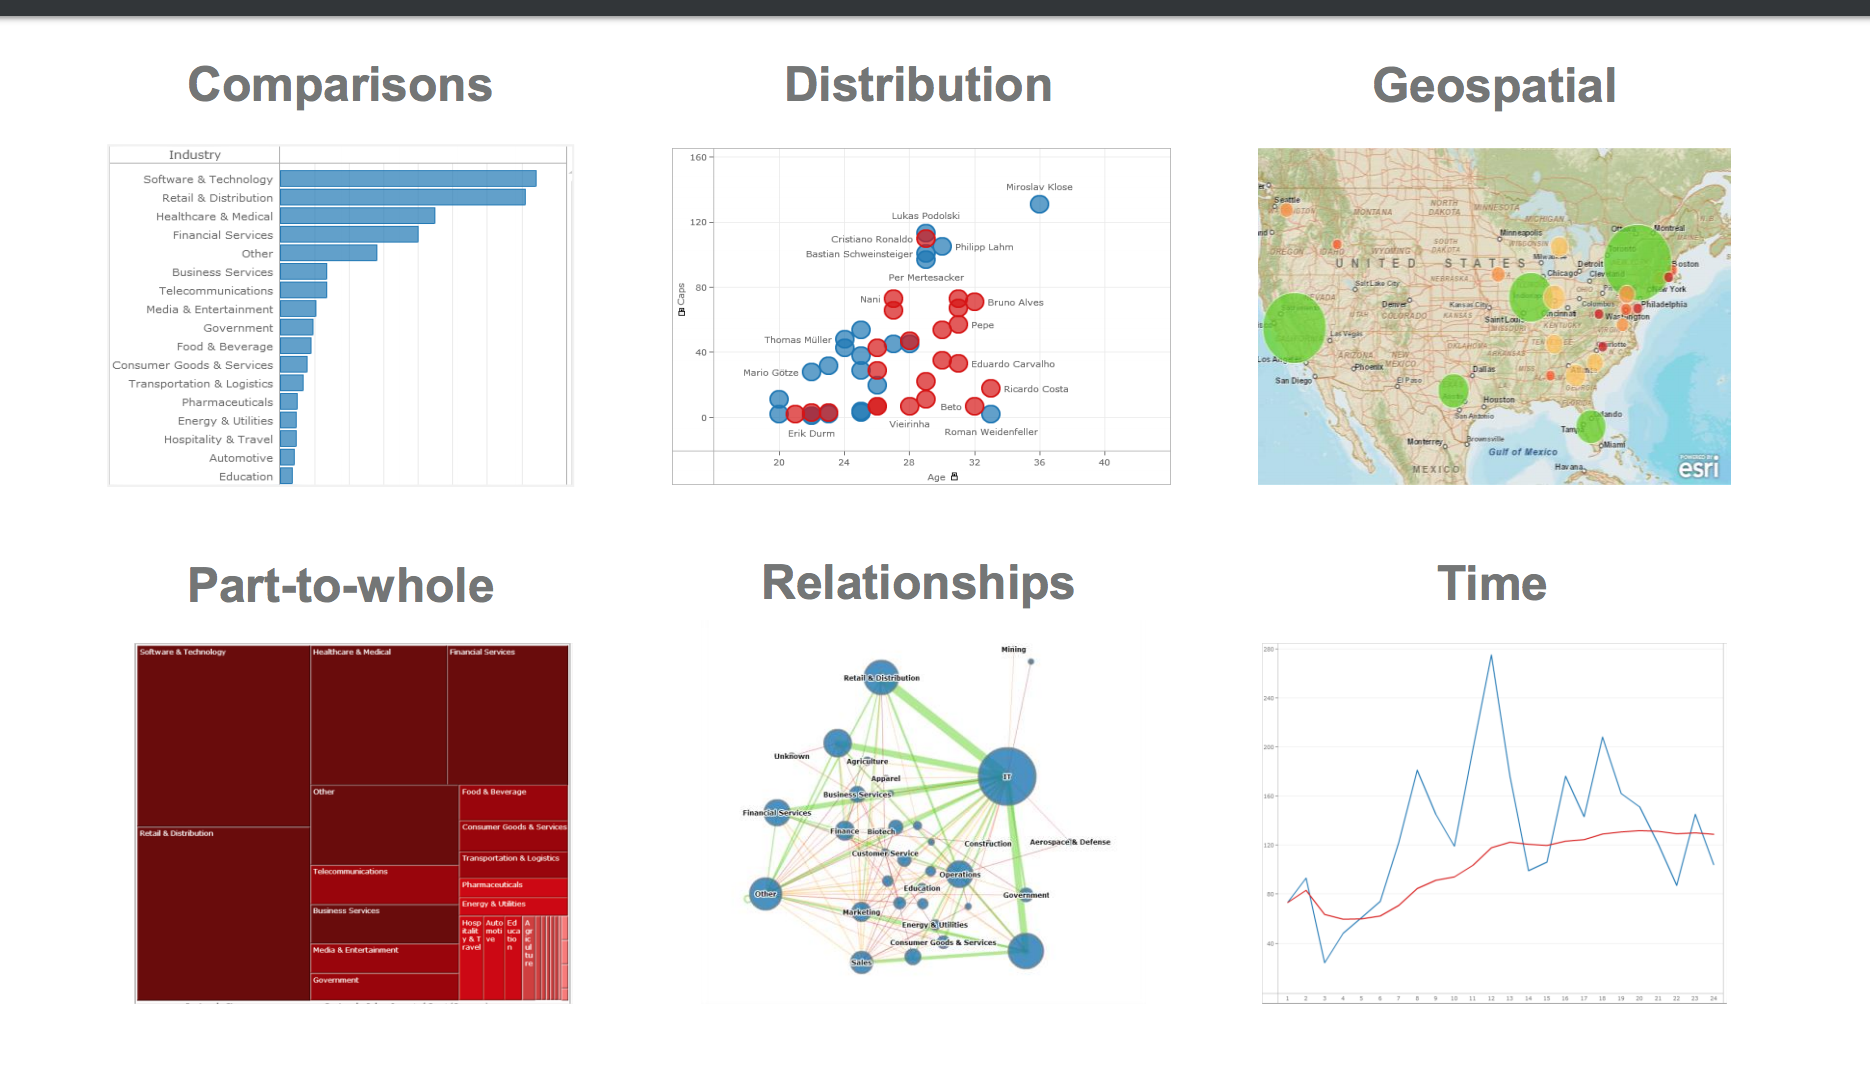
Which Visualization Type Works Best for the Data at Hand?
Project (due march 20)
- Choose a dataset (suggested datasets available on the class site)
- Export as .json (or tab-separated values .tsv / comma-separated values .csv if necessary) (Note: To look at the data so you can design from it, you can import a CSV into excel/numbers and create rough visualizations as a reference)
Project (due march 20)
Design a 1-page Data Visualization/Infographic Site
- One visualization/infographic based upon the dataset of your choosing
- Compelling title and ~250 words narrating the data (do not need to be contiguous: think labels/legend/captions/tooltips/button text/explanatory welcome message).
- Separate, linked page with 250-500 word methodology behind infographic (see example)
- What is timely? Provocative? Controversial? What do others need enlightening on in 2017?
- Bonus: Interactivity
Public Data
By brigittewarner


