Introduction to
Computer Vision-
Beginners' Session
By - Brihi Joshi and Shravika Mittal

WiFi
AP - 91springboard
user - Guest@del.okhla
pass - 91okhla
About Us
@brihijoshi
brihi16142@iiitd.ac.in
+91-8812012300
@mittalshravika
shravika16093@iiitd.ac.in
+91-9650357613

•Students – Brihi and Shravika
•Mentor – Kelsey
•Coaches –
* Dana
* Jigyasa
* Umair
* Sanchit
* Divam
* Diksha
•Supervisor – Vaishali
The Team

The Project
Tessel is a robust IoT and robotics development platform.
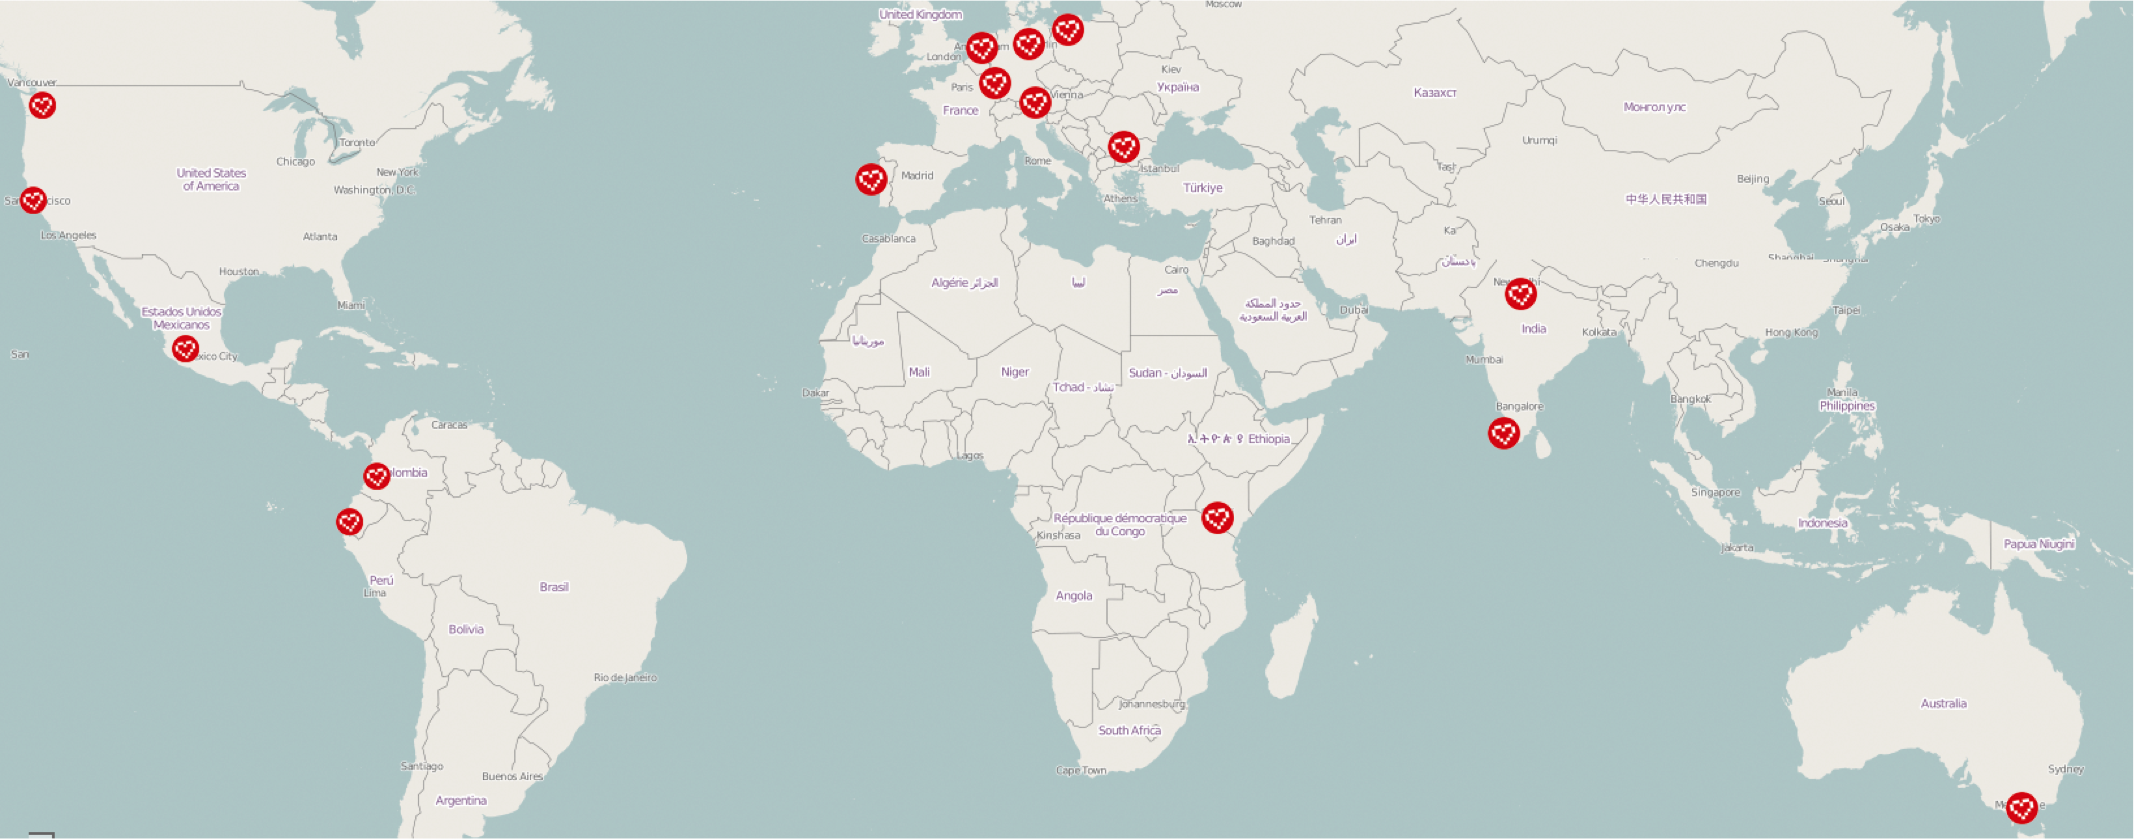
This year
20 teams
40 students
16 Sponsored Teams + 4 Volunteer Teams
....all over the world!
Some Projects
- Tessel
- Coala
- OpenFarm
- Susi AI Server
- NextCloud
- Babel
- Servo
- Foodsaving and Foodsharing
Let's check this out!
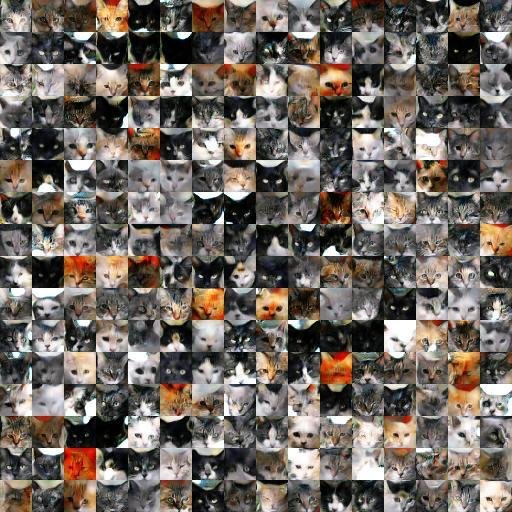
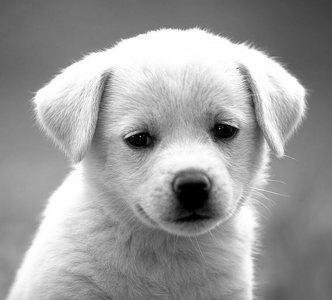
Computer Generated Cats
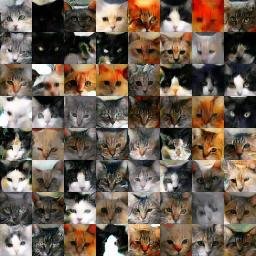
Real Cats

AI to rule the world!
...you're here too!
How to make a computer SEE?
MATH!
Activity Time
Describe a sunset to a computer!
Vision is HARD.
Vision is an amazing feat of natural intelligence
– Visual cortex occupies about 50% of Macaque brain
– More human brain devoted to vision than anything else
History time 🙌🏼
-
1966: Minsky assigns computer vision as an undergrad summer project
-
1960’s: interpretation of synthetic worlds
-
1970’s: some progress on interpreting selected images
-
1980’s: ANNs come and go; shift toward geometry and increased mathematical rigor
-
1990’s: face recognition; statistical analysis in vogue
-
2000’s: broader recognition; large annotated datasets available; video processing starts
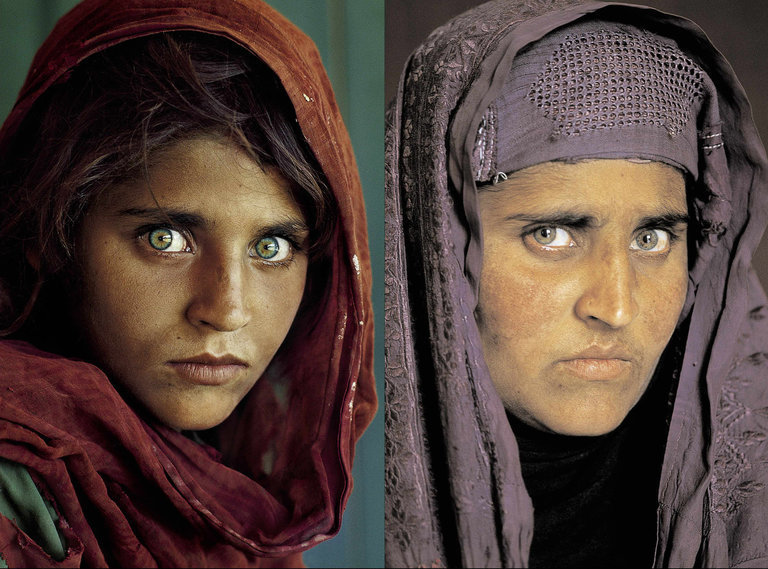
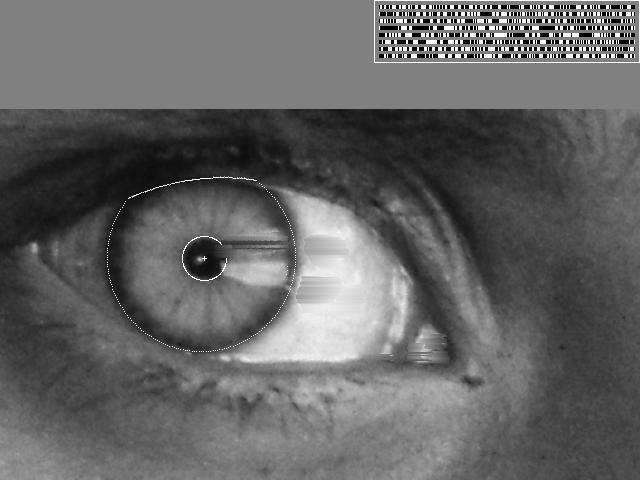
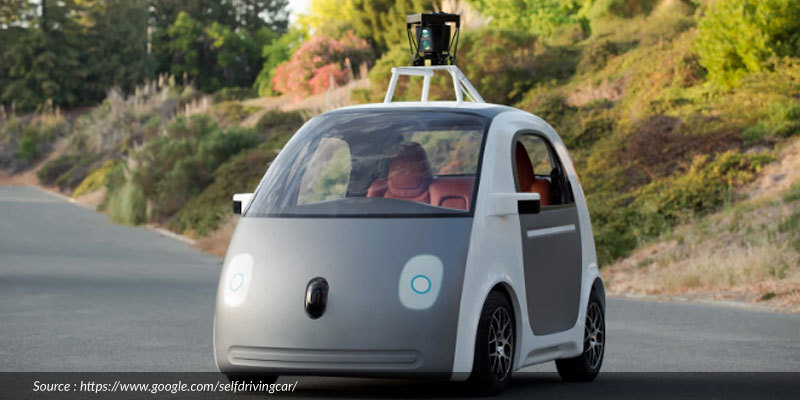
Anyone Remembers this picture?
Workflow
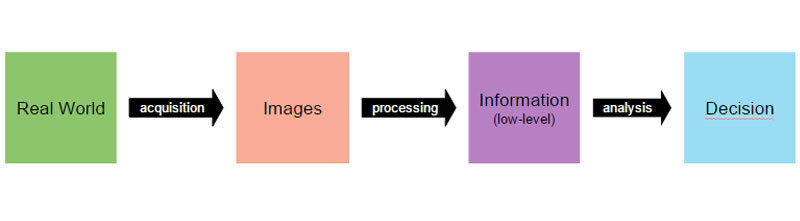
Image Processing
Low-level image processing algorithms include:
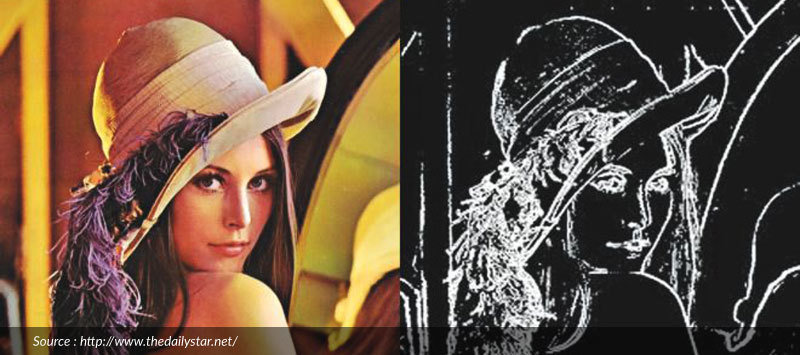
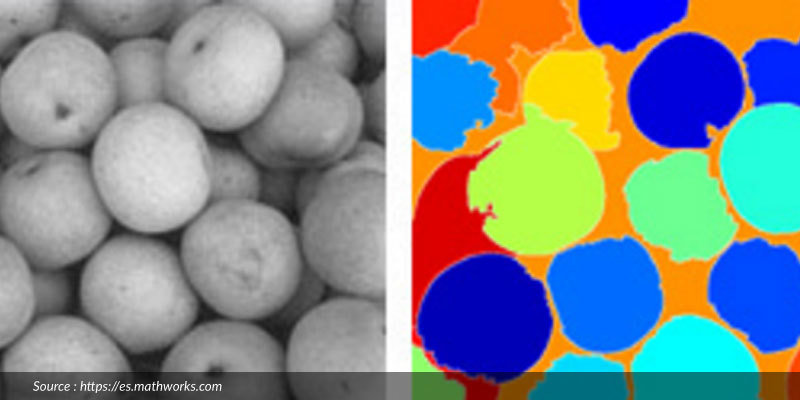
1. Edge detection
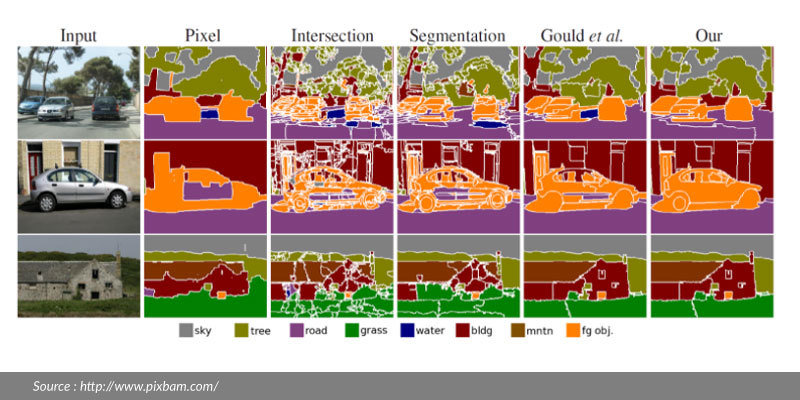
2. Segmentation
3. Classification
4. Feature detection and matching
Image Processing
Computer Vision
Determines if the actual analysis of the data, which will allow the decision making.
High-level algorithms are applied, using both the image data and the low-level information computed in previous steps.
Examples of high-level image analysis are:
1. 3D scene mapping
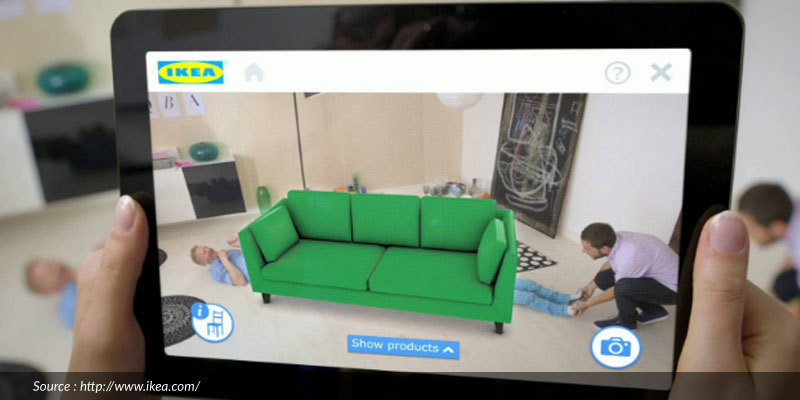
2. Object recognition
3. Object tracking
Computer Vision
Determines if the actual analysis of the data, which will allow the decision making.
High-level algorithms are applied, using both the image data and the low-level information computed in previous steps.
Examples of high-level image analysis are:
1. 3D scene mapping
2. Object recognition
3. Object tracking
Computer Vision

Let's Begin!
Installations!
https://github.com/brihijoshi/Intro-to-CV
How are Images represented in a computer?
Python Libraries 🤘🏼
OpenCV
- Most common tool
- Focuses on implementation of ML algorithms on Images
- Python Wrapper over a C/C++ compiler!
PIL
- Now known as Pillow, which is a famous fork of PIL (Python Imaging Library)
- Focuses on low-level image processing
scikit-image
- Part of the famous Scikit-learn family
- Similar to OpenCV in terms of use case
- Simpler Syntax
Basics of GrayScale Images
Gray scale doesn't necessarily mean only black and white pixels. Any two colours, whose pixel values vary in Intensity.
Binary images - Only two colours + solid colours
Gray Scale images - Two colours + different intensity of images
Intensity \in [0,255]
How would we represent a Gray Scale Image?
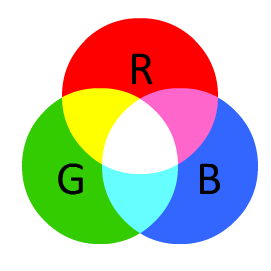
Basics of Colour 🎨
RGB
RGB is an additive color model. It means that different proportions of Red, Blue and Green light can be used to produce color. The RGB color model was created specifically for display purposes (display screens, projectors etc).
A key concept one should understand is that RGB is simply an additive combination of narrow band waves.
OpenCV follows BGR model!
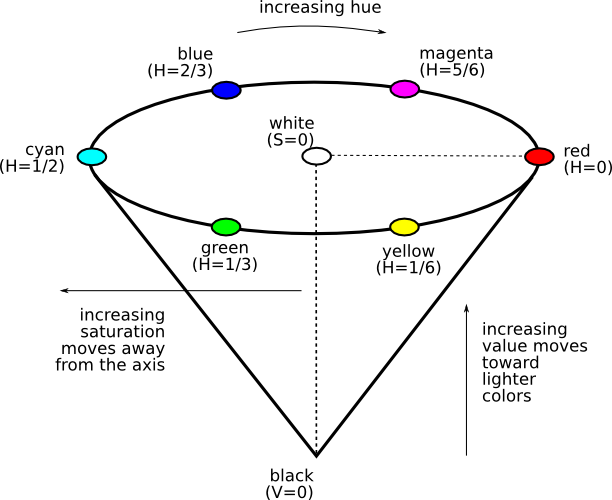
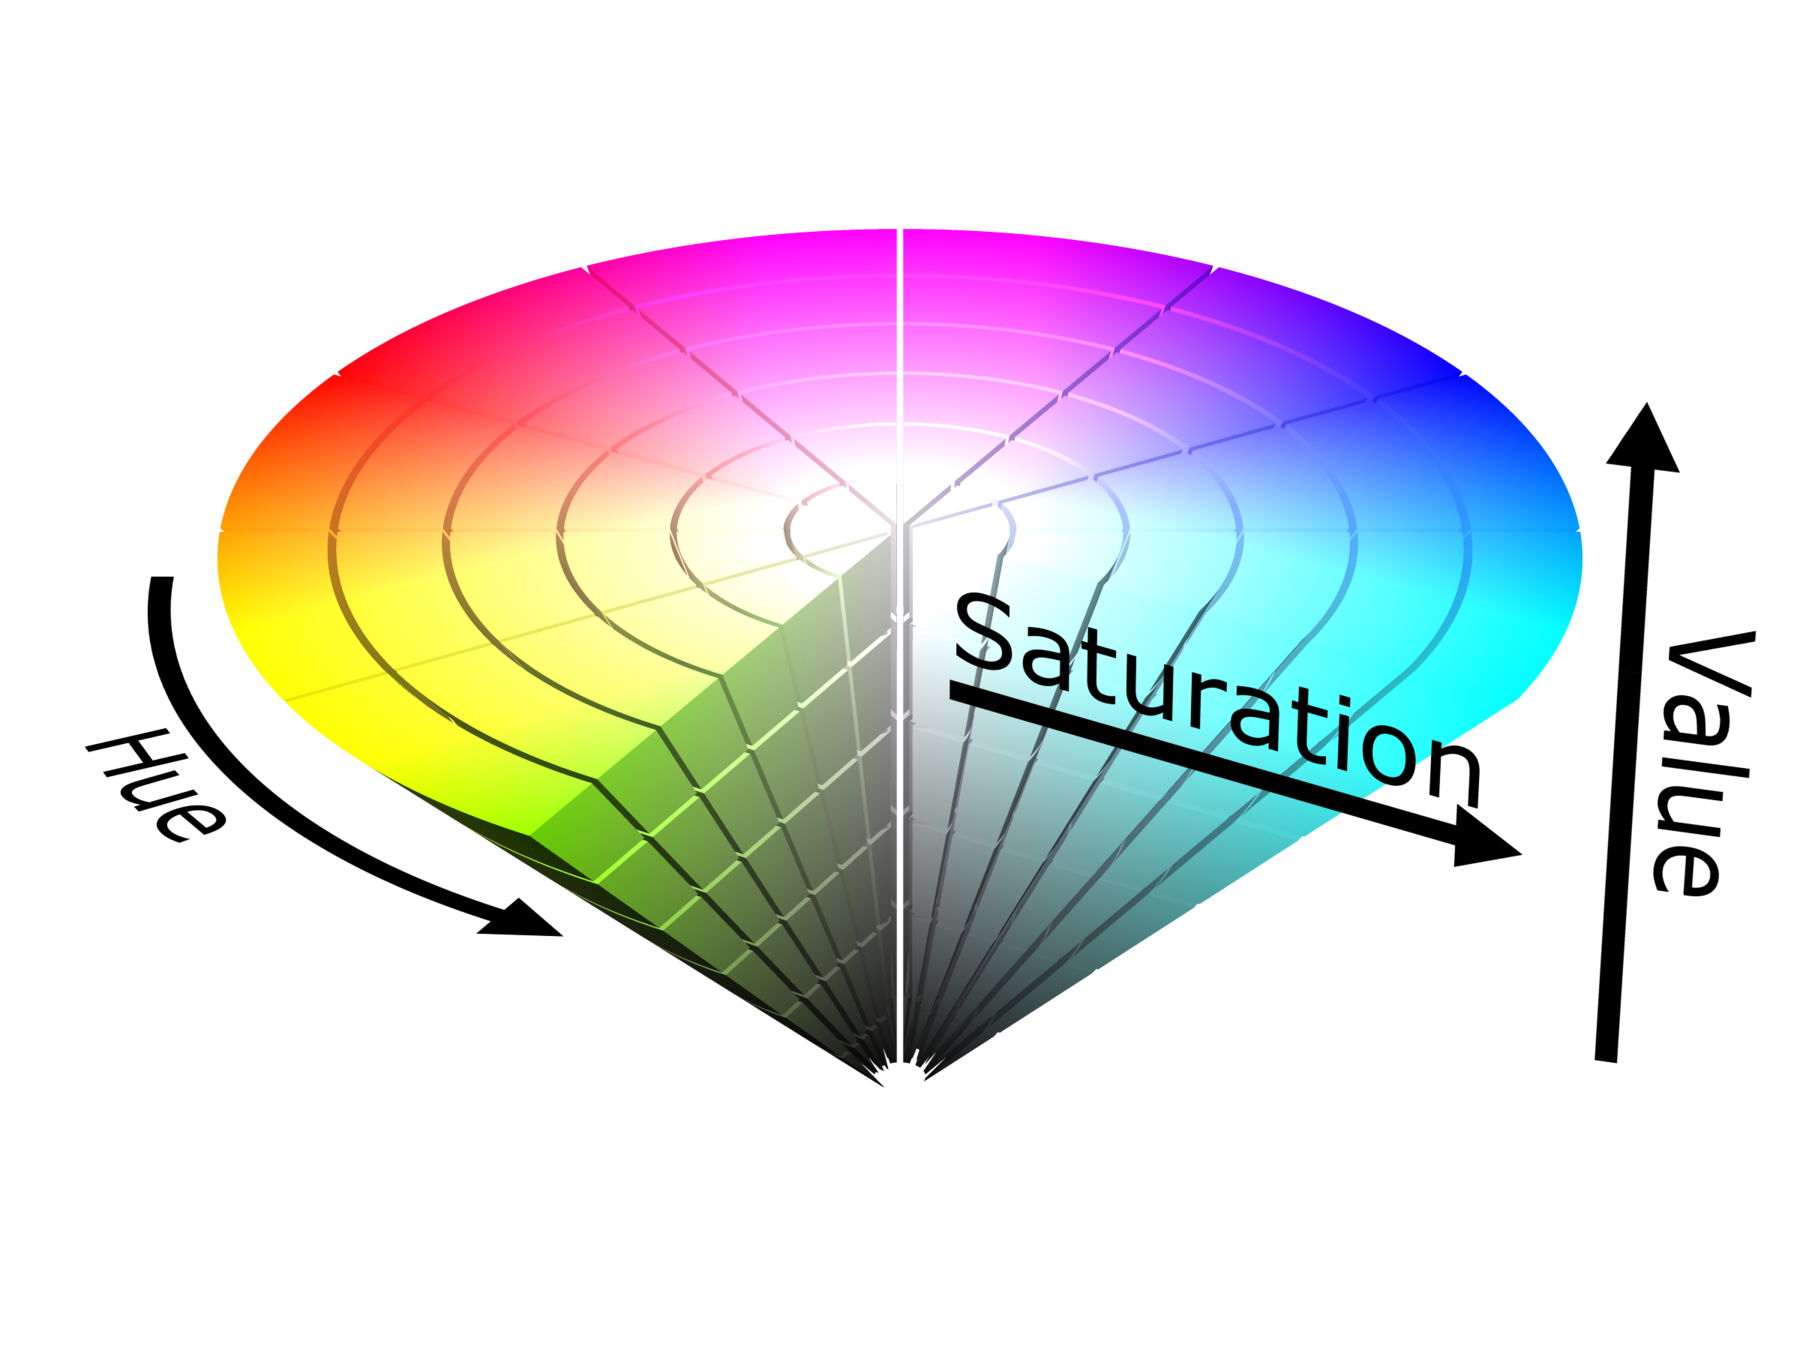
HSV
-
The hue (H) of a color refers to which pure color it resembles. All tints, tones and shades of red have the same hue.
Hues are described by a number that specifies the position of the corresponding pure color on the color wheel, as a fraction between 0 and 1. Value 0 refers to red; 1/6 is yellow; 1/3 is green; and so forth around the color wheel.
-
The saturation (S) of a color describes how white the color is. A pure red is fully saturated, with a saturation of 1; tints of red have saturations less than 1; and white has a saturation of 0.
-
The value (V) of a color, also called its lightness, describes how dark the color is. A value of 0 is black, with increasing lightness moving away from black.
How to represent coloured images?
Each pixel has an R,G,B value. OpenCV follows BGR pattern
For Gray Scale Images?
http://math.hws.edu/graphicsbook/demos/c2/rgb-hsv.html
Let's get a little Math!
AND/OR/XOR Operations
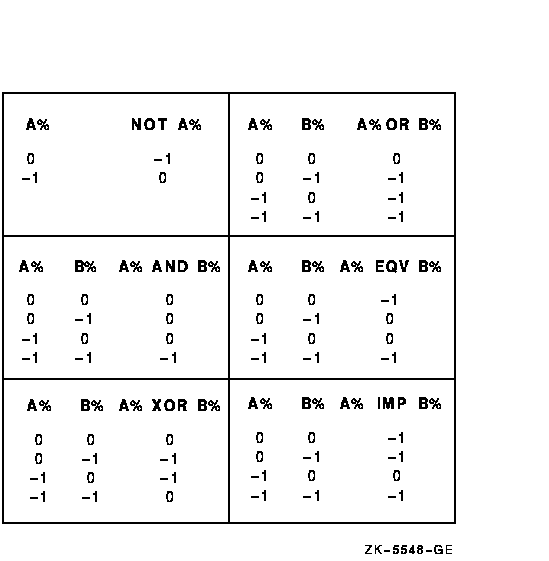
Bitwise operations?
Ooooh..
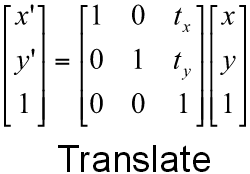
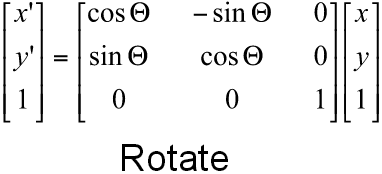
Matrices!
Transformation Matrices?
Translation
Rotation
Let's think a little
What if a computer has to make edges?
....to be continued.
Thanks to -
- http://opencv-python-tutroals.readthedocs.io/en/latest/py_tutorials/py_tutorials.html
- https://dsp.stackexchange.com/questions/2687/why-do-we-use-the-hsv-colour-space-so-often-in-vision-and-image-processing
Some cool resources :)
- http://opencv-python-tutroals.readthedocs.io/en/latest/py_tutorials/py_tutorials.html
- http://cs.nyu.edu/~fergus/teaching/vision/index.html
- http://crcv.ucf.edu/courses/CAP5415/Fall2014/index.php
- https://courses.engr.illinois.edu/cs543/sp2015/
- https://github.com/jbhuang0604/awesome-computer-vision
fin.

WWCD_Intro-to-CV
By BRIHI JOSHI

