Google Earth Engine
An Introduction
Examples of output in apps
Outline
- (on your own) Basics of JavaScript for GEE use
- User Interface
- Add Data
- Export data
- clip to country
- simple band math
- change over time
- Average over 10 days
Basic of JavaScript
for GEE
Google Earth Engine
Data Repository (data as a service)
Software as a Service
User Interface
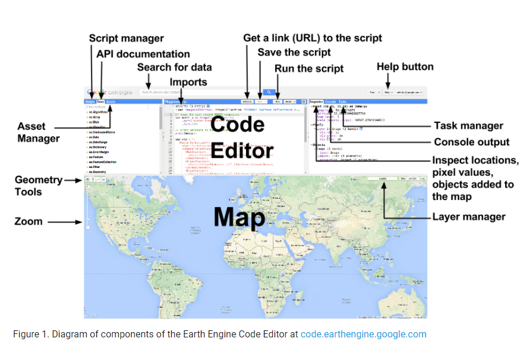
Quick tip: Find lat long
Click anywhere in the map pane and then
look in the Inspector window
Personal tip
copy code and keep notes in a text editor,
save as js files
keep what works
I like to use https://www.sublimetext.com/3
Tutorial
Two ways to add data
Import the data (search within GEE)
Add it manually
Search and the
Add data
there are many ways to do this...
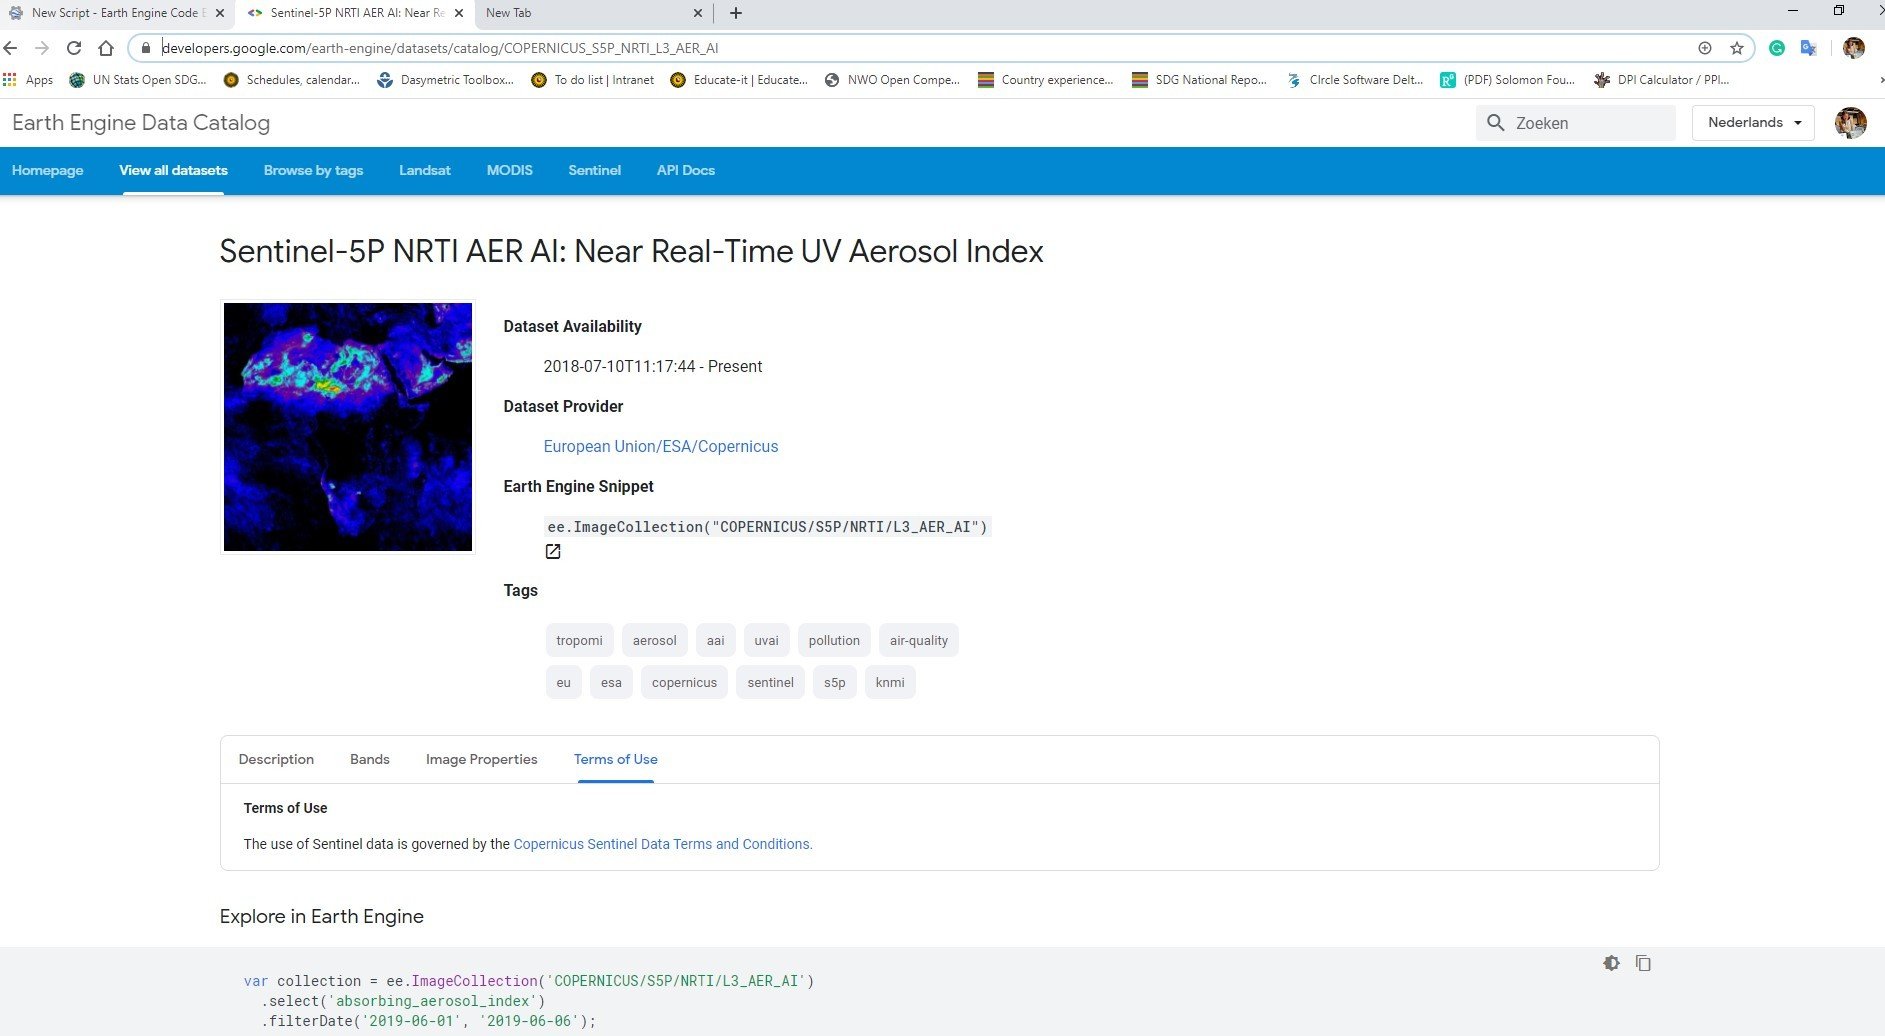
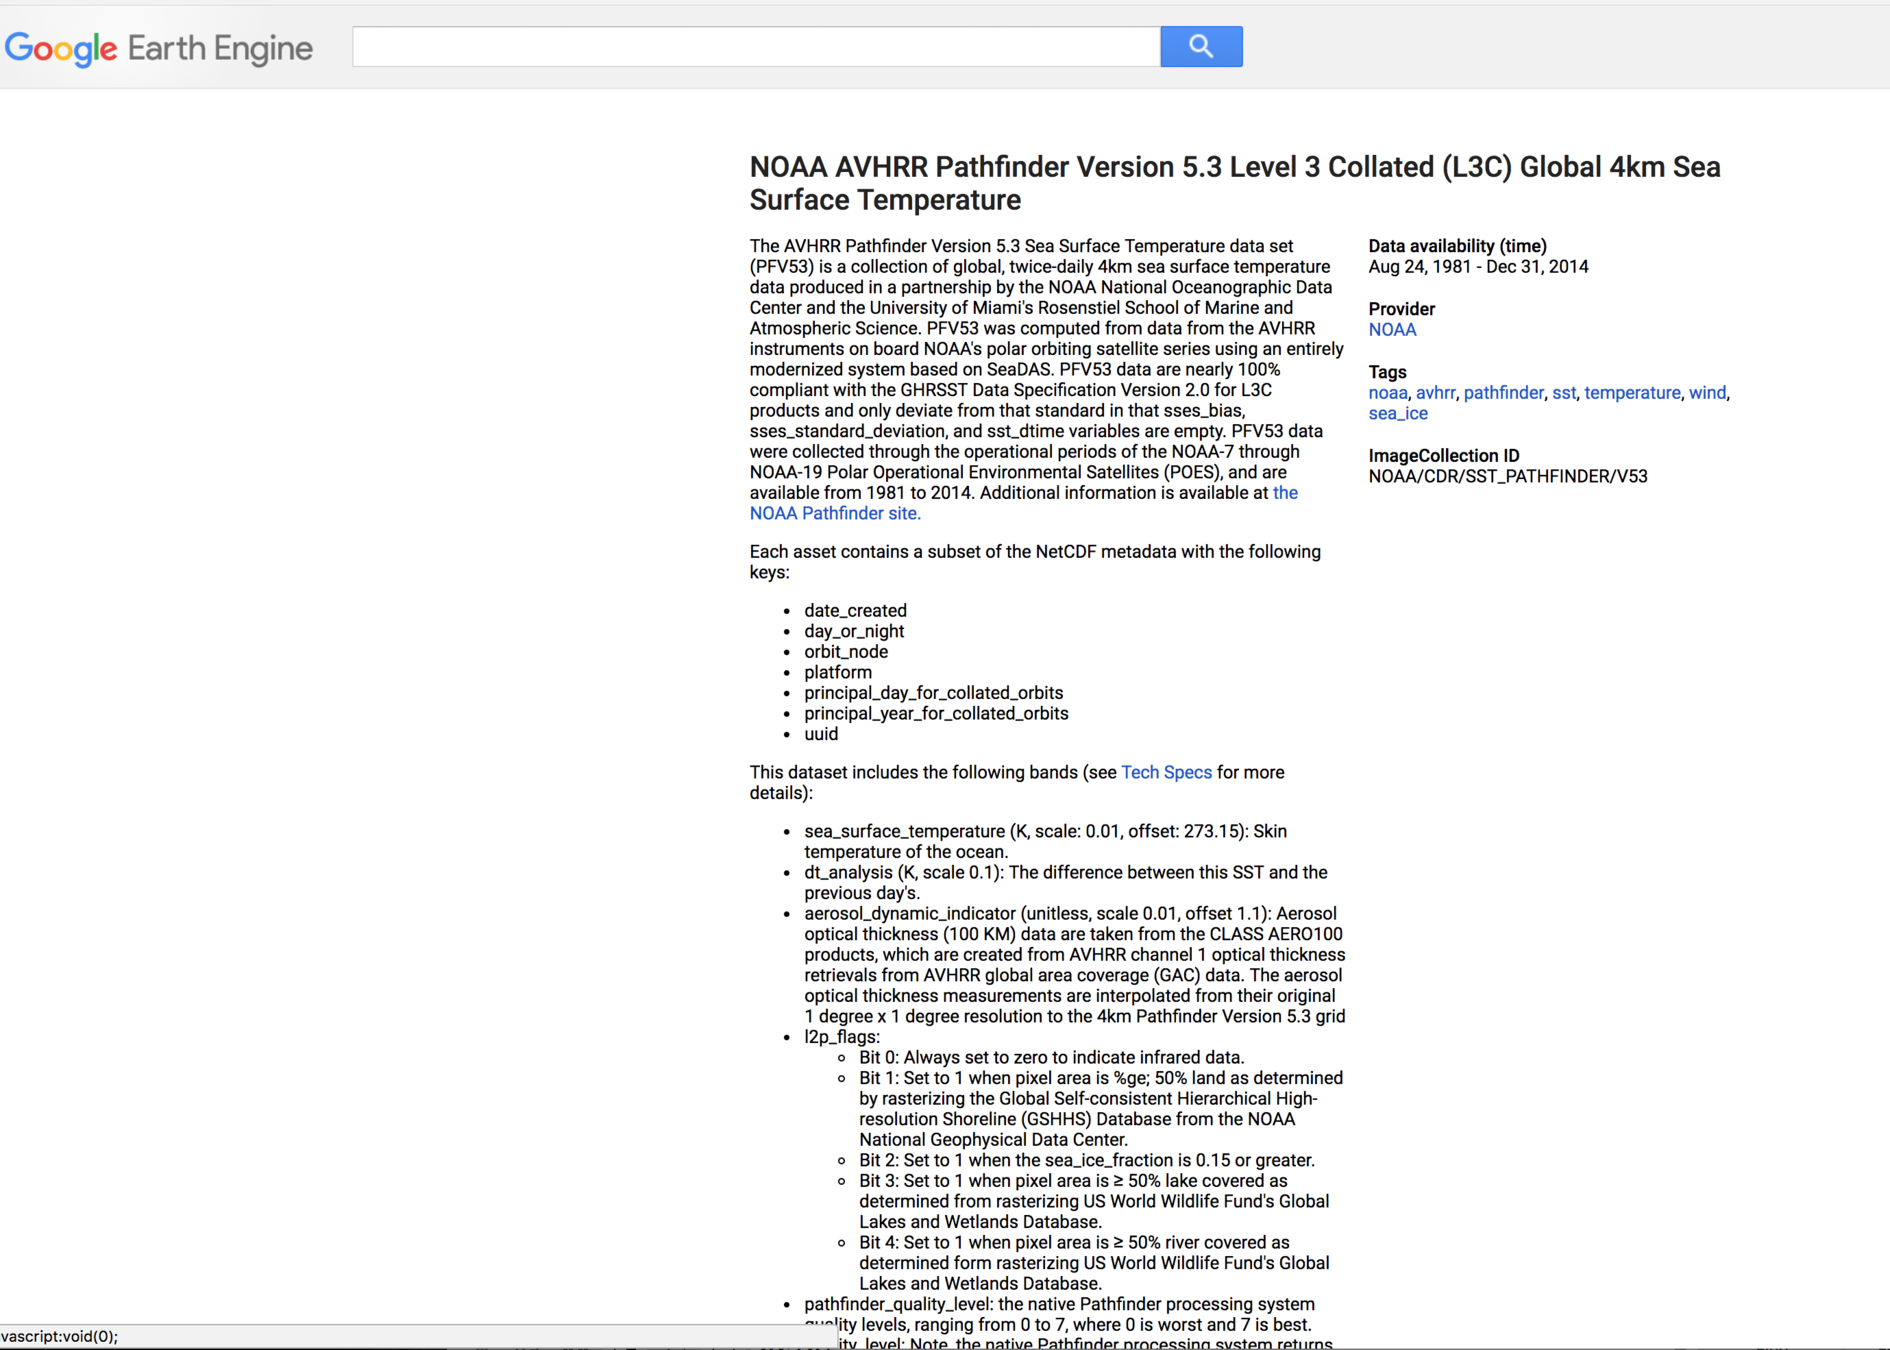
- Search for data
- Let's look at the data available
- https://developers.google.com/earth-engine/datasets/catalog/
Text
Text
Text
What do you think this script does?
var image = ee.Image('CGIAR/SRTM90_V4');
Map.setCenter(-112.8598, 36.2841, 9);
Map.addLayer(image);
Do the comments match what you thought?
// Instantiate an image with the Image constructor.
var image = ee.Image('CGIAR/SRTM90_V4');
// Center on the Grand Canyon and zoom there.
Map.setCenter(-112.8598, 36.2841, 9);
// Display the image on the map.
Map.addLayer(image);
cut and paste this into
Google Earth Engine and run it!
Change data
- pick another data set
- Change the color scheme
- user interface
- javascript
// Instantiate an image with the Image constructor.
var image = ee.Image('NOAA/NGDC/ETOPO1');
//visualize the data in some way - set the visualization parameters. First you need to explore the properties to see what would make sense //here.
var visParams = {bands: ['ice_surface'], min: -10000, max: 500, palette: ['blue', 'green', 'orange']};

// Display the image on the map.
Map.addLayer(image, visParams);


//printing properties will help you decide what to visualize and how.
print('ETOPO1 image', image);
Call data from a different dataset
then more change parameters
Let's add one Landsat Image
and one band only
cut paste - what happens?
 //// Load a Landsat 8 image and display the thermal band.
var image = ee.Image('LANDSAT/LC08/C01/T1_TOA/LC08_044034_20140318');

Map.setCenter(-122.1899, 37.5010, 13); // SF Bay
Map.addLayer(image, {bands: ['B10'], min: 270, max: 310}, 'image');
Collection=
all of the images!
  // Load a Landsat 5 image collection.
var collection = ee.ImageCollection('LANDSAT/LT05/C01/T1_TOA')
  // Tacoma area.
  .filter(ee.Filter.eq('WRS_PATH', 46))
  .filter(ee.Filter.eq('WRS_ROW', 27))

//render the map

Map.addLayer(collection);
Filter the collection of Landsat Images
// Load a Landsat 5 image collection.
var collection = ee.ImageCollection('LANDSAT/LT05/C01/T1_TOA')
// Tacoma area.
.filter(ee.Filter.eq('WRS_PATH', 46))
.filter(ee.Filter.eq('WRS_ROW', 27))
// Filter cloudy scenes.
.filter(ee.Filter.lt('CLOUD_COVER', 30))
// Get 20 years of imagery.
.filterDate('1991-01-01','2011-12-30')
// Need to have 3-band imagery - trying to highlight urban areas
.select(['B7', 'B5', 'B3'])
// Need to make the data 8-bit.
.map(function(image) {
return image.multiply(512).uint8();
});
//get the map to render in the map pane
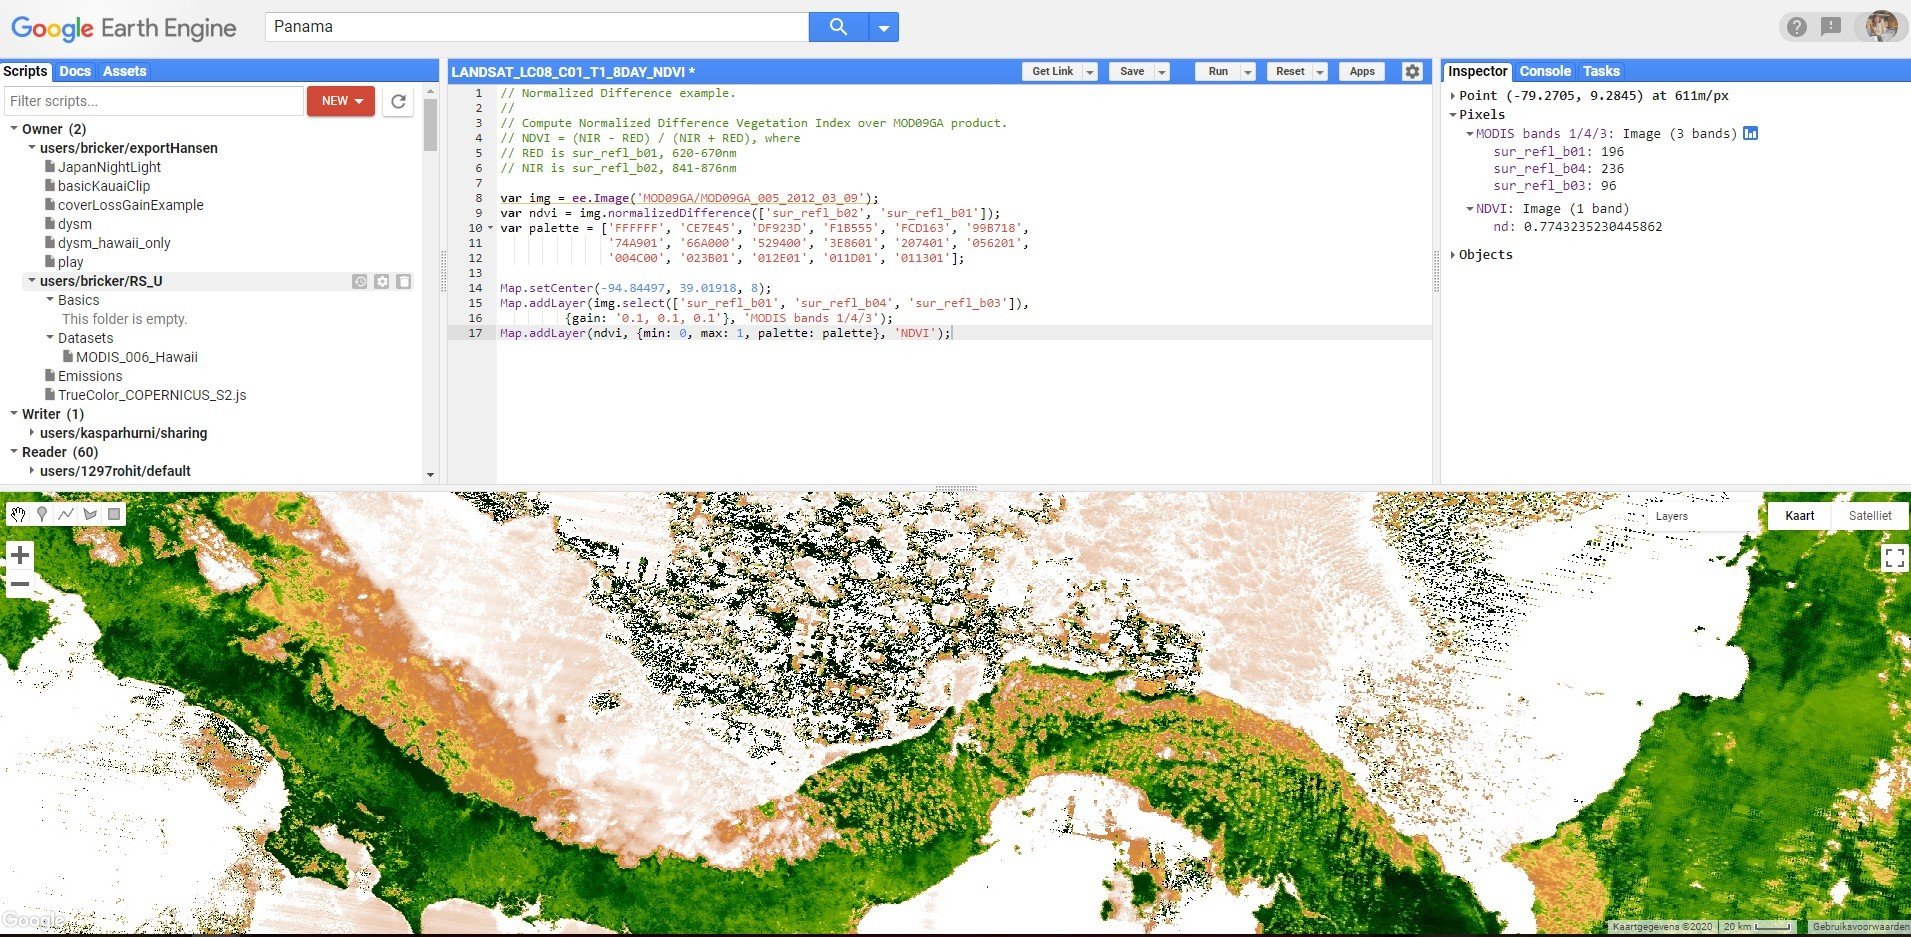
Map.addLayer(collection);NDVI example
// Normalized Difference example.
//
// Compute Normalized Difference Vegetation Index over MOD09GA product.
// NDVI = (NIR - RED) / (NIR + RED), where
// RED is sur_refl_b01, 620-670nm
// NIR is sur_refl_b02, 841-876nm

var img = ee.Image('MOD09GA/MOD09GA_005_2012_03_09');
var ndvi = img.normalizedDifference(['sur_refl_b02', 'sur_refl_b01']);
var palette = ['FFFFFF', 'CE7E45', 'DF923D', 'F1B555', 'FCD163', '99B718',
               '74A901', '66A000', '529400', '3E8601', '207401', '056201',
               '004C00', '023B01', '012E01', '011D01', '011301'];

Map.setCenter(-94.84497, 39.01918, 8);
Map.addLayer(img.select(['sur_refl_b01', 'sur_refl_b04', 'sur_refl_b03']),
         {gain: '0.1, 0.1, 0.1'}, 'MODIS bands 1/4/3');
Map.addLayer(ndvi, {min: 0, max: 1, palette: palette}, 'NDVI');
Run through and example:
I need the following
- Pick dataset
- Find and area
- date range and filter clouds
- Clip area
- band math - calculate something
- export
Run through and example:
I need the following
- Pick dataset: Landsat 8
- Find and area: Tonga
- date range and filter clouds
- Clip area
- band math - calculate something
- export
Center on Tonga
Make True color composite
//calling landsat 8 images - only looking for imagery that covers a single point. Searching for images between these dates
var tonga = ee.ImageCollection('LANDSAT/LC08/C01/T1')
                 .filterBounds(ee.Geometry.Point(-175.2312, -21.1612))
                  .filterDate('2014-01-01', '2019-12-31');

  // Sort by a cloud cover property, get the least cloudy image. The print statements means I can use the console and inspector window to read metadata
var image = ee.Image(tonga.sort('CLOUD_COVER').first());
print('Least cloudy image: ', image);

//only show me the following bands represetned as a true color composite in the map display

var trueColor432 = image.select(['B4', 'B3', 'B2']);
var trueColor432Vis = {
  min: 0.0,
  max: 30000.0,
};

//Centered on Tonga and show me in the map
Map.setCenter(-175.2312, -21.1612, 6);
Map.addLayer(trueColor432, trueColor432Vis, 'True Color (432)');
Center on Tonga
Looking at the meta data, I see this image is
LANDSAT/LC08/C01/T1/LC08_069075_20190705
make false color composite
what is possible?
examples
https://gisgeography.com/landsat-8-bands-combinations/
This band combination is also called the near infrared (NIR) composite. It uses near-infrared (5), red (4) and green (3). Because chlorophyll reflects near infrared light, this band composition is useful for analyzing vegetation. In particular, areas in red have better vegetation health. Dark areas are water and urban areas are white.
//calling landsat 8 images - only looking for imagery that covers a single point. Searching for images between these dates
var tonga = ee.ImageCollection('LANDSAT/LC08/C01/T1')
                 .filterBounds(ee.Geometry.Point(-175.2312, -21.1612))
                  .filterDate('2014-01-01', '2019-12-31');

  // Sort by a cloud cover property, get the least cloudy image.
var image = ee.Image(tonga.sort('CLOUD_COVER').first());
print('Least cloudy image: ', image);

//only show me the following bands to highlight vegitation NIR composite in the map display - notice I change the variable names

var NIR = image.select(['B5', 'B4', 'B3']);
var NIRColor543Vis = {
  min: 0.0,
  max: 30000.0,
};

//Centered on Tonga and show me in the map changed variable names
Map.setCenter(-175.2312, -21.1612, 6);
Map.addLayer(NIR, NIRColor543Vis, 'veg (543)');
Calculate NDVI for this specific image
Export your data
lots of options!
https://developers.google.com/earth-engine/exportingYou may want to export data to use in ArcGIS/QGIS
Make a map for your wall
share on social media...
Export your data
lots of options!
Intro Google Earth Engine
By Britta Ricker
Intro Google Earth Engine
Introduction to Google Earth Engine


