3D Geovisualization
Assignment

Britta Ricker, PhD
M-GEO Extract/Analysis and Dissemination GeoData
ITC

Objectives of this assignment
- Design and develop a 3D geovisualization of Tegucigalpa to identify and communicate areas of land use change or areas of potential hazards/disasters
- Design and develop an animation using ArcGIS Pro
-
Implement design principles learned in lecture
-
Build upon knowledge and data from previous assignments
Today in Class
- GIS & Remote Sensing
- Color Composites
- 3D Geovizualition
- Walk through:
- ArcGIS Online
- ArcScene
- ArcGIS Pro
Disaster and Land Use


Maps can help reduce complexity

Vanacker (2016) Impact of deforestation on slope stability
Geographic Information
Science
Geographic Information Systems(GIS)

Geographic Information Systems (GIS)


Online "slippy" maps

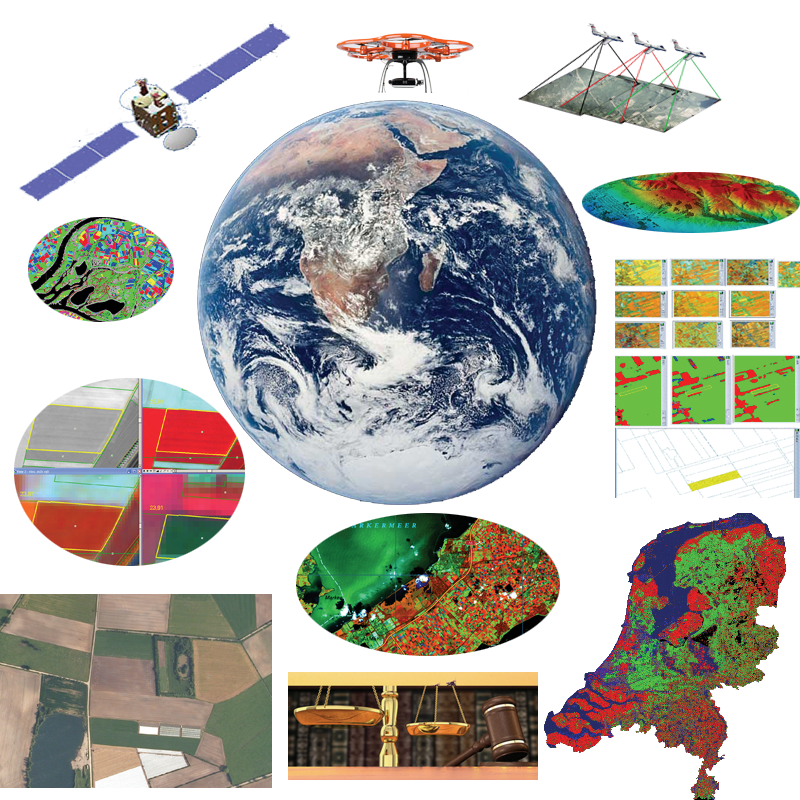
Remote Sensing
Temporal Resolution: Revisit Every 5 days
True Color

Details
From Sentinel 2
Date of image: 22 Feb 2017
Spatial Resolution:
Each pixel represents 20 m
2325 columns
2960 rows of pixels

Sentinel 2
Active Sensor
Passive Sensor

Lidar


1 m resolution!
Electromagnetic Energy
Features on the Earth reflect, absorb, transmit, and emit electromagnetic energy from the sun.

Properties of electromagnetic energy
Multispectral imagery
wavelength, fequency, amplitude

The visible spectrum is small!

What else is collected?
Bands and spectral ranges

Spectral signature

How are images rendered on our screen?
3 bands projected light
The primary colors are Red, Green, Blue
True Color
= Band 4 Red
= Band 3 Green
= Band 2 Blue

False Color Composites

Urban areas

Urban=Purple
= Band 12 SWIR II
= Band 11 SWIR I
= Band 4 Red
Vegetation
= Band 8 NIR
= Band 4 Blue
= Band 3 Red

Spectral signature
Bands and spectral signatures


Healthy vegetation


Normalized Difference Vegetation Index
NDVI=NIR-IR/NIR+IR
Animation
Lab Assignment:
Create a 3D geovisualization of Teguciglapa to show land use change over time.
Example:
areas where landslides be connected to land use change?
Future Lessons:
Classification
Supervised & Unsupervised

Animation
Slider
Sentinel-1 images track the major flooding in Kerala during the 2018 monsoon season
Slider
Land use change:
Malakal refugee camp in South Sudan
Digital Globe
Cloud Computing


-
valuable for information dissemination
-
faster and more data processing that was not previously possible
-
data access
Google Earth Engine
-
Cloud-based platform for geospatial analysis
-
Access over 40 years of satellite imagery
-
Upload own data sets to integrate with publicly available data
-
Apply range of common algorithms to data
-
Export images, tables, charts, map outputs


Hansen et al (2013)
High-Resolution Global Maps of 21st-Century Forest Cover Change, Science
15 Nov. Vol. 342, Issue 6160, pp. 850-853 DOI: 10.1126/science.1244693.

McSweeney (2017) Cocaine trafficking is destroying Central Americ's forests
Title Text
// Load Sentinel-2 TOA reflectance data.
var dataset = ee.ImageCollection('COPERNICUS/S2')
                  .filterDate('2018-01-01', '2018-12-30')
                  // Pre-filter to get less cloudy granules.
                  .filter(ee.Filter.lt('CLOUDY_PIXEL_PERCENTAGE', 20))


//true color
var rgbVis = {
  min: 0.0,
  max: 2500,
  bands: ['B4', 'B3', 'B2'],
};
//urban visualization
var urbanVis = {
  min: 0.0,
  max: 2500,
  bands: ['B12', 'B11', 'B4'],
};

//Agriculture visualization
var agVis = {
  min: 0.0,
  max: 2500,
  bands: ['B11', 'B8', 'B2'],
};
//Healthy vegitation visualization
var VegVis = {
  min: 0.0,
  max: 2500,
  bands: ['B8', 'B11', 'B2'],
};

//Land Water visualization
var WaterVis = {
  min: 0.0,
  max: 2500,
  bands: ['B8', 'B11', 'B4'],
};

//Utrecht
Map.setCenter(5.104480, 52.092876, 11);

//different layers
Map.addLayer(dataset.median(), rgbVis, 'RGB');
Map.addLayer(dataset.median(), urbanVis, 'Urban');
Map.addLayer(dataset.median(), agVis, 'Agriculture');
Map.addLayer(dataset.median(), VegVis, 'Vegitation');
Map.addLayer(dataset.median(), WaterVis, 'Water');

//END
Summary
Benefits of CyberGIS
- Data access
- Distributed data processing
- Information dissemination through interactive visualizations
Hands on How to:
ArcScene and ArcGIS Pro
We use these tools to add data and create 3D renderings and animations
Then we will put them online
and how it was made https://bit.ly/2OfnkZu
not a great example!
Series of helpful ArcGIS Pro tutorials to help you achieve the goals set forth in this assignment
Change symbology in ArcGIS Pro
•https://pro.arcgis.com/en/pro-app/help/mapping/layer-properties/extrude-features-to-3d-symbology.htm
Make an animation
Animation https://pro.arcgis.com/en/pro-app/help/mapping/animation/overview-of-animation.htm
Essay: What are 3D geovisualizations?
How are they useful for land use change monitoring?
Essay: What was your communication goal in the 3D geovisualization you created?
Do you think you achieved your goal? why or why not?
in class discussion: Spatial and
temporal resolution
What do these terms mean and how are they different?

Name two different Visualization techniques to show change over time.
Thank you!

3d geoviz and land use change
By Britta Ricker


