Put a map on it.
Learning basic JavaScript though the use of popular map JS API
In Class Tonight
- Go over Lab 2 together
- Discuss what has come up so far
- in class work time
- Break into two groups to discuss readings
- Voronoi
GIS Day
http://www.wsdot.wa.gov/mapsdata/gisday.htmWashington State Joint Agency GIS Day
Join us for the annual worldwide celebration of GIS Day!
You are invited to join the 6th annual Joint Agency GIS Day event in Olympia, Washington.
The event is intended to provide Geographic Information Systems (GIS) professionals an opportunity to share information about the GIS data, software, tools, and custom applications that their agencies are using to transform the way that they manage their assets, serve their customers/citizens, make decisions, and communicate.
Popular Map APIs out there
- Google Maps API
- Leaflet
- MapBox
- ArcGIS API for JavaScript
JavaScript
is the common denominator
all configured a bit different
different
base maps
functionality
similarities
base maps
functionality
JavaScript
JavaScript are scripts - sets of instructions
Tell the HTML
You still need to tell the HTML where to find these scripts and how to interpret them.
You can include the script in the HTML
or in separate files
These API map libraries
- Still require CSS calls
- Different tutorials within the same API may look different!
A few rules about JavaScript
- statements (instructions!) end with a semicolon;
- curly braces indicate start and end of a code block { }
- JavaScript is case sensitive
- Each statement should start on a new line and end with a ; (makes it easier for human to read code)
More tips for writing JavaScript
- Leave lots of comments to explain what your code does
- /* for multiple lines of comments or // in the same line as the code
tips
- create js folder and files to house scripts
- Then you can call these scripts into an HTML page
- JavaScript runs where it is found in the HTML
Variables
- declare a variable
- assign a value
- data types =
- String ('Hi, Class!')
- Boolean (true)
- Numeric (0.98)
Rules for Variables
- All variables are case sensitive (do not name two variables same name with different cases!)
- Do not use keywords or reserved words (example var is a keyword for variable)
- variables must start with letter, $, or underscore, NOT a number
- You can't use a dash - or . period in a var name
- Use a name that describes the kind of info the variable stores
- if you need to use more than one word, capitalize letter after first word (ie. lastName)
JavaScript:
Objects and Methods
- object is the thing
- method tells it what to do
- parameters of the method tell it specifically what to do
Google Maps API
control the map!
Add a point
<!DOCTYPE html>
<html>
  <head>
    <style>
       #map {
        height: 400px;
        width: 100%;
       }
    </style>
  </head>
  <body>
    <h3>Hello Tacoma</h3>
    <div id="map"></div>
    <script>
      function initMap() {
        var Tacoma = {lat: 47.325, lng: -122.46};

        var map = new google.maps.Map(document.getElementById('map'), {
          zoom: 11,
          center: Tacoma
        });
        var marker = new google.maps.Marker({
          position: Tacoma,
          map: map
        });
      }
    </script>
    <script async defer
    src="https://maps.googleapis.com/maps/api/js?key=AIzaSyBn3zquptShb1gU_Esyo4EAwJa7DDvDeto&callback=initMap">
    </script>
  </body>
</html>
Google Maps API
Same thing,
slightly different code.
What are the differences?
<!DOCTYPE html>
<html>
  <head>
    <title>Simple Map</title>
    <meta name="viewport" content="initial-scale=1.0">
    <meta charset="utf-8">
    <style>
      /* Always set the map height explicitly to define the size of the div
       * element that contains the map. */
      #map {
        height: 100%;
      }
      /* Optional: Makes the sample page fill the window. */
      html, body {
        height: 100%;
        margin: 0;
        padding: 0;
      }
    </style>
  </head>
  <body>
    <div id="map"></div>
    <script>
      var map;
      function initMap() {
        map = new google.maps.Map(document.getElementById('map'), {
          center: {lat: 47.225, lng: -122.46},
          zoom: 8

        });
      }
    </script>
    <script src="https://maps.googleapis.com/maps/api/js?key=AIzaSyBn3zquptShb1gU_Esyo4EAwJa7DDvDeto&callback=initMap"
    async defer></script>
  </body>
</html>
Helpful
- https://developers.google.com/maps/documentation/javascript/combining-data
- Get your own key!
Change base map
Identifies for common map types. Constants. Properties.
google.maps.MapTypeId.TERRAINWhere does it go?
it depends...
Inside the google.maps class
Title Text
Subtitle
<!DOCTYPE html>
<html>
  <head>
    <title>Simple Map</title>
    <meta name="viewport" content="initial-scale=1.0">
    <meta charset="utf-8">
    <style>
      /* Always set the map height explicitly to define the size of the div
       * element that contains the map. */
      #map {
        height: 100%;
      }
      /* Optional: Makes the sample page fill the window. */
      html, body {
        height: 100%;
        margin: 0;
        padding: 0;
      }
    </style>
  </head>
  <body>
    <div id="map"></div>
    <script>
      var map;
      function initMap() {
      var map = new google.maps.Map(document.getElementById('map'), {
            zoom: 10,
          center: Tacoma,
          mapTypeId: 'terrain'
        });

      }
    </script>
    <script src="https://maps.googleapis.com/maps/api/js?key=AIzaSyBn3zquptShb1gU_Esyo4EAwJa7DDvDeto&callback=initMap"
    async defer></script>
  </body>
</html>
Title Text
Subtitle
<!DOCTYPE html>
<html>
  <head>
    <title>Simple Map</title>
    <meta name="viewport" content="initial-scale=1.0">
    <meta charset="utf-8">
    <style>
      /* Always set the map height explicitly to define the size of the div
       * element that contains the map. */
      #map {
        height: 100%;
      }
      /* Optional: Makes the sample page fill the window. */
      html, body {
        height: 100%;
        margin: 0;
        padding: 0;
      }
    </style>
  </head>
  <body>
    <div id="map"></div>
    <script>
      var map;
      function initMap() {
      var map = new google.maps.Map(document.getElementById('map'), {
            zoom: 10,
          center: Tacoma,
          mapTypeId: 'terrain'
        });

      }
    </script>
    <script src="https://maps.googleapis.com/maps/api/js?key=AIzaSyBn3zquptShb1gU_Esyo4EAwJa7DDvDeto&callback=initMap"
    async defer></script>
  </body>
</html>
Play on your own
Test it out!
MapBox: Load a map
<!DOCTYPE html>
<html>
<head>
    <meta charset='utf-8' />
    <title></title>
    <meta name='viewport' content='initial-scale=1,maximum-scale=1,user-scalable=no' />
    <script src='https://api.tiles.mapbox.com/mapbox-gl-js/v0.41.0/mapbox-gl.js'></script>
    <link href='https://api.tiles.mapbox.com/mapbox-gl-js/v0.41.0/mapbox-gl.css' rel='stylesheet' />
    <style>
        body { margin:0; padding:0; }
        #map { position:absolute; top:0; bottom:0; width:100%; }
    </style>
</head>
<body>

<div id='map'></div>
<script>
mapboxgl.accessToken = 'pk.eyJ1IjoiYnJpY2tlciIsImEiOiJULVRnSlZZIn0.LHt8a4ByC-_b4ytgeh7H5Q';
var map = new mapboxgl.Map({
    container: 'map', // container id
    style: 'mapbox://styles/mapbox/satellite-streets-v9', // basemap style and stylesheet location
    center: [-122.46, 47.2587], // starting position for the map [lng, lat] - Hi Tacoma!
    zoom: 9 // starting zoom
});
</script>

</body>
</html>
Again - what are some differences you notice?
Text
Here is one way to get a
Leaflet map to Load
<!DOCTYPE html>
<html>
<head>
    <meta charset='utf-8' />
    <title></title>
    <meta name='viewport' content='initial-scale=1,maximum-scale=1,user-scalable=no' />
    <script src='https://api.tiles.mapbox.com/mapbox-gl-js/v0.41.0/mapbox-gl.js'></script>
    <link href='https://api.tiles.mapbox.com/mapbox-gl-js/v0.41.0/mapbox-gl.css' rel='stylesheet' />
    <style>
        body { margin:0; padding:0; }
        #map { position:absolute; top:0; bottom:0; width:100%; }
    </style>
</head>
<body>

<div id='map'></div>
<script>
mapboxgl.accessToken = 'pk.eyJ1IjoiYnJpY2tlciIsImEiOiJULVRnSlZZIn0.LHt8a4ByC-_b4ytgeh7H5Q';
var map = new mapboxgl.Map({
    container: 'map', // container id
    style: 'mapbox://styles/mapbox/satellite-streets-v9', // basemap style and stylesheet location
    center: [-122.46, 47.2587], // starting position for the map [lng, lat] - Hi Tacoma!
    zoom: 9 // starting zoom
});
</script>

</body>
</html>
Leaflet lab
- renders in the browser
- small files
- quickly
Leaflet is pretty much owned by MapBox
- need an API key
Add Data
overlay
Add you JS file to the server
and add a link to it
Title Text
<!DOCTYPE html>
<html>
<head>
	<title>vornoi</title>
	<meta charset="utf-8" />
	<meta name="viewport" content="width=device-width, initial-scale=1.0">
	<link rel="stylesheet" href="http://cdn.leafletjs.com/leaflet-0.7.3/leaflet.css" />
	<script src="http://cdn.leafletjs.com/leaflet-0.7.3/leaflet.js"></script>

	<style>
		#map {
			width: 800px;
			height: 500px;
		}


	</style>
</head>

<body>

	<div id="map"></div>


	<script>

		var map = L.map('map').setView([ 47.2414, -122.4594], 12);

		L.tileLayer('http://{s}.tile.stamen.com/terrain/{z}/{x}/{y}.png', {
	attribution: 'Map tiles by <a href="http://stamen.com">Stamen Design</a>, <a href="http://creativecommons.org/licenses/by/3.0">CC BY 3.0</a> — Map data © <a href="http://www.openstreetmap.org/copyright">OpenStreetMap</a>',
	subdomains: 'abcd',

		}).addTo(map);


	</script>
</body>
</html>
for lab 2... let's start with this
<!DOCTYPE html>
<html>
<head>
	<title>vornoi</title>
	<meta charset="utf-8" />
	<meta name="viewport" content="width=device-width, initial-scale=1.0">
	<link rel="stylesheet" href="http://cdn.leafletjs.com/leaflet-0.7.3/leaflet.css" />
	<script src="http://cdn.leafletjs.com/leaflet-0.7.3/leaflet.js"></script>

	<style>
		#map {
			width: 800px;
			height: 500px;
		}


	</style>
</head>

<body>

	<div id="map"></div>

<!--here is the reference the call to the geojson that I converted to js - if you look at this file- you will see I named the var
		TFDpoly can you find that later in this code? replace that with your variable name -->


<script type="text/javascript" src="http://faculty.washington.edu/bricker0/js/TFDvor.js"></script>

	<script>

		var map = L.map('map').setView([ 47.2414, -122.4594], 12);

		L.tileLayer('http://{s}.tile.stamen.com/terrain/{z}/{x}/{y}.png', {
	attribution: 'Map tiles by <a href="http://stamen.com">Stamen Design</a>, <a href="http://creativecommons.org/licenses/by/3.0">CC BY 3.0</a> — Map data © <a href="http://www.openstreetmap.org/copyright">OpenStreetMap</a>',
	subdomains: 'abcd',

		}).addTo(map);

		//add the geoJson file but no style

L.geoJson(TFDpoly).addTo(map);


	</script>
</body>
</html>
Then add the polygons - referencing your
Now add style! Lots of it. See my example and leaflet example.
find and add the style
<!DOCTYPE html>
<html>
<head>
	<title>vornoi</title>
	<meta charset="utf-8" />
	<meta name="viewport" content="width=device-width, initial-scale=1.0">
	<link rel="stylesheet" href="http://cdn.leafletjs.com/leaflet-0.7.3/leaflet.css" />
	<script src="http://cdn.leafletjs.com/leaflet-0.7.3/leaflet.js"></script>

	<style>
		#map {
			width: 800px;
			height: 500px;
		}

	.info {
			padding: 6px 8px;
			font: 14px/16px Arial, Helvetica, sans-serif;
			background: white;
			background: rgba(255,255,255,0.8);
			box-shadow: 0 0 15px rgba(0,0,0,0.2);
			border-radius: 5px;
		}
		.info h4 {
			margin: 0 0 5px;
			color: #777;
		}

		.legend {
			text-align: left;
			line-height: 18px;
			color: #555;
		}
		.legend i {
			width: 18px;
			height: 18px;
			float: left;
			margin-right: 8px;
			opacity: 0.7;
		}


	</style>
</head>

<body>

	<div id="map"></div>

<!--here is the reference the call to the geojson that I converted to js - if you look at this file- you will see I named the var
		TFDpoly can you find that later in this code? replace that with your variable name -->


<script type="text/javascript" src="http://faculty.washington.edu/bricker0/js/TFDvor.js"></script>

	<script>

		var map = L.map('map').setView([ 47.2414, -122.4594], 12);

		L.tileLayer('http://{s}.tile.stamen.com/terrain/{z}/{x}/{y}.png', {
	attribution: 'Map tiles by <a href="http://stamen.com">Stamen Design</a>, <a href="http://creativecommons.org/licenses/by/3.0">CC BY 3.0</a> — Map data © <a href="http://www.openstreetmap.org/copyright">OpenStreetMap</a>',
	subdomains: 'abcd',

		}).addTo(map);

		//add the geoJson file

L.geoJson(TFDpoly).addTo(map);

//// get color depending on count which represents number of calls in the  cell - first set color scheme
		function getColor(d) {
			return d > 3000 ? '#800026' :
			       d > 2000  ? '#BD0026' :
			       d > 1000  ? '#E31A1C' :
			       d > 500  ? '#FC4E2A' :
			       d > 20   ? '#FD8D3C' :
			       d > 2   ? '#FEB24C' :
			       d > 0   ? '#FED976' :
			                  '#FFEDA0';
		}

//styling the GeoJSON so that fill changes with the value associated with the cell and number of potholes
		function style(feature) {
    return {
        fillColor: getColor(feature.properties.YTD_Count),
        weight: 2,
        opacity: 1,
        color: 'white',
        dashArray: '3',
        fillOpacity: 0.7
    };
}

L.geoJson(TFDpoly, {style: style}).addTo(map);

			map.on('click', onMapClick);


	</script>
</body>
</html>
Find and clean your data using QGIS, then open my example
http://faculty.washington.edu/bricker0/map3.html
File too big?
- Convert Geojson to TopoJson to reduce size of file
- https://mygeodata.cloud/converter/geojson-to-topojson
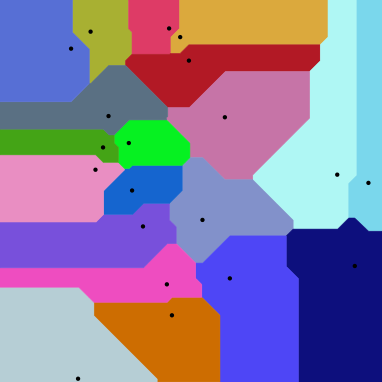
Voronoi
Thiessen polygons
Interpolation
Tessellation
domination
Voronoi polygons
generated a cell around a point. Assigning all locations in that space to the closest member of the point set.
"Area of influence polygons"


Many disciplines use this technique
- physics
- computational geometry

Many disciplines use this technique
- geology
- archaeology
- meteorology

Title Text


Network Voronoi Diagram


Put a map on it.
By Britta Ricker
Put a map on it.
- 961


