What does your app really do?…and other adventures in instrumentation

Caner Uguz
Product Designer at VividCortex
@caneruguz
We are hiring!
"I'm hearing great things about our product comparison pages."
"Nobody is doing previews anymore, it's all edit; that's what our app should be."
"Our product detail page is by far the most visited, we can't make any changes to that page."
"People just don't use our app on the phone, we get only 0.5% of hits from mobile devices."
"Data driven"
The Case for Instrumentation
Design decisions have expensive and ethical consequences.
You need systematic and cost effective data collection in your decision making process.
CONCEPT
DESIGN
DEVELOPMENT
MAINTENANCE
INFRASTRUCTURE
MANAGEMENT
MARKETING
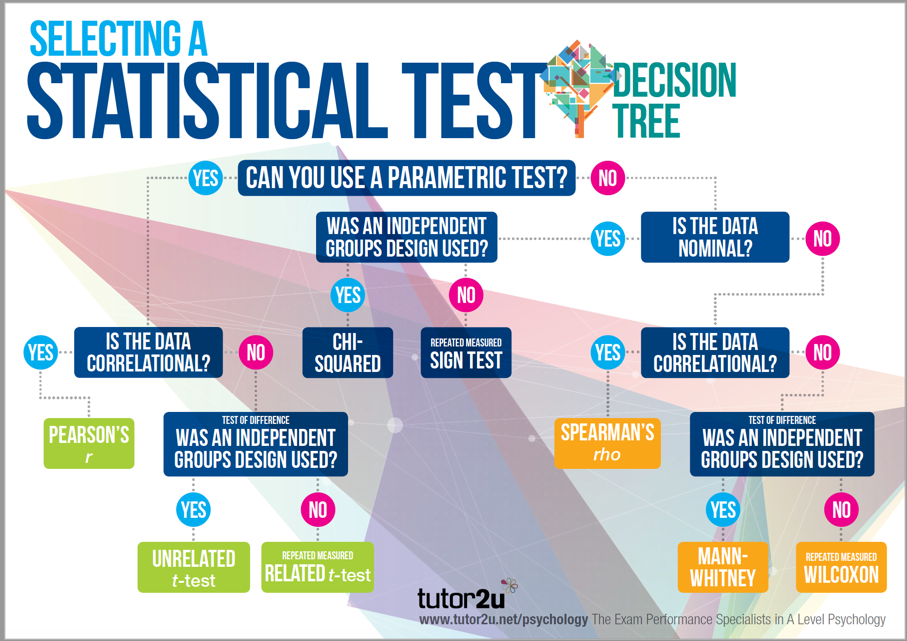
Instrumentation is research
Apply sound research practices
Use statistical methods to understand your data better
Instrumentation
the design, provision, or use of measuring instruments.
cost effective source of information about users
Instrumentation is not direct observation.
Not this


More like this
#Goals
Be more thoughtful about instrumentation
Improve the quality of your existing methodology
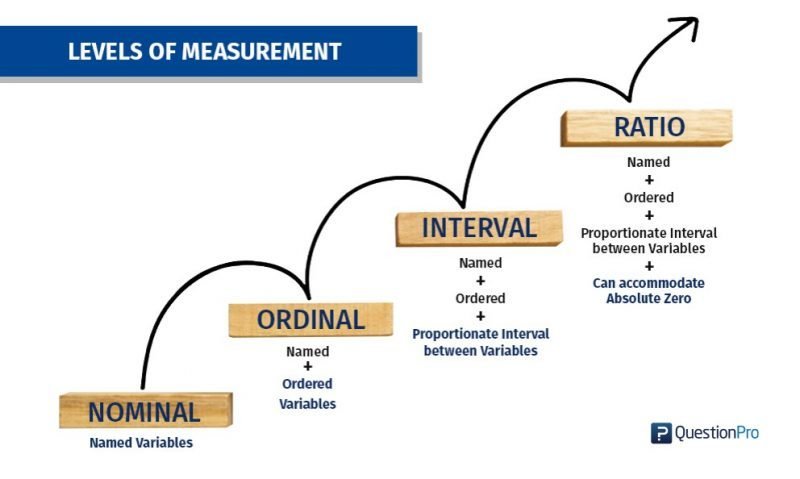
Asking
Are your questions
Specific
Measurable
Meaningful
Are my users...
like... happy?
able to find the page that let's them change their date of birth?
Specific
Did my users...
enjoy this article?
spend enough time on this article to read all of it?
Measurable
How many times did my users...
hover over their profile picture?
go the previous page using browser's back button?
Meaningful
Click filter input
Enter 'xyz' word
Hit clear
Click search box
Enter same word
Actions vs constructs
User is feeling generous
User clicks the button to increase donation dollar amount from $2 to $3

Lost?
| Action | Value | Average |
|---|---|---|
| Total number of hitting back and forward in browser | 7 | 1 |
| average time spent on pages | 10(sec) | 150 |
| total number of pages | 12 | 3 |
| total click events on pages | 24 | 12 |
| total times hitting 'cancel' or 'esc' | 6 | 1 |
Where are you getting this from?
- Review feedback
- Look back at past users with desired outcome
- From literature
- Past studies, linear regression
Read up on: Scale construction
https://pdfs.semanticscholar.org/5bb5/57fdfffd8e186b7fd72ca81b6f1a43fb162b.pdf
https://pdfs.semanticscholar.org/245e/18045e05363a12e163acf388e245e202ec40.pdf
Reliability
Consistency of a measure
Mostly not an issue on the web if your interaction is programmed for it.
i.e. Lists that appear in an order defined by algorithm
Validity
Are you measuring what you intend to
Very commonly an issue
i.e
- Calendar view is a top visited page and therefore very important for users... or is it?
- There are over 4000 events collected in time picker over 5 hours!
- Most common list size is 20 because 80% of people choose 20
The data
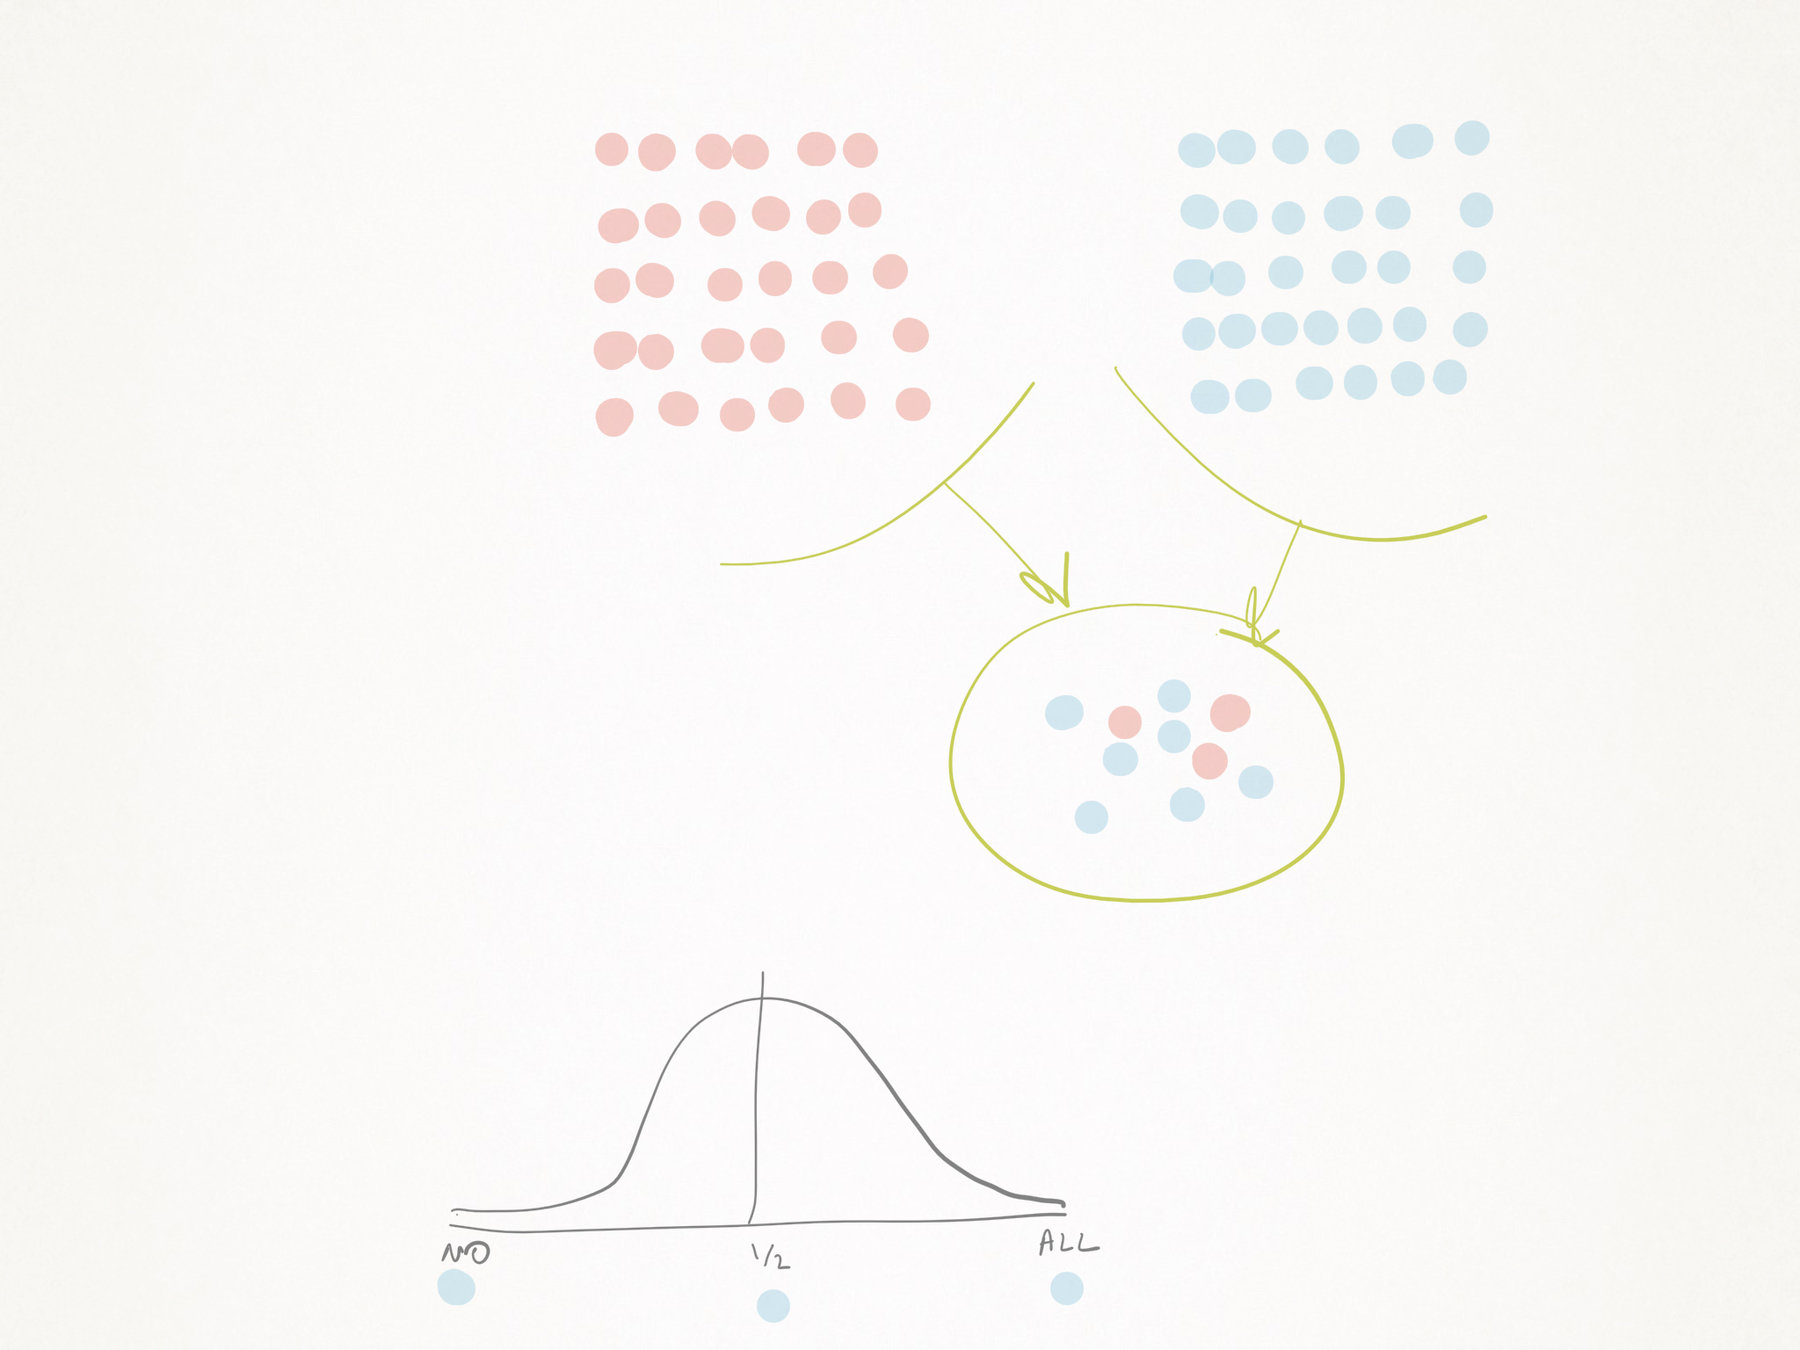
Is your sample representative?
Photo by Kelly Neil on Unsplash

Is your sample size big enough?
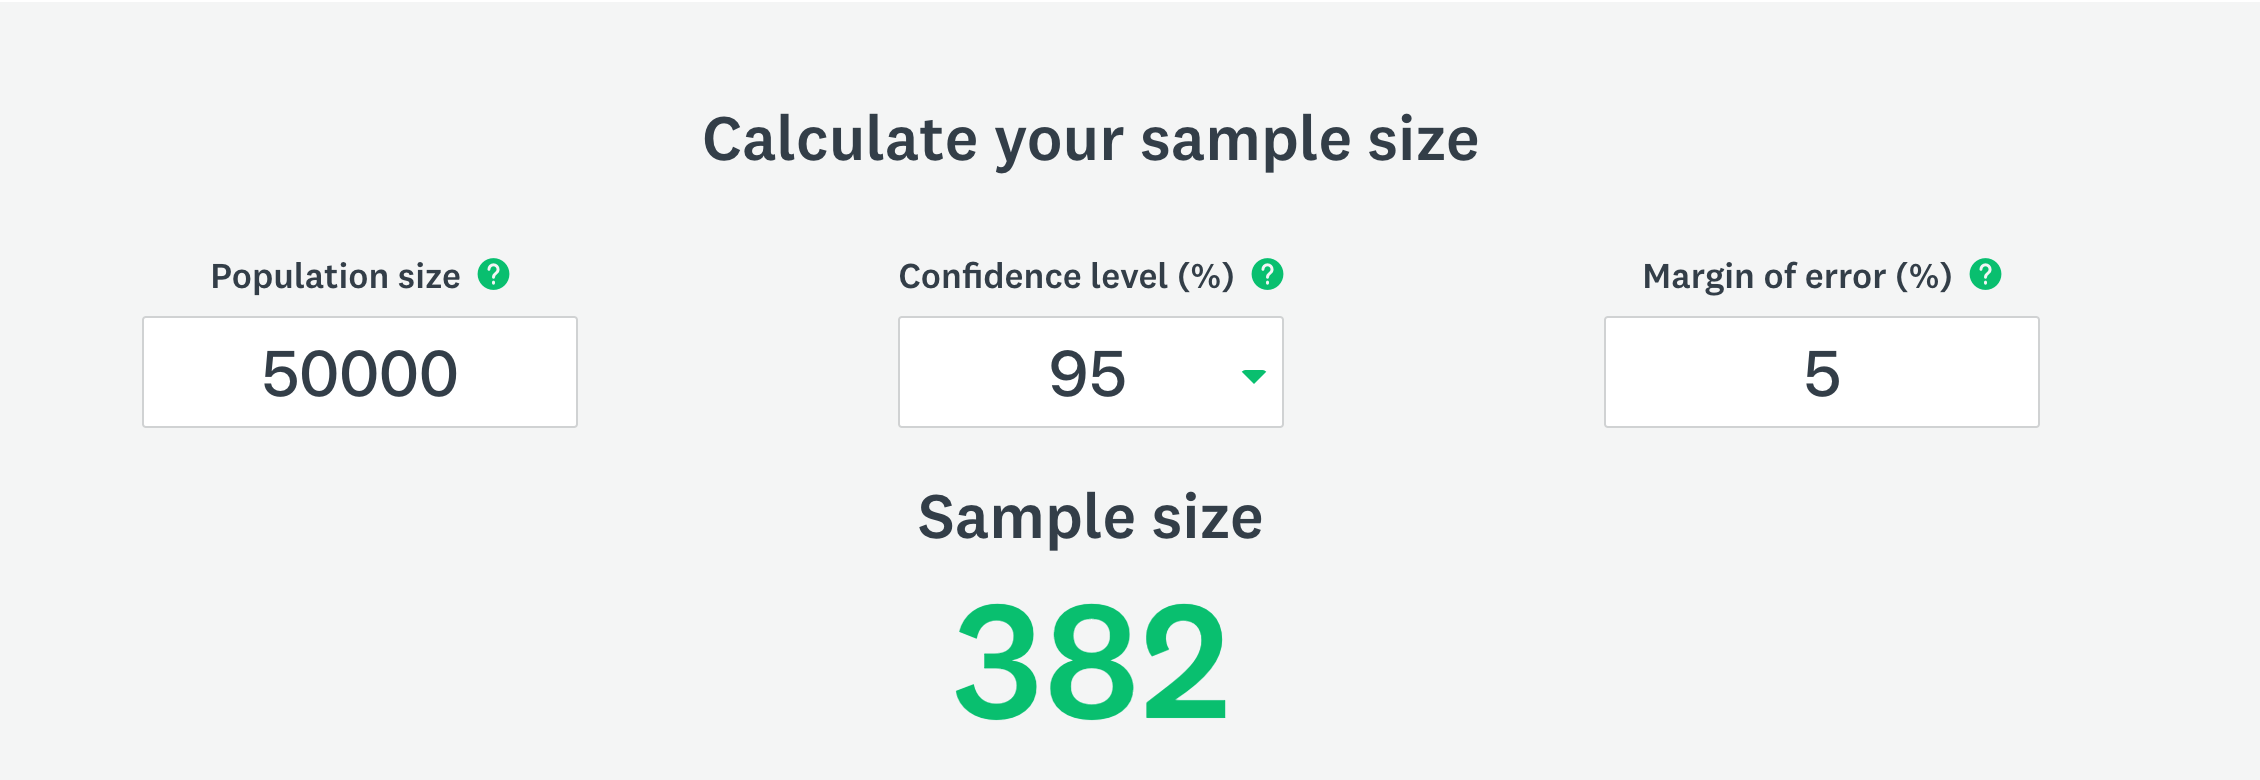
https://www.surveymonkey.com/mp/sample-size-calculator/
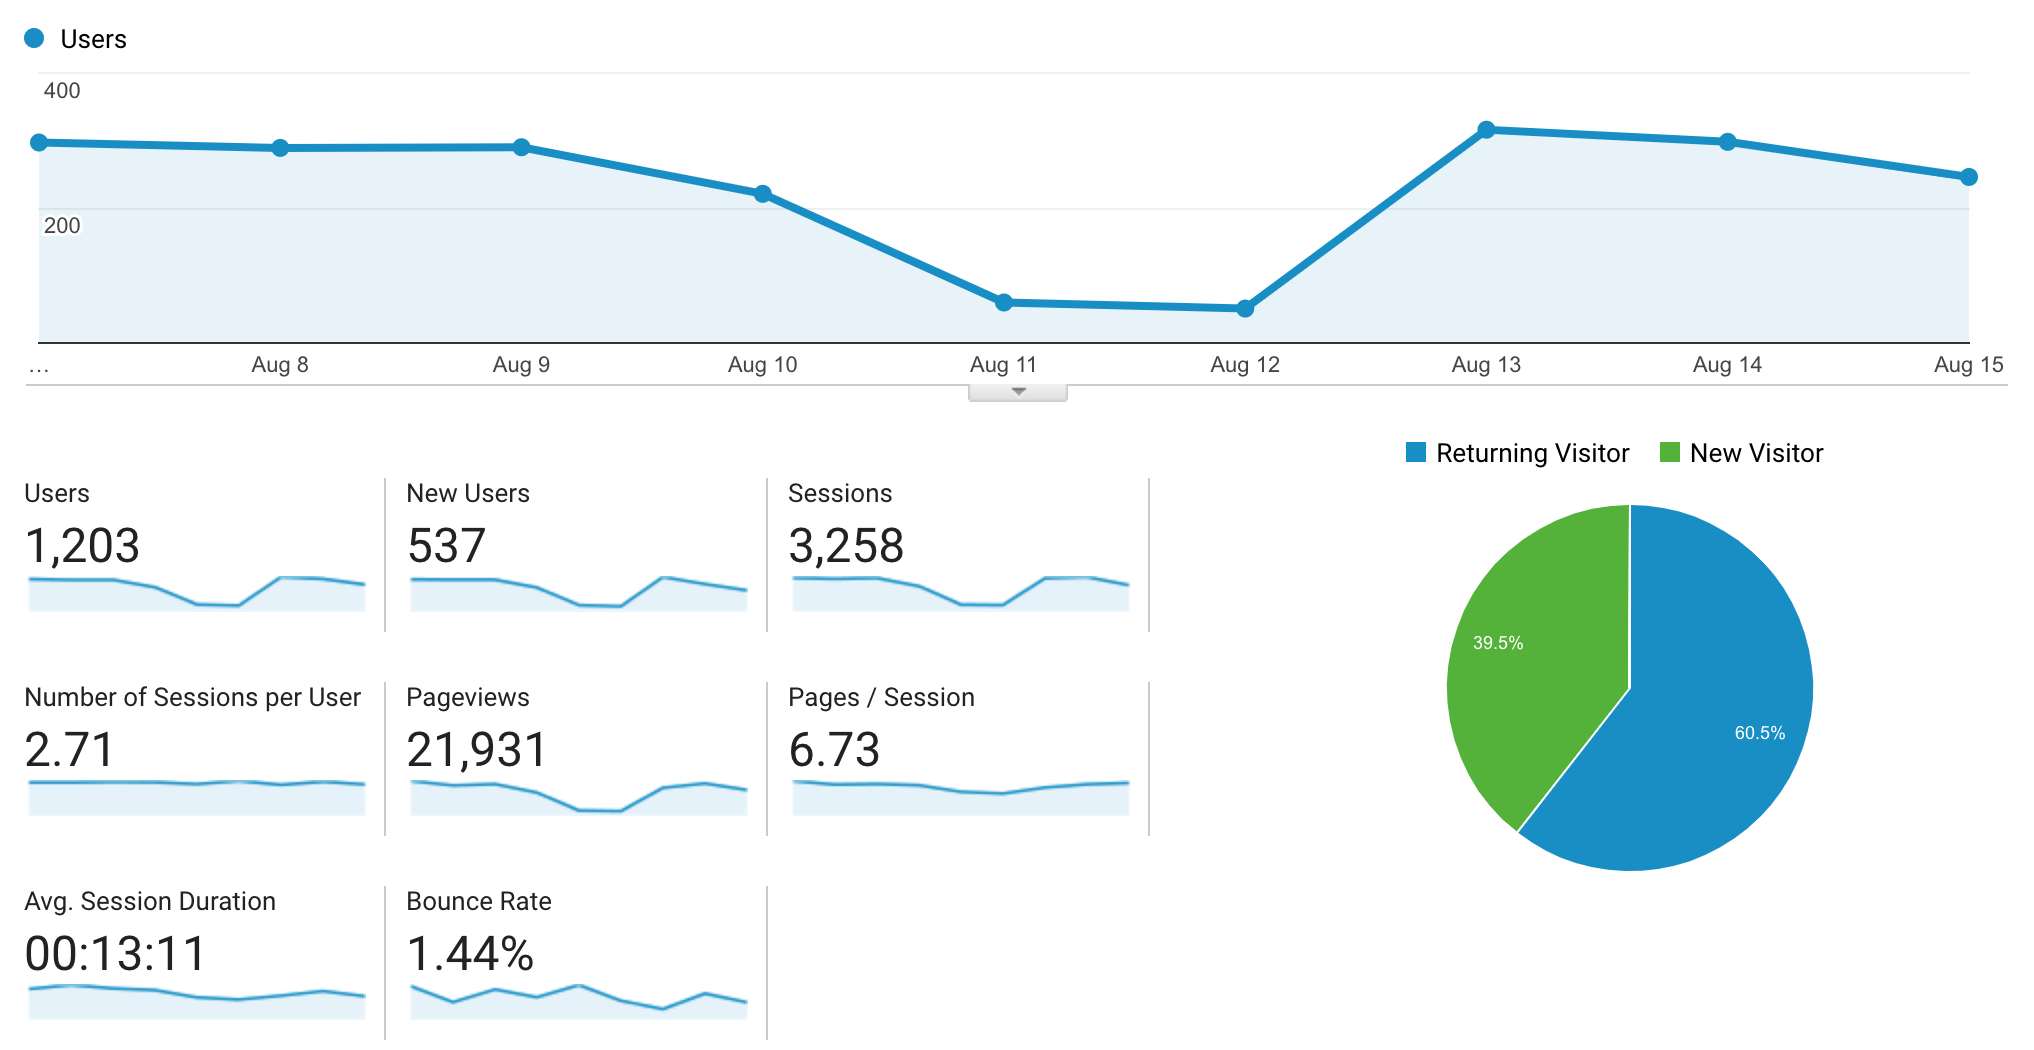
Make a habit of looking at your data
Summary table
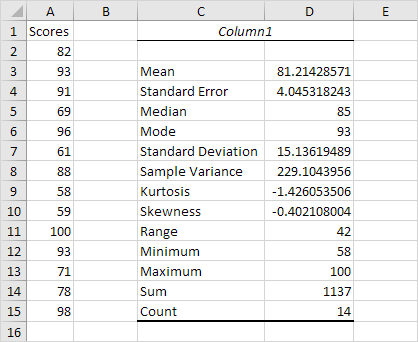
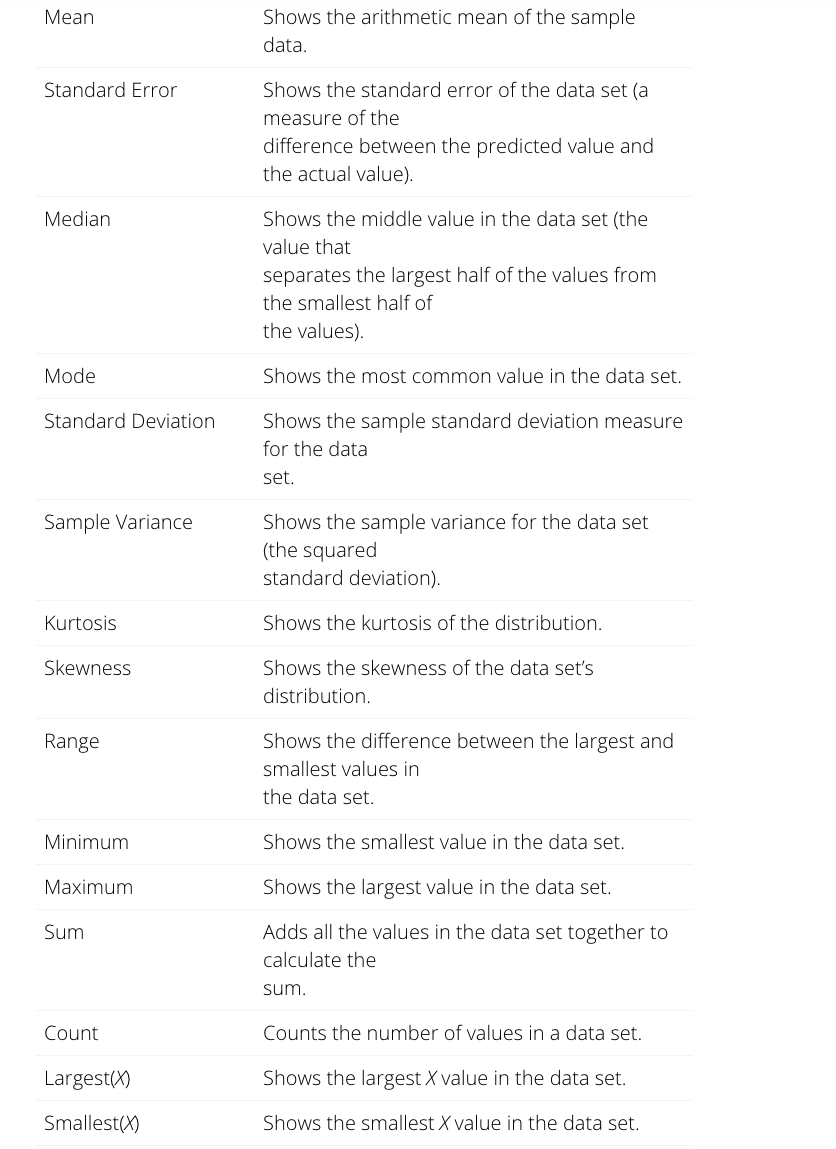
https://www.dummies.com/software/microsoft-office/excel/how-to-use-excels-descriptive-statistics-tool/
https://www.khanacademy.org/math/statistics-probability/summarizing-quantitative-data/box-whisker-plots/a/box-plot-review
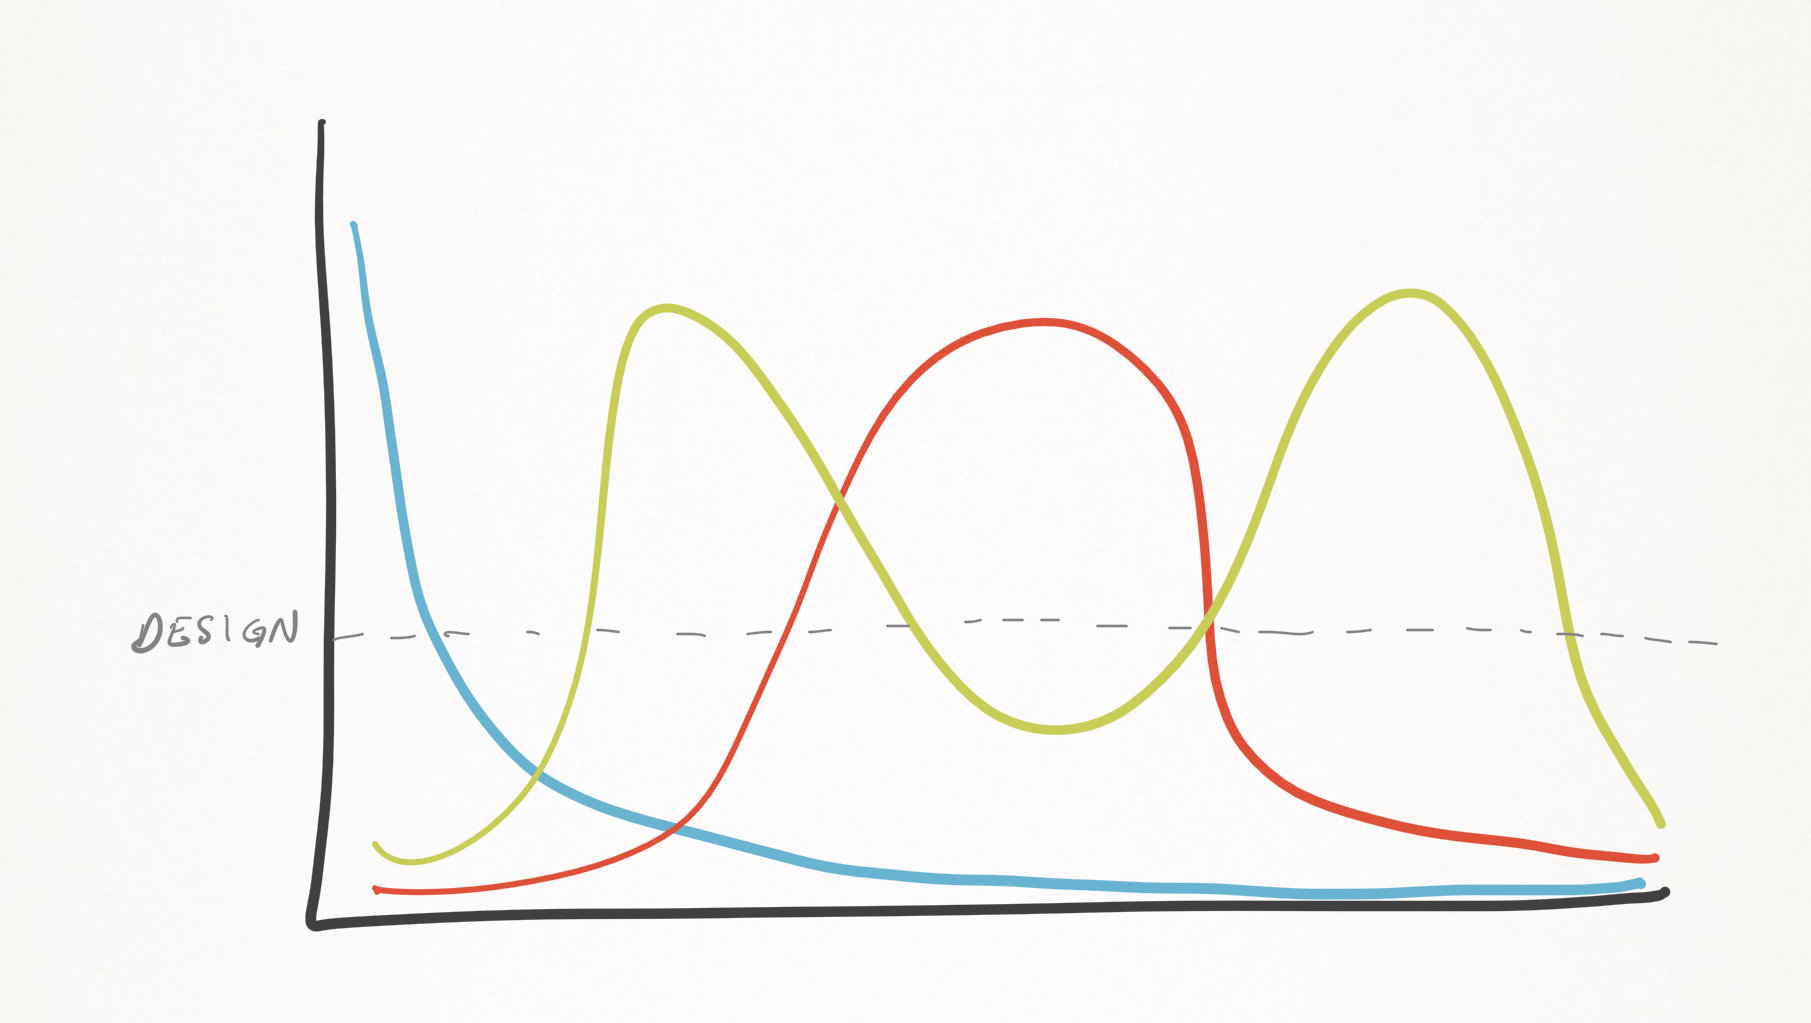
Box whisker plot
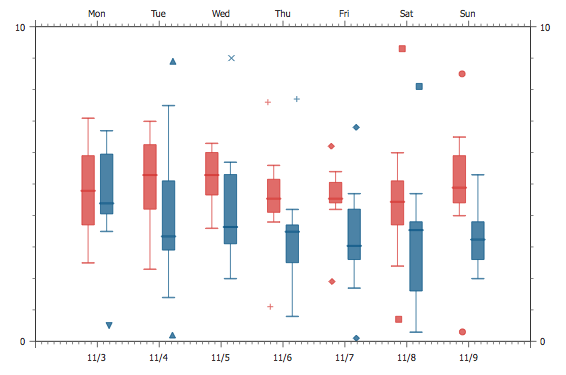
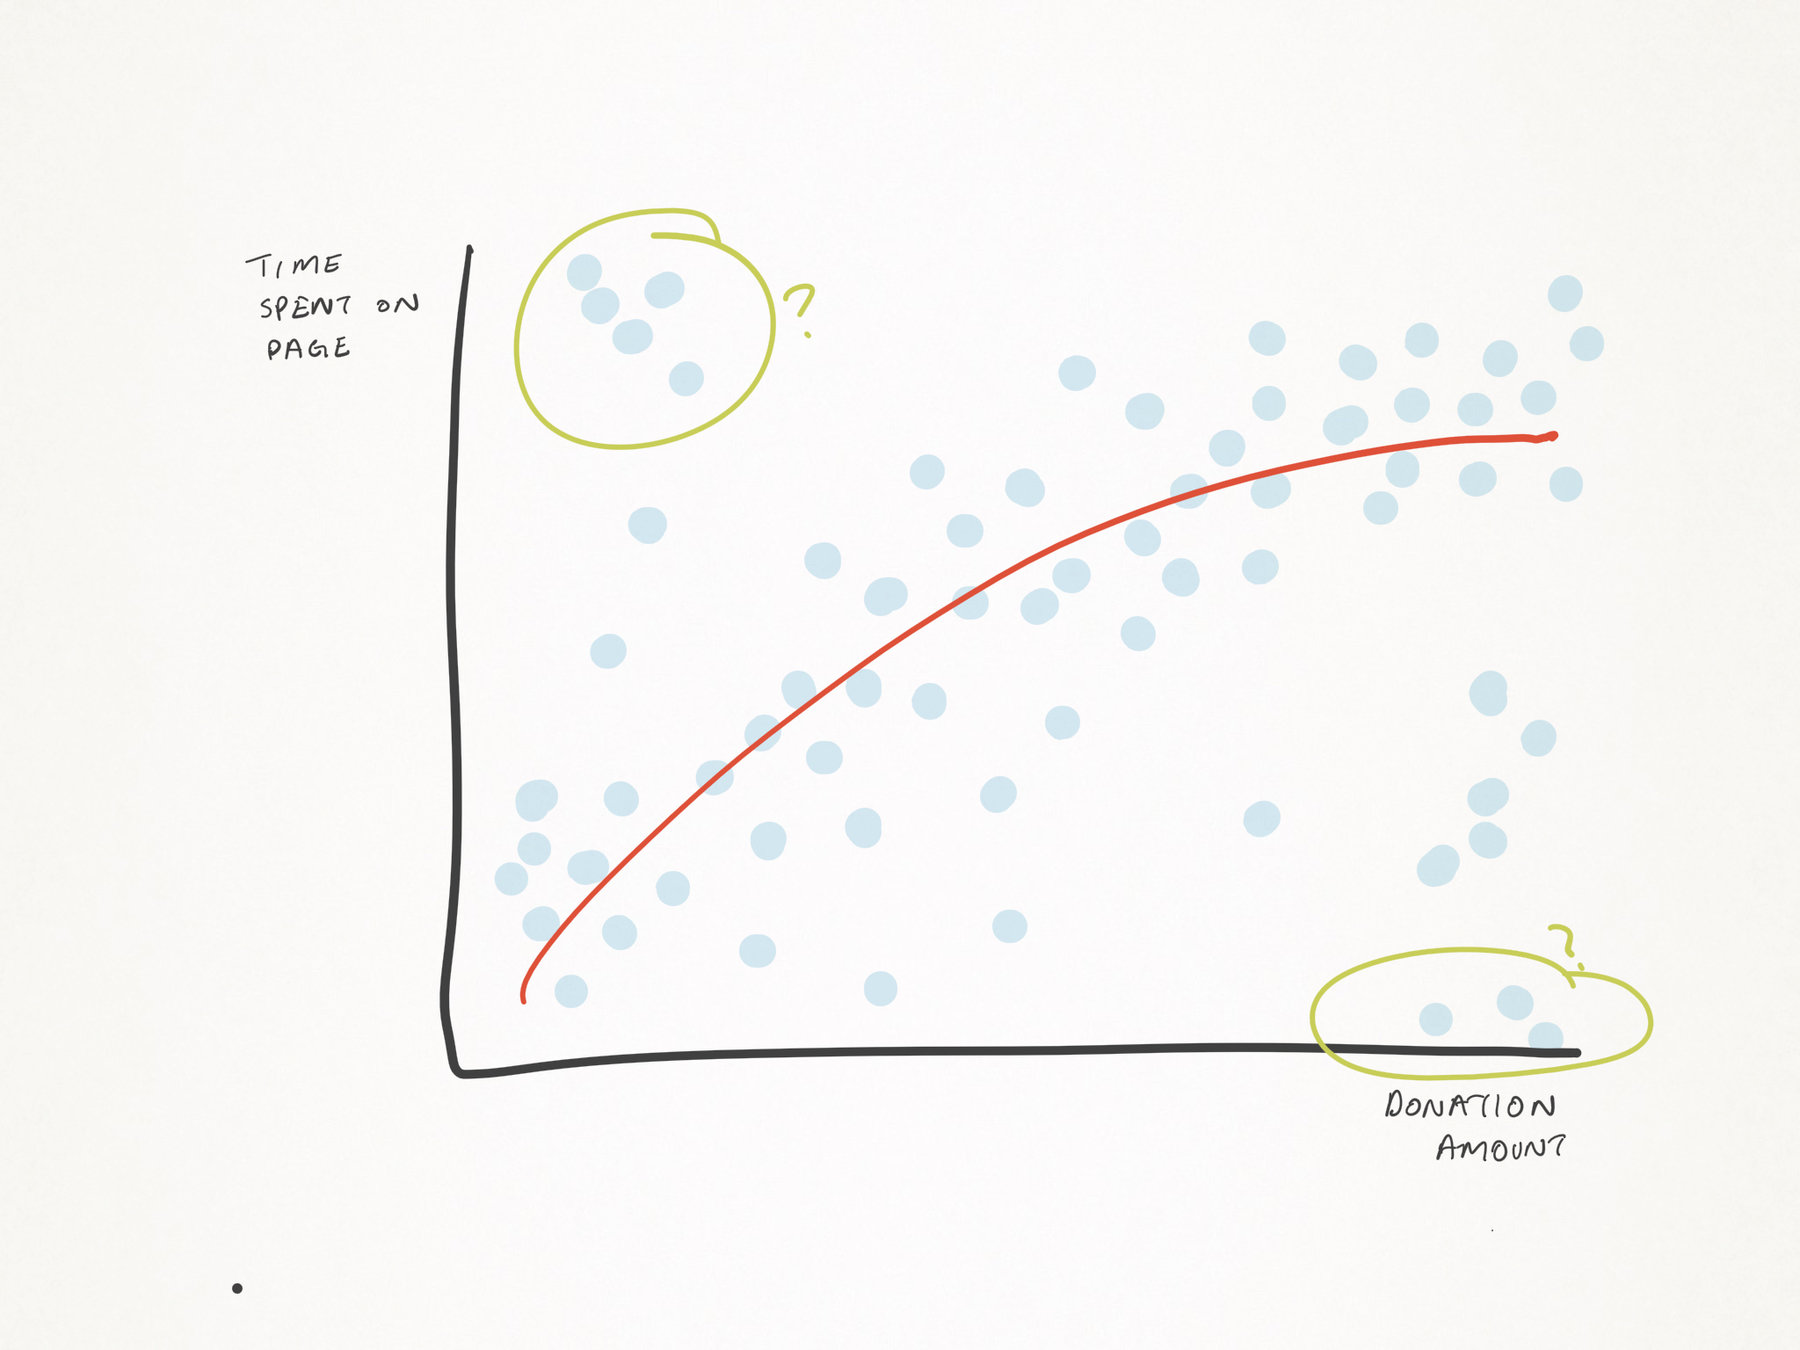
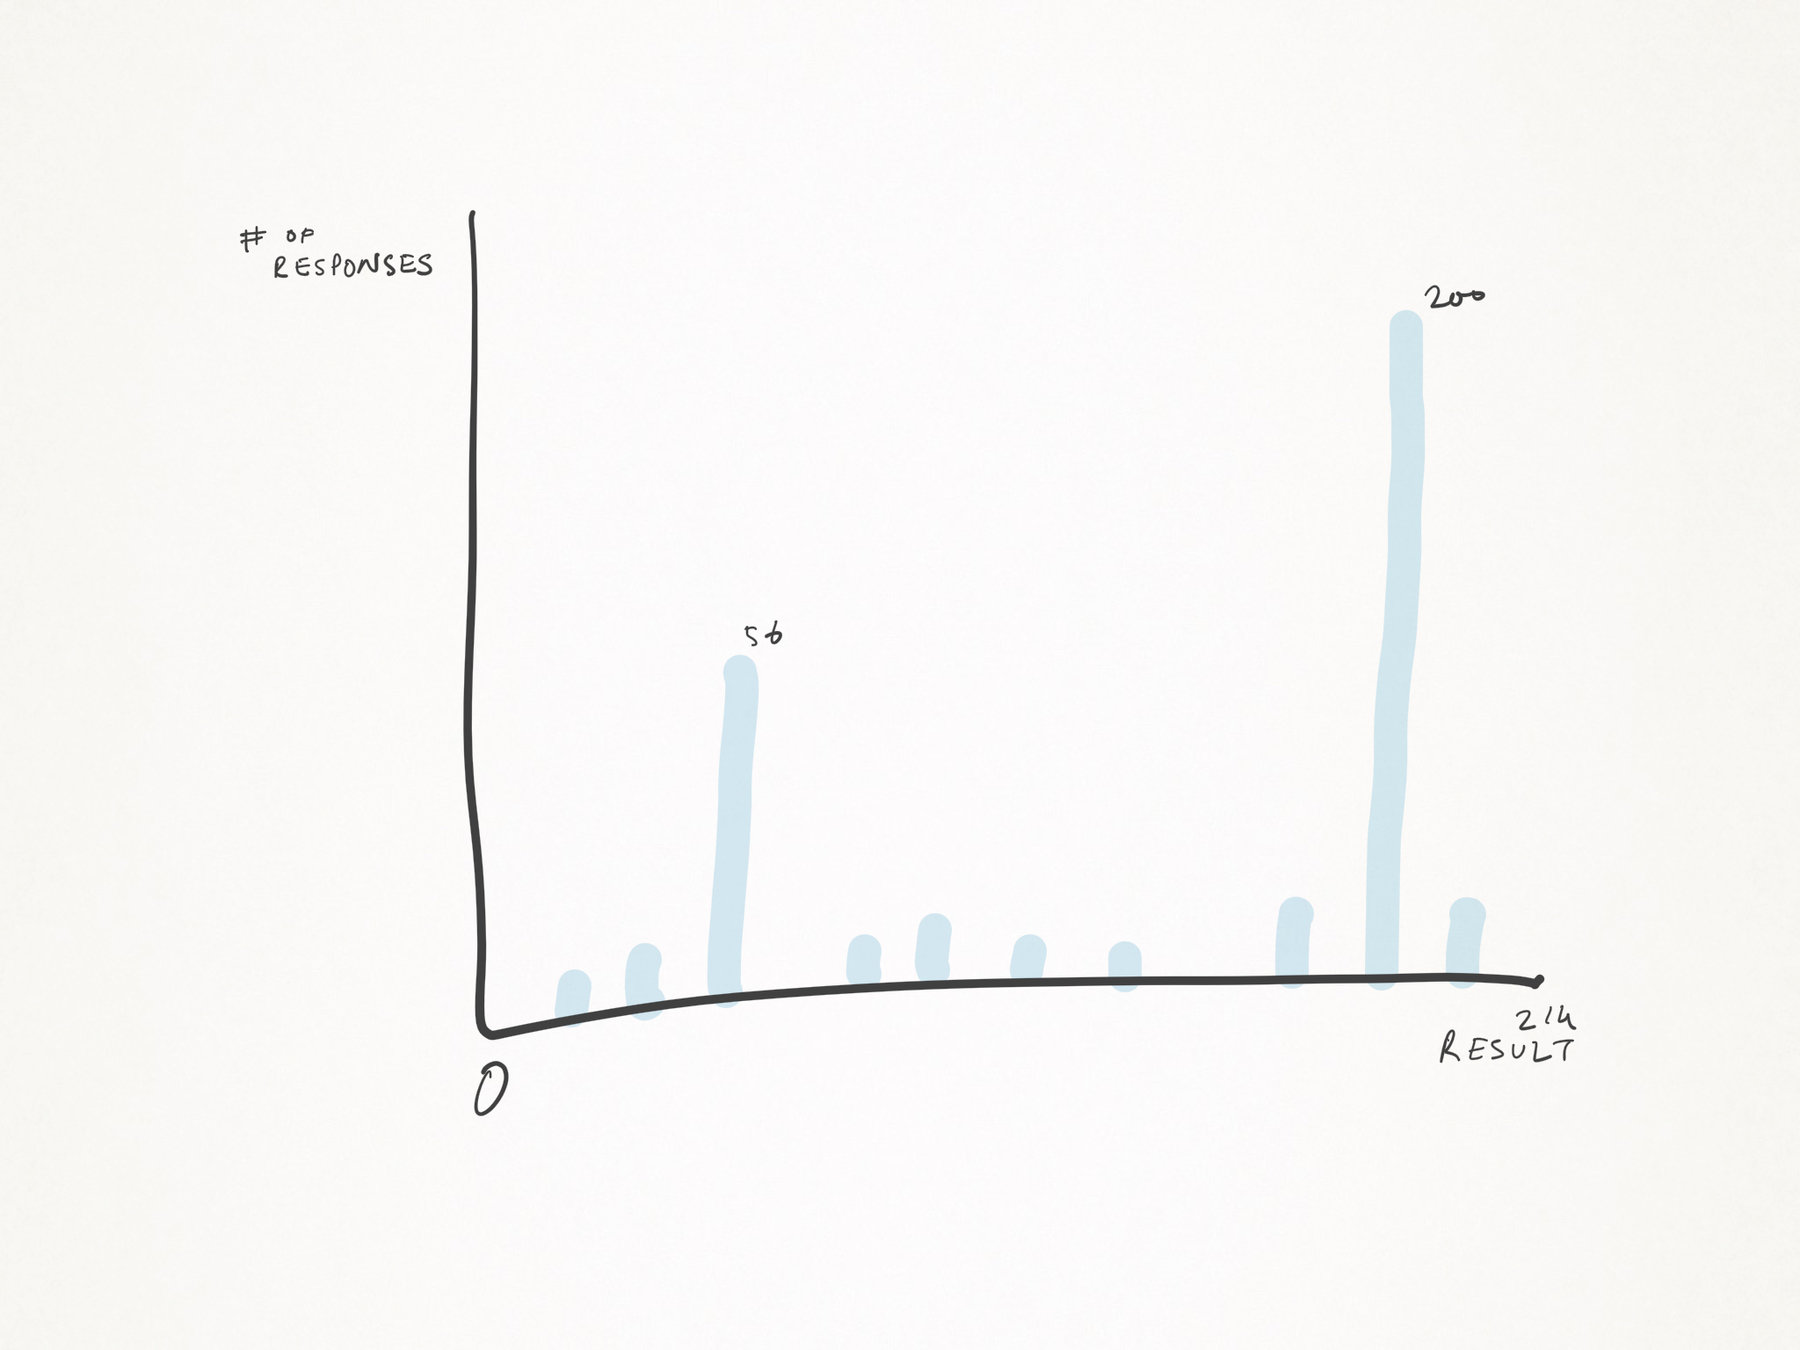
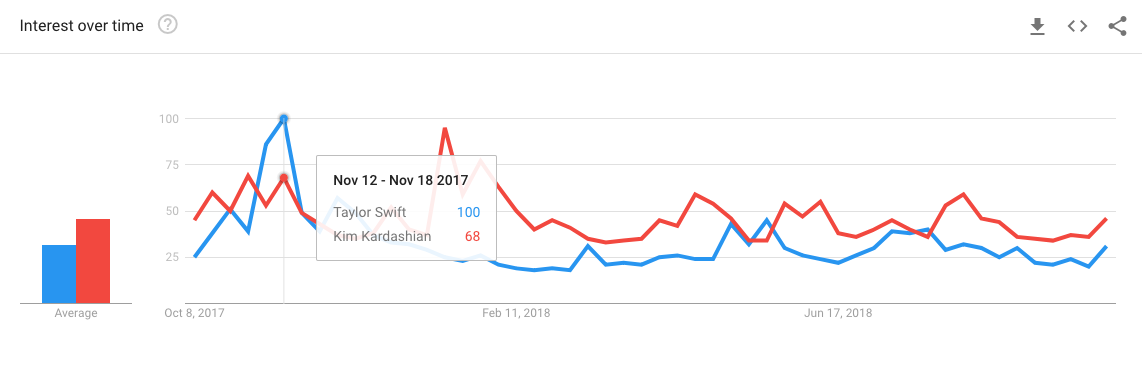
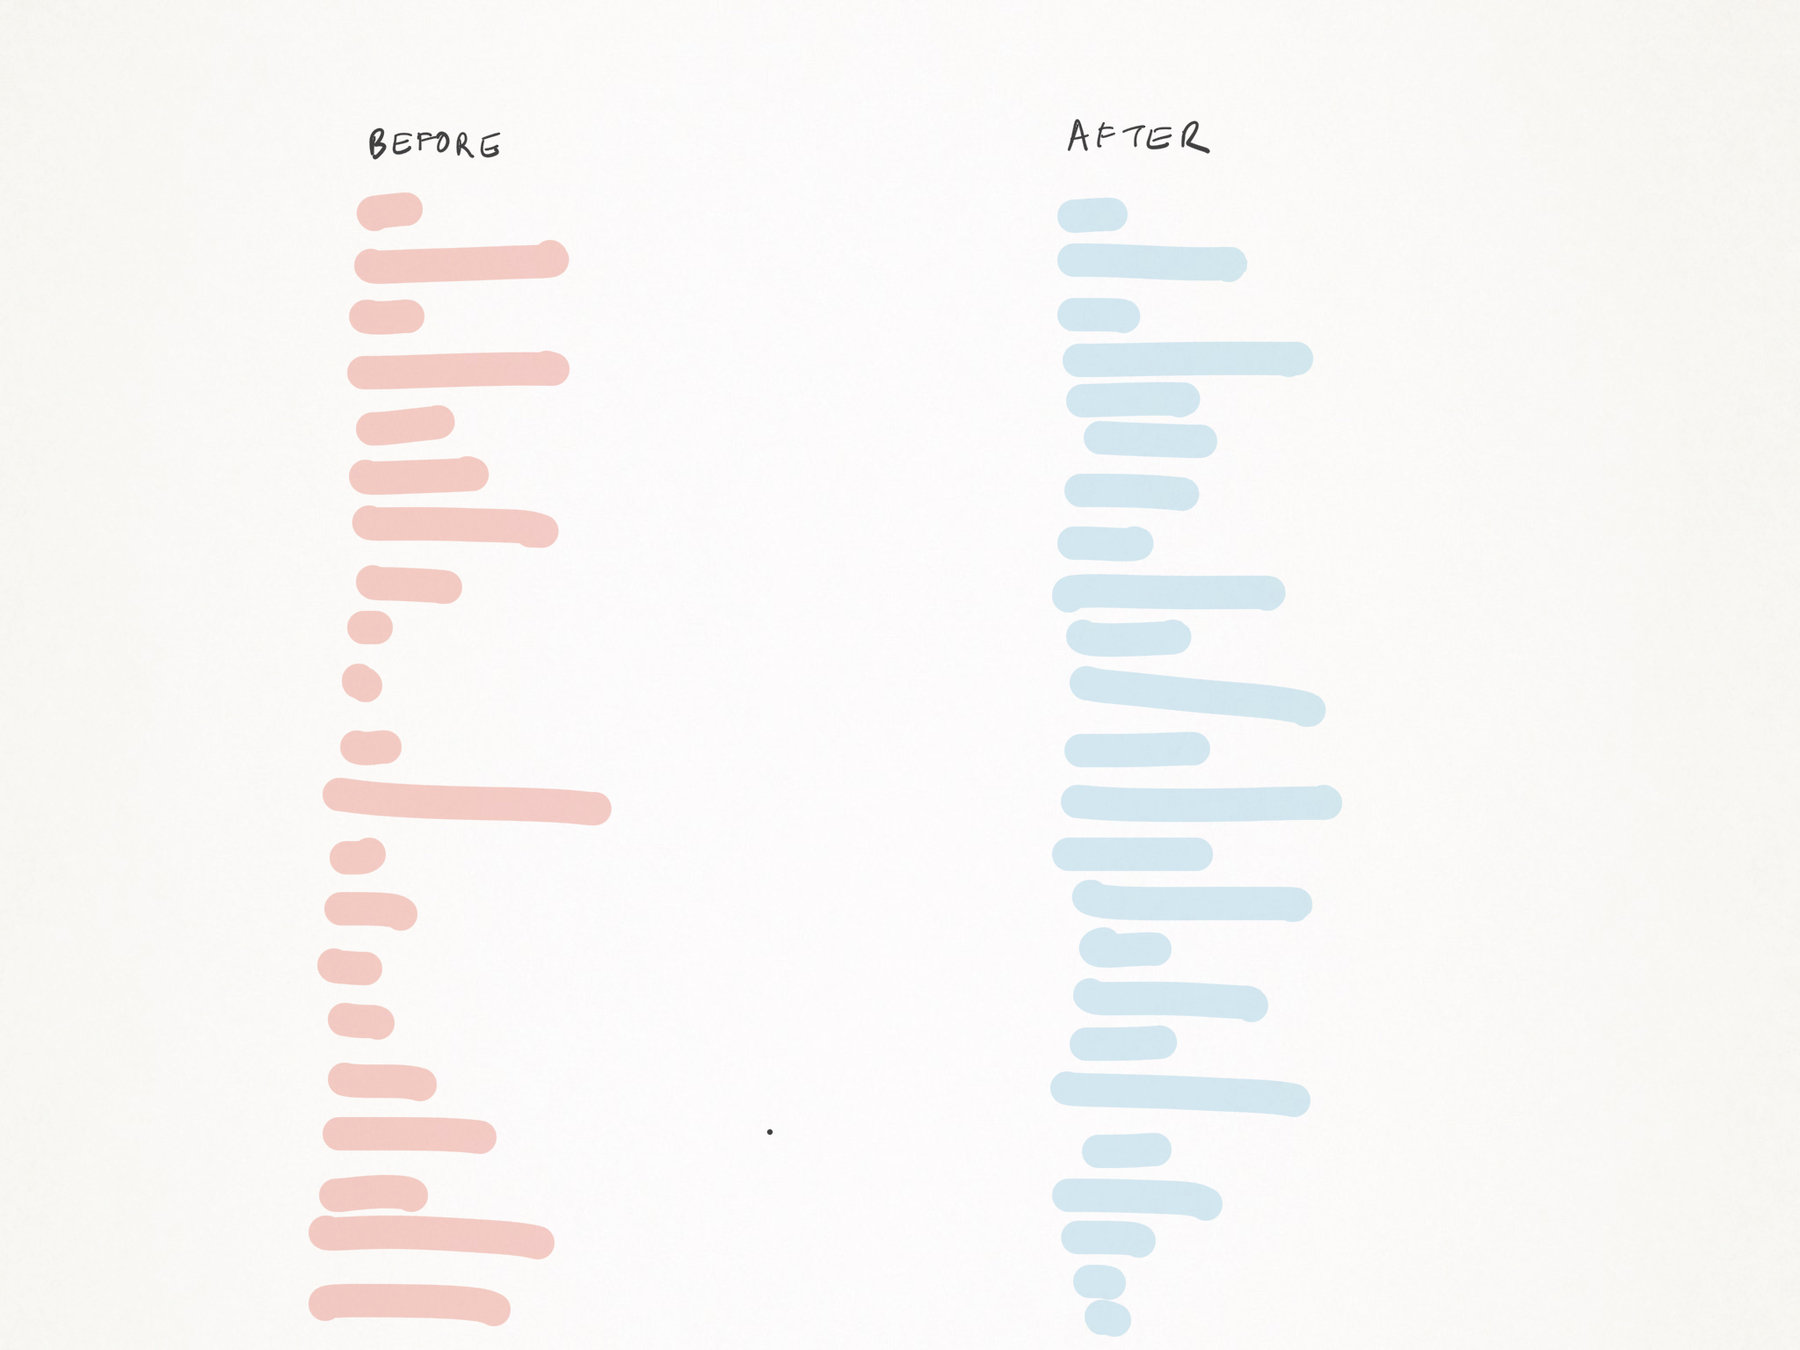
You can't simply compare numbers
Statistical Significance
What is the likelihood that the result is by chance?
"After we pushed this change our 200 more people signed up per week"
Does not mean the difference is 'important'.
If your sample size is smaller, the likelihood of chance is higher.
What is your research plan?
What is your data like?
Are you asking the right questions?
What matters to your team?
How do you define success?
What is your desired outcome?

Photo by Eunice Lituañas on Unsplash
Can you instrument qualitative data?
Yes but...
Depends on your content
Requires different methodologies
Potentially sensitive data
Works best with categorical inputs
Photo by PNG Design on Unsplash
Ask your own database
Run scripts that give you aggregated content about what your users generate

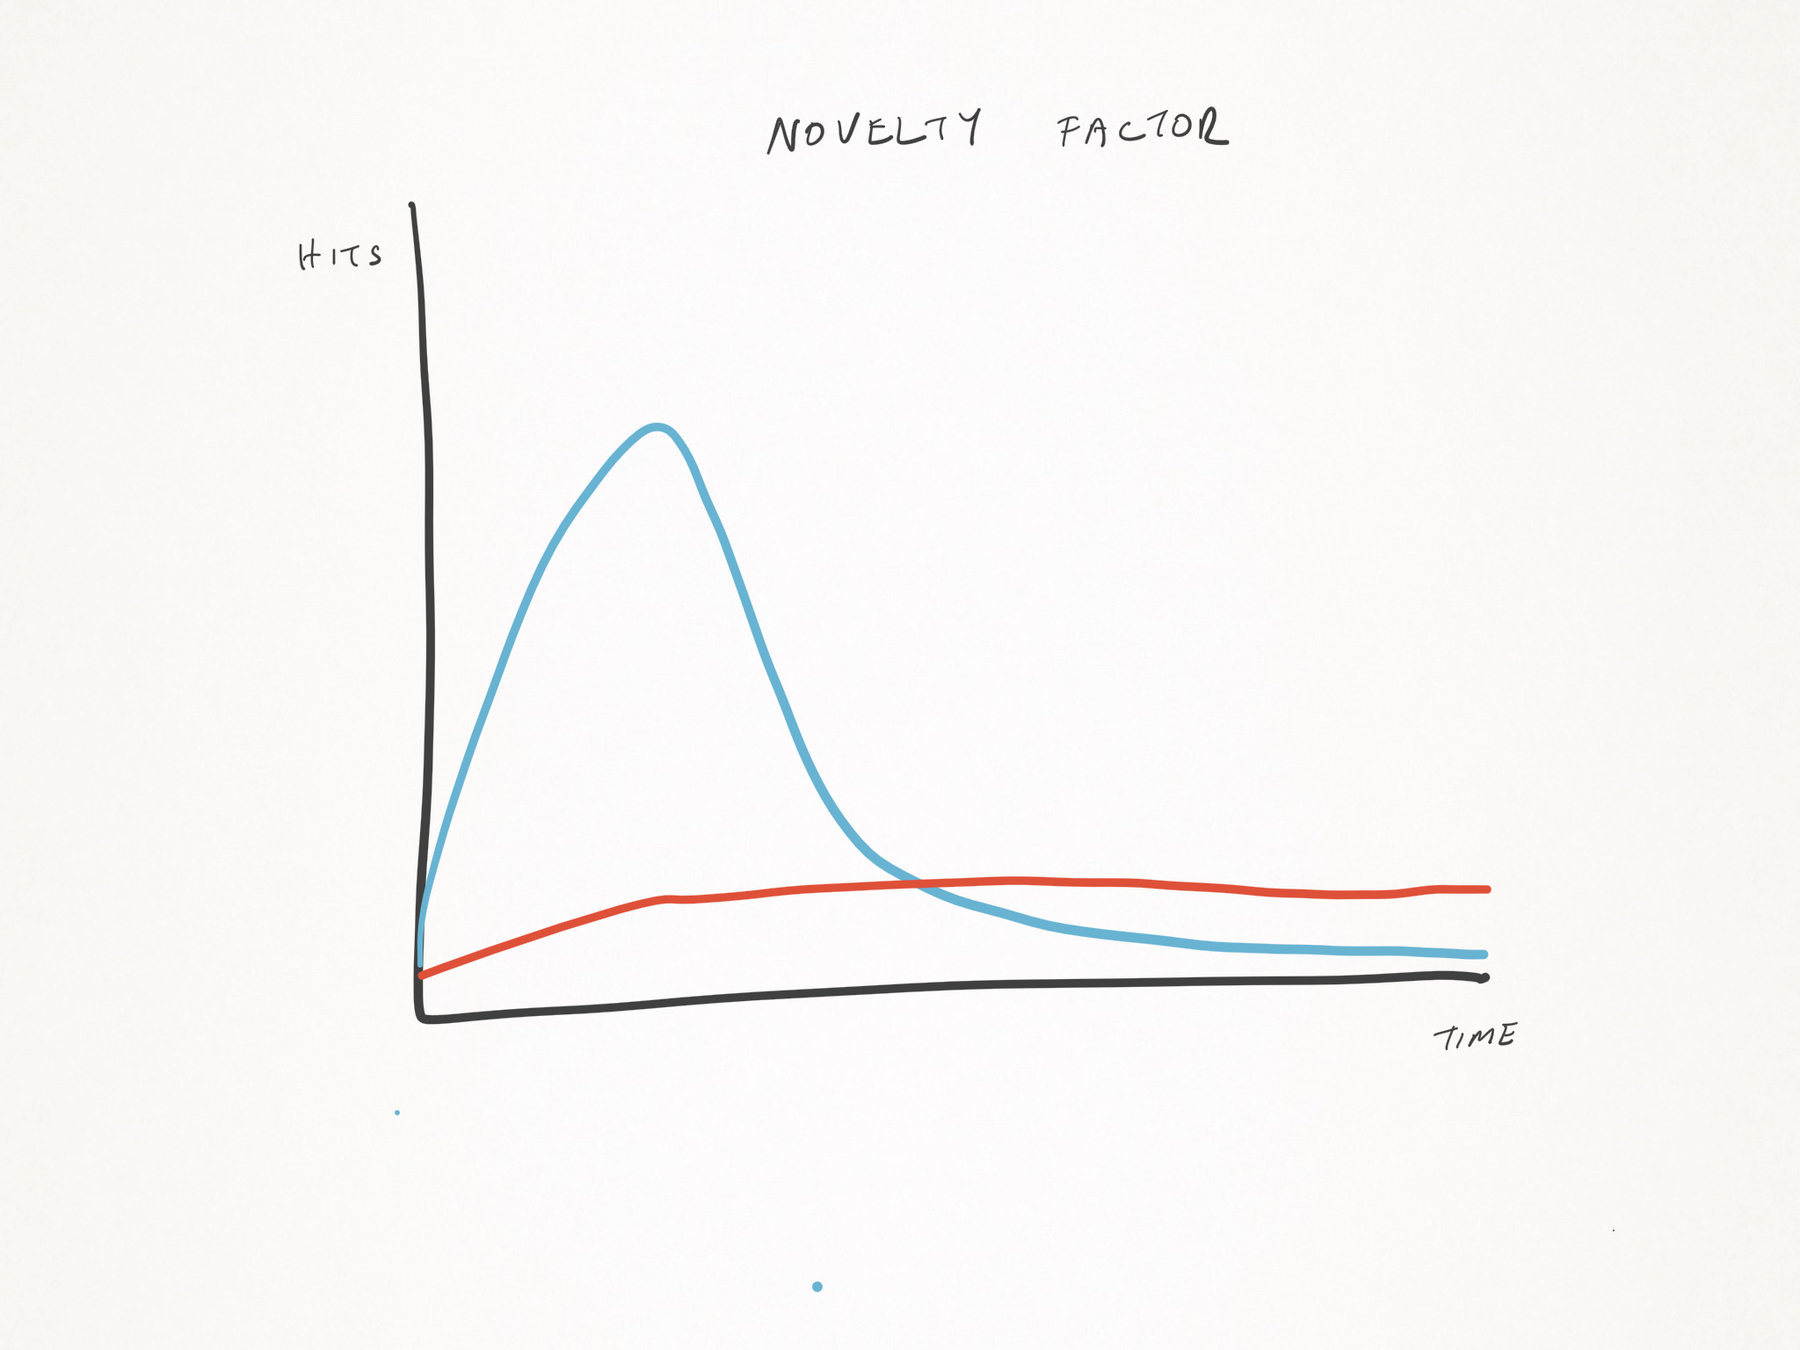
Use case: are your charts empty?
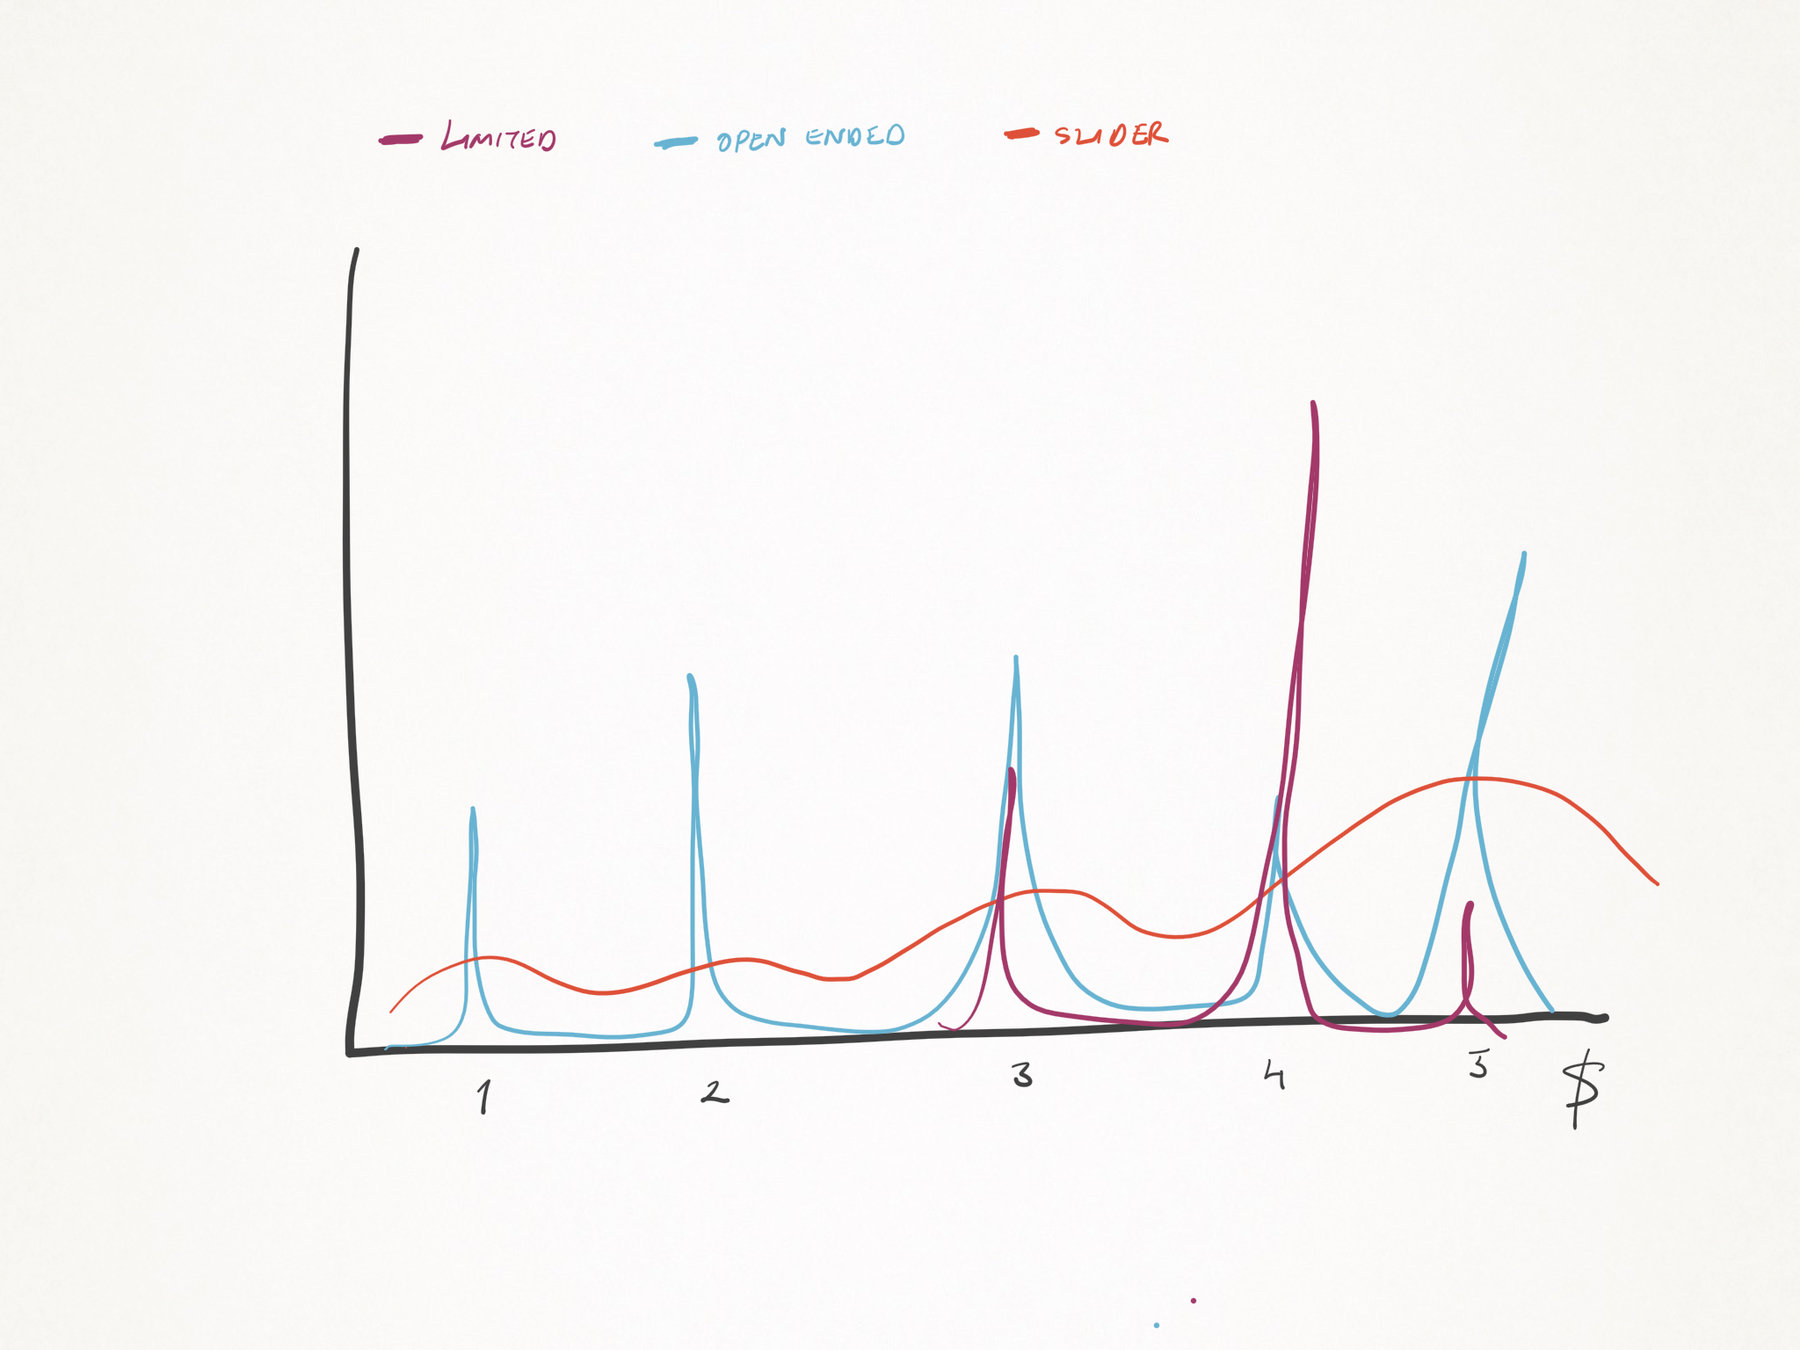
Values
Very accurate false data
"Our page hits doubled!
... after you introduced forced pagination
Badly defined constructs
"Our users are very engaged with our content"
... because you made it difficult to navigate
Reinforcing biases
"90% of our users read stories about political party A"
... because you decide which articles to show users
Reinforcing biases
"We made our prefix menu shorter"
... by removing Dr. from the list for women "because it literally is never used"
Evil patterns
"We increased viewership in more of our movies"
... because you made it harder to find favourites.
Illegal activities and grey zones
"User A seems to be buying a lot of bags, let's show them 10% higher prices than others"
"User B has a great fashion sense, I will keep track of what they are buying"
Don't be Facebook
Is instrumentation surveillance?
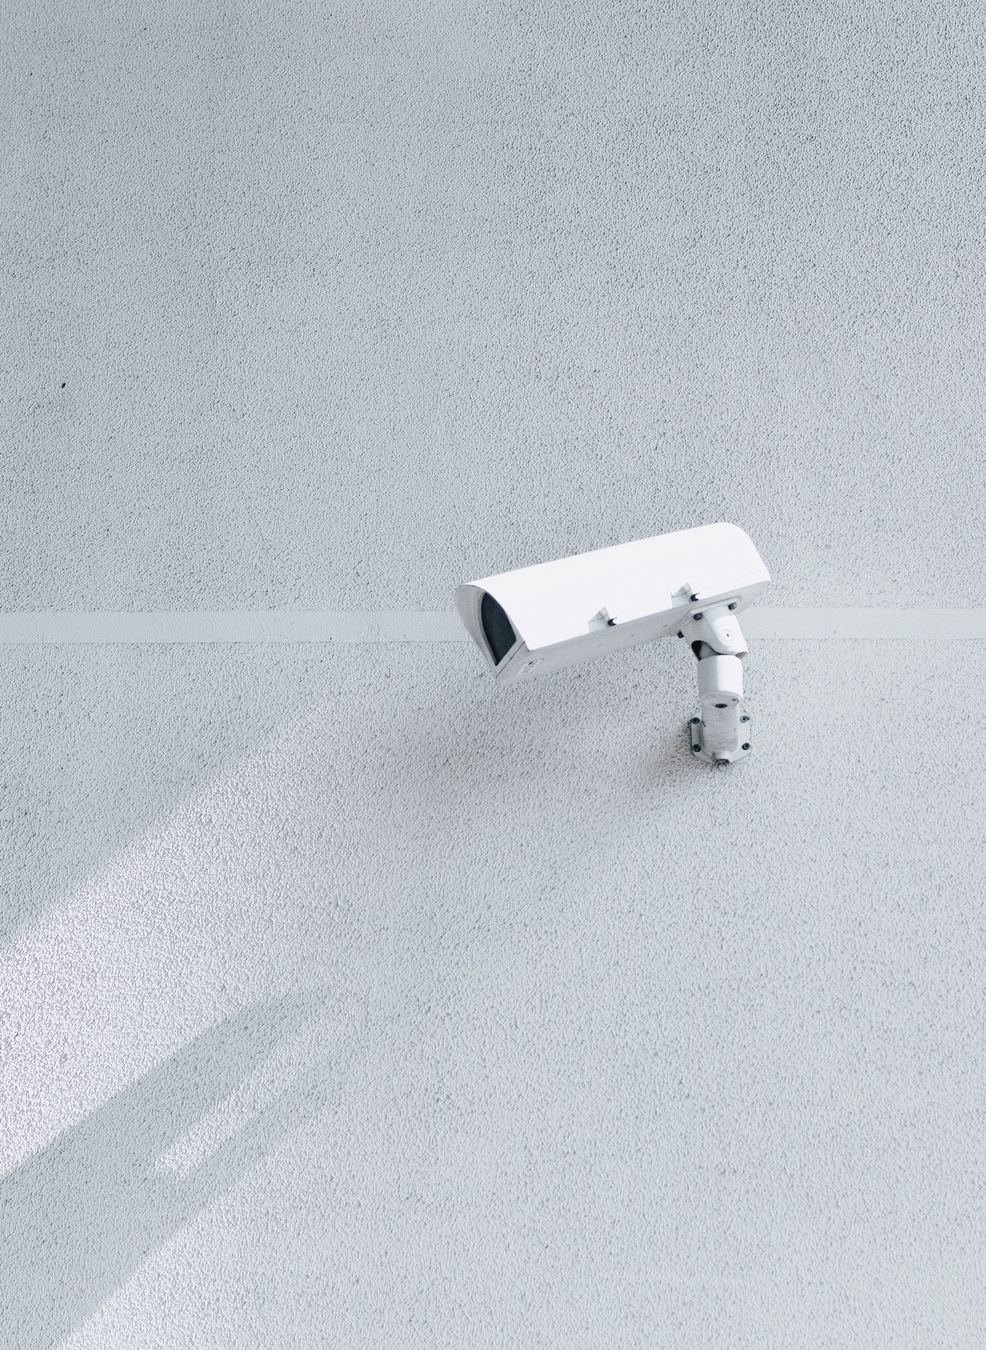
Photo by Siarhei Horbach on Unsplash
Further reading
It would be nice if all of the data which sociologists require could be enumerated because then we could run them through IBM machines and draw charts as the economists do.
However, not everything that can be counted counts, and not everything that counts can be counted.
William Bruce Cameron 1963 text “Informal Sociology: A Casual Introduction to Sociological Thinking
What does your app really do?
By Caner Uguz
What does your app really do?
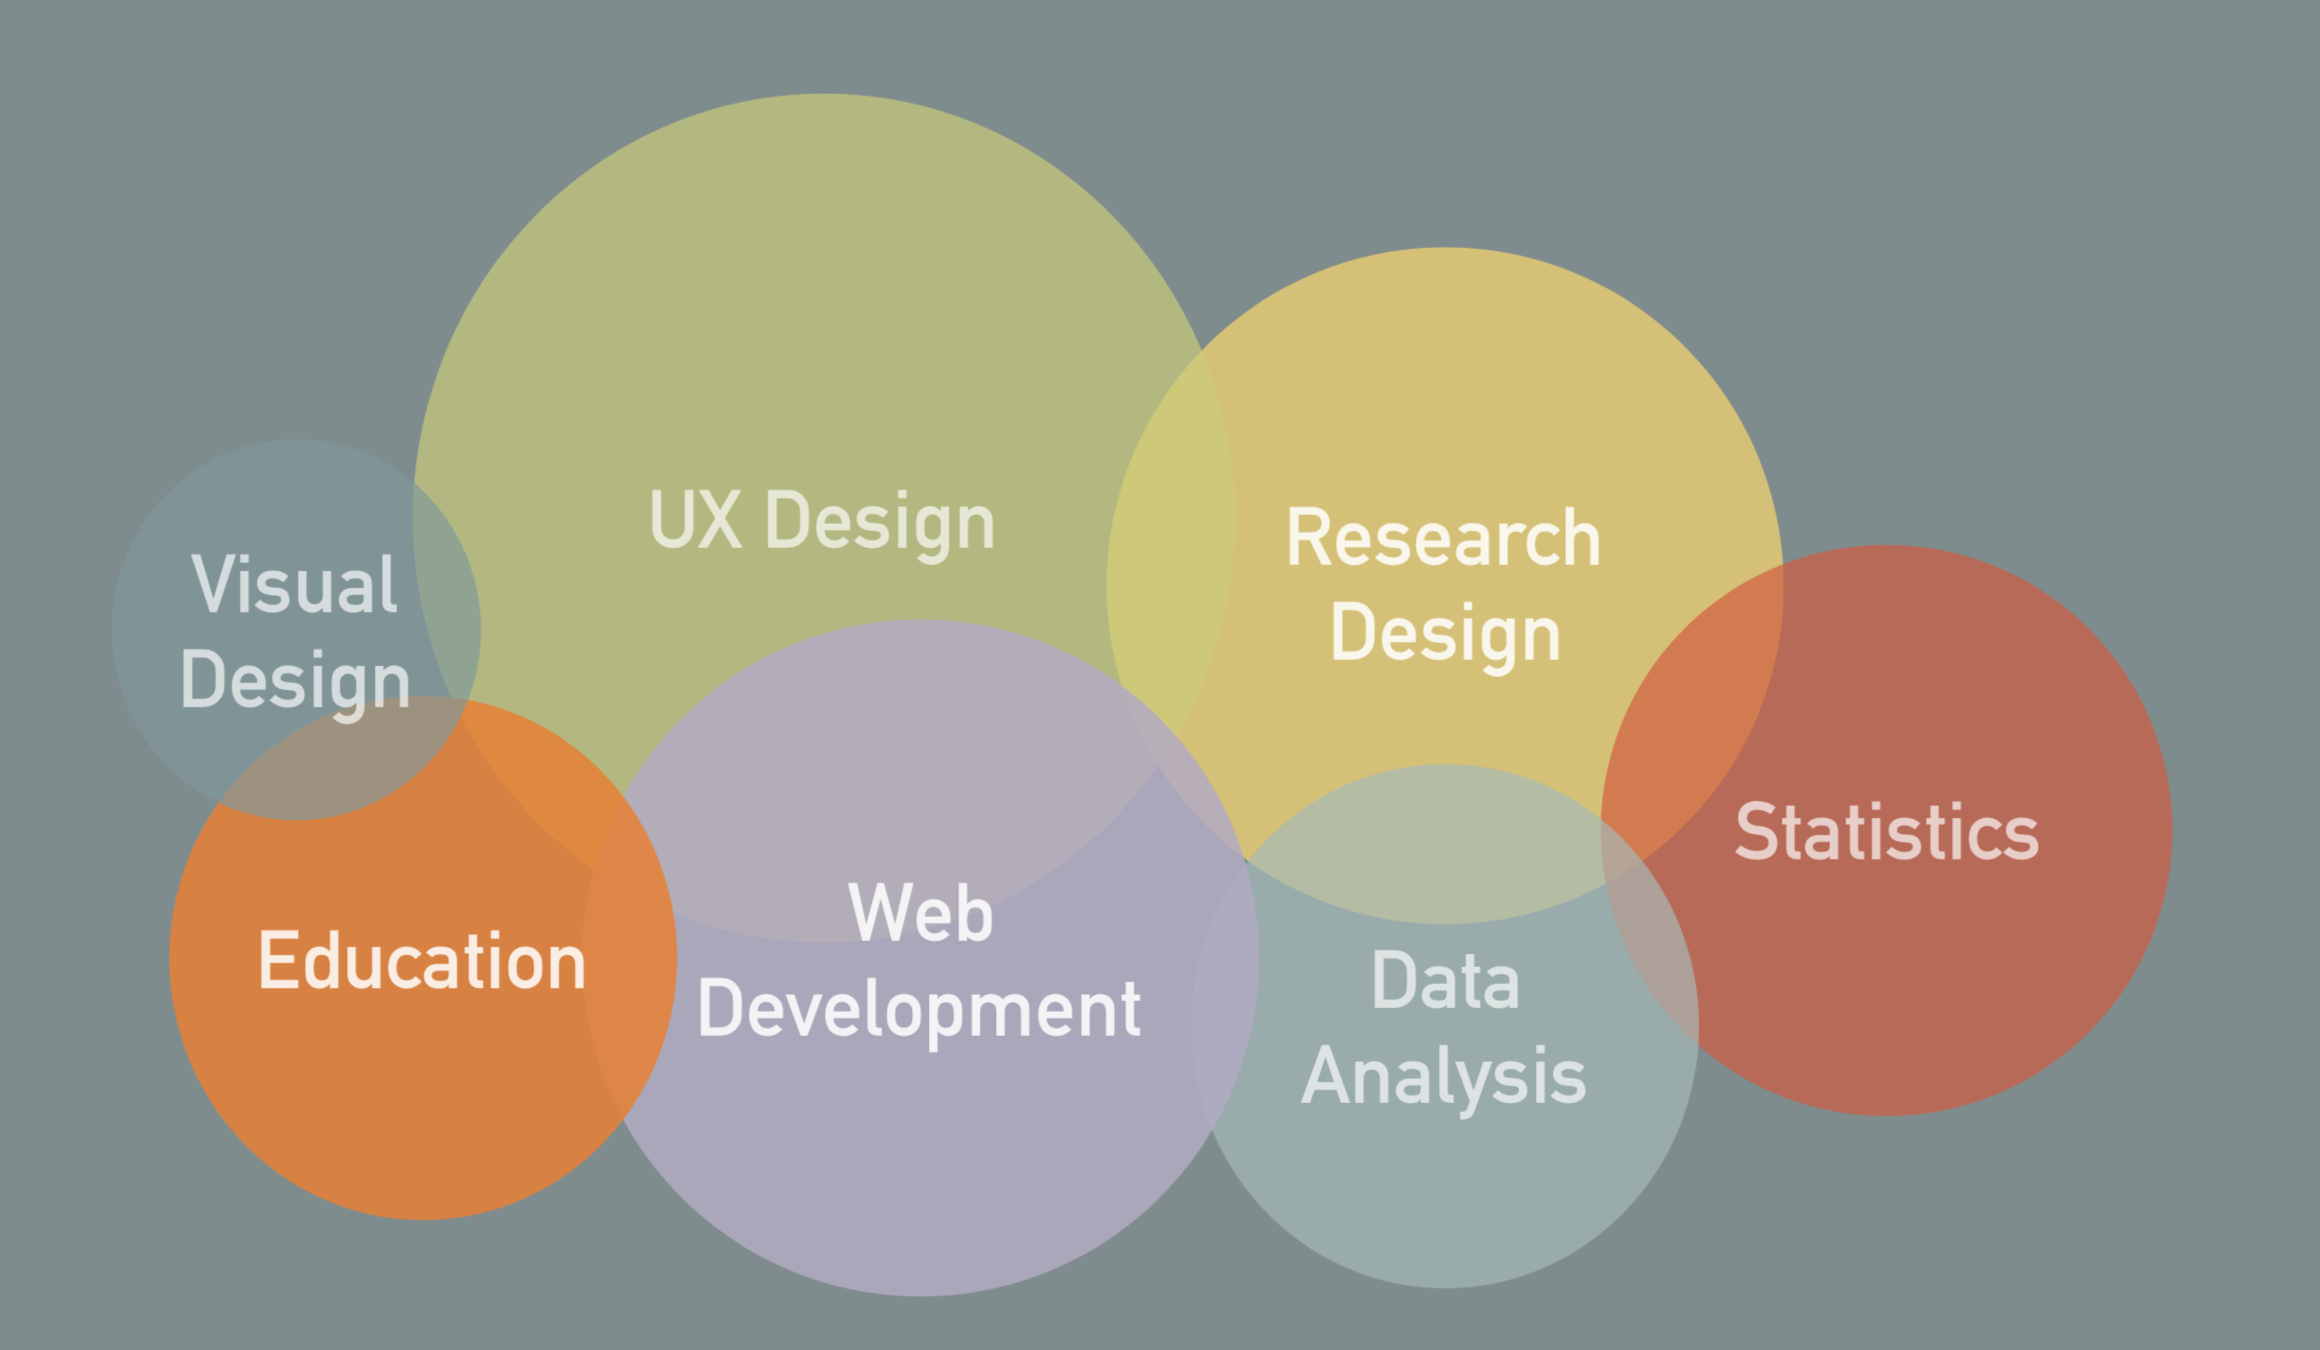
Instrumentation combining academic research methodology and UX research.