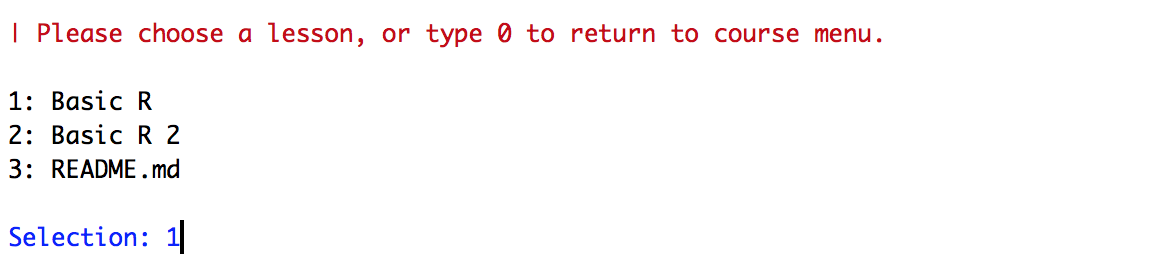
R Script
Introduction and Practice -1
Shawn Chen 2016.8.13
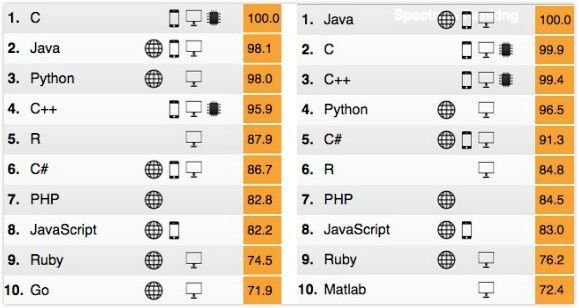
R語言簡介
面對撲面而來的資料浪潮,包含 Google、Facebook、Intel、Pfizer、Bank of America 等國際級企業,都已經採用 R 語言進行資料分析,許多全球一流大學如 Stanford、Johns Hopkins 和 UCLA 也將 R 視為資料分析課程的先修科目。R 語言具有免費、跨平台、佔有率高、可塑性高等優勢,各式各樣的 R 社群蓬勃發展。在國際知名的 KDnuggets 論壇統計當中,R 語言已經連續三年獲得資料科學家最常使用的資料分析語言第一名。

IEEE Spectrum Rank
Let's try it!
If you do not finish RStudio downloading, use this link.

RStudio Interface

Try it!

> x <- 10
> y <- "IBM"
>
Try it!

> x <- 10
> y <- "IBM"
> z <- rnorm(1000, mean = 100, sd = 5)
>
rnorm?

> z <- rnorm(1000, mean = 100, sd = 5)
> ?rnorm
>
rnorm

> z <- rnorm(1000, mean = 100, sd = 5)
> ?rnorm
> z
rnorm

> z <- rnorm(1000, mean = 100, sd = 5)
> ?rnorm
> z
> hist(z)
>
Exercise 1
Display the histogram of normal distribution with 1000 numbers, average 10 and standard deviation 10
Exercise 1

> hist(rnorm(1000, mean = 10, sd = 10))
>
R Data Structure
R's Basic Data Types
- Integer
- Numeric
- Complex
- Character
- Logical
Data Types
> class(x)
[1] "numeric"
> class(y)
[1] "character"
>
Data Types
> class(x)
[1] "numeric"
> class(z)
[1] "numeric"
> class(z)
[1] "numeric"
>
Data Types
> x <- 10
> class(x)
[1] "numeric"
> x <- as.integer(x)
> class(x)
[1] "integer"
>
Data Types
> x <- 10
> class(x)
[1] "numeric"
> x <- as.integer(x)
> class(x)
[1] "integer"
> y <- as.integer(y)
Warning message:
NAs introduced by coercion 
General Data Structures
- Vector
- Matrix
- Array
- List
- Data Frame
Vector
The basic data object in R,
consisting of one or more values of
a single data type.
Matrix
A two-dimensional of a single data type.
Array
A multi-dimensional object of a single data type.
Data Frame
A special kind of named list where all elements has the same length.
List
A list can contain (multi) dimensional objects of any data type.
Vector
Matrix
Array
DataFrame
List
Practice
Create Vector
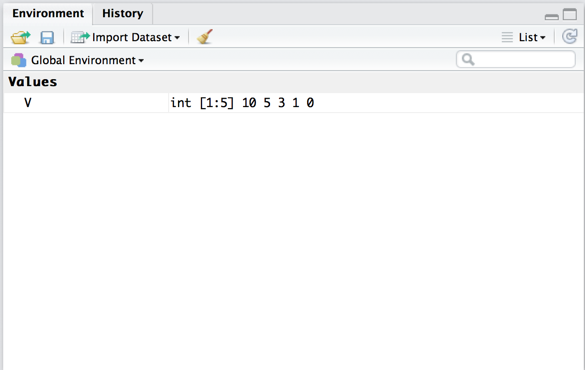
> V <- c(10, 5, 3, 1, 0)
> class(V)
[1] "numeric"
> 
Create Vector
> V <- c(10, 5, 3, 1, 0)
> class(V)
[1] "numeric"
> V <- as.integer(V)
> class(V)
[1] "integer"
> 
Create Vector
> V2 <- c(1, 2, NA, NA, 5)
> V2[1]
[1] 1
> V2[4]
[1] NA
> 
Create Array
> A <- 1:24
> dim(A) <- c(3, 4, 2)
> A
, , 1

     [,1] [,2] [,3] [,4]
[1,]    1    4    7   10
[2,]    2    5    8   11
[3,]    3    6    9   12

, , 2

     [,1] [,2] [,3] [,4]
[1,]   13   16   19   22
[2,]   14   17   20   23
[3,]   15   18   21   24

> 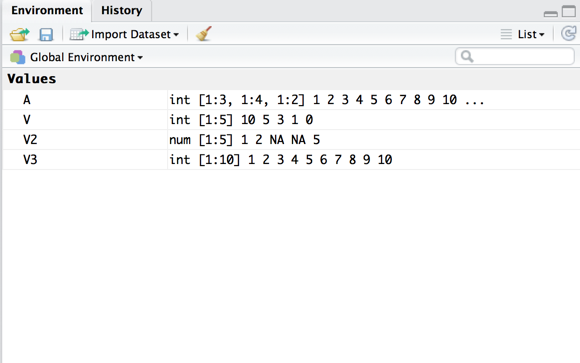
Create Array
> A <- array(1:24, c(3, 4, 2))
> A
, , 1

     [,1] [,2] [,3] [,4]
[1,]    1    4    7   10
[2,]    2    5    8   11
[3,]    3    6    9   12

, , 2

     [,1] [,2] [,3] [,4]
[1,]   13   16   19   22
[2,]   14   17   20   23
[3,]   15   18   21   24

>
Create DataFrame
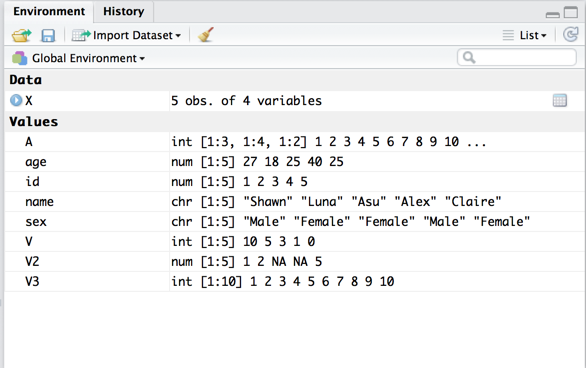
> age <- c(27, 18, 25, 40, 25)
> sex <- c("Male", "Female", "Female", "Male", "Female")
> name <- c("Shawn", "Luna", "Asu", "Alex", "Claire")
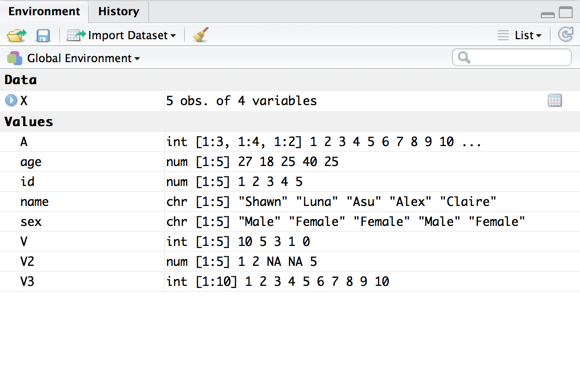
> X <- data.frame(id, age, sex, name)
> X
id age sex name
1 1 27 Male Shawn
2 2 18 Female Luna
3 3 25 Female Asu
4 4 40 Male Alex
5 5 25 Female Claire
> 
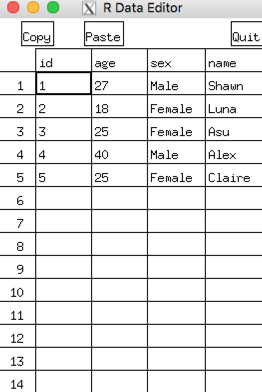
Edit DataFrame
> X <- edit(X)
> 
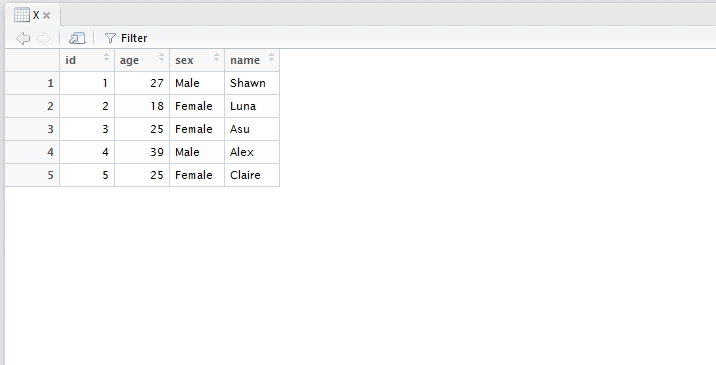
Edit DataFrame
> X$age[4] <- 39
> X
  id age    sex   name
1  1  27   Male  Shawn
2  2  18 Female   Luna
3  3  25 Female    Asu
4  4  39   Male   Alex
5  5  25 Female Claire
> 
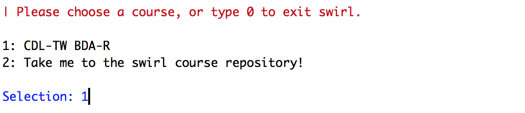
Exercise2
> install.packages("swirl")
> library(swirl)
> install_course_github("shiyoubun","CDL-TW_BDA-R")
> swirl()
>
R Data Import/Export
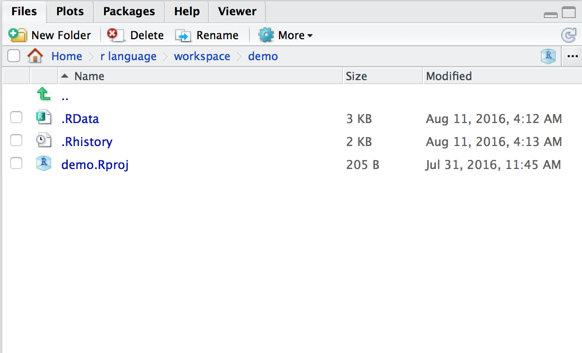
Working Directory
> setwd("/Users/shawn/r language/workspace/demo/")
> getwd()
[1] "/Users/shawn/r language/workspace/demo"
> 
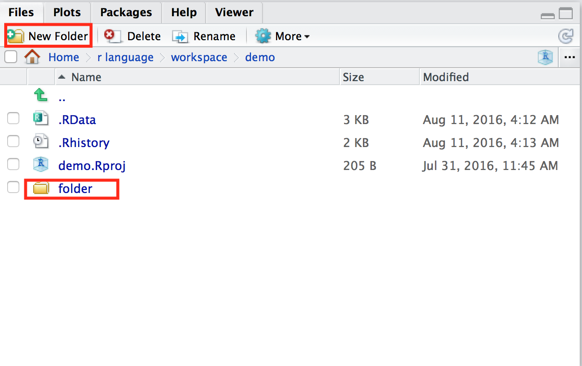
Working Directory
> setwd("/Users/shawn/r language/workspace/demo/")
> getwd()
[1] "/Users/shawn/r language/workspace/demo"
> setwd("folder")
> getwd()
[1] "/Users/shawn/r language/workspace/demo/folder"
> 
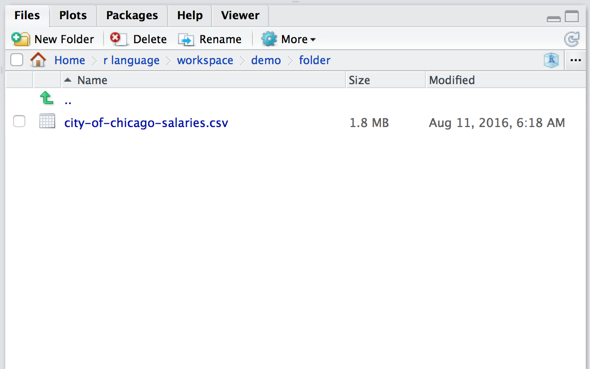
Import CSV files
csv download
Download csv to working directory
> getwd()
[1] "/Users/shawn/r language/workspace/demo/folder"
> 
read.csv
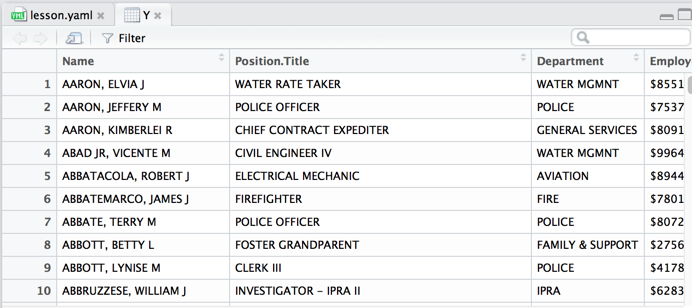
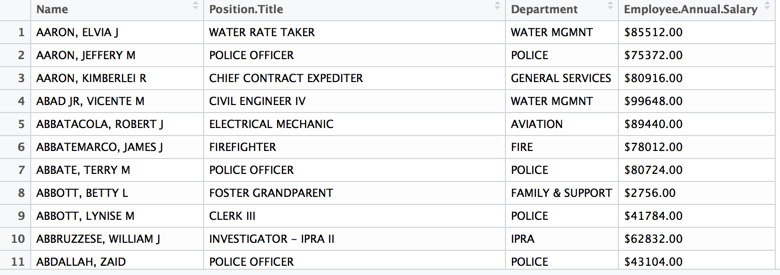
> Y <- read.csv("city-of-chicago-salaries.csv")
> View(Y)
>
write.csv
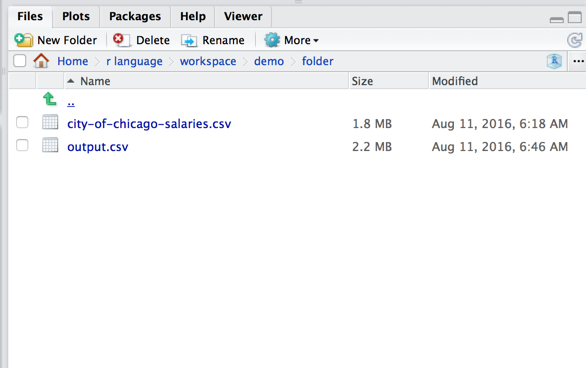
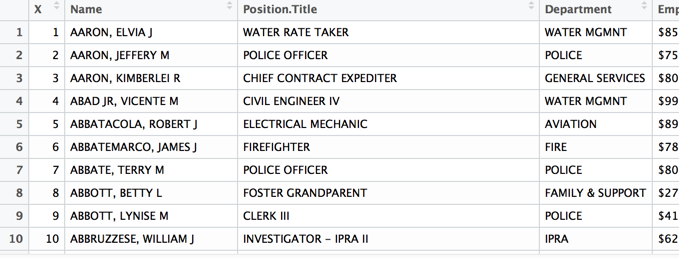
> write.csv(Y,"output.csv")
> View(Y)
>
write.csv
> write.csv(Y,"output.csv")
> View(Y)
>
write.csv
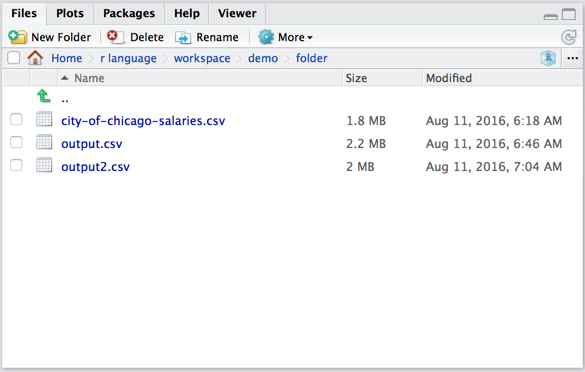
> write.csv(Y,"output2.csv", row.names=FALSE)
> View(Y)
>
Let's do some data process
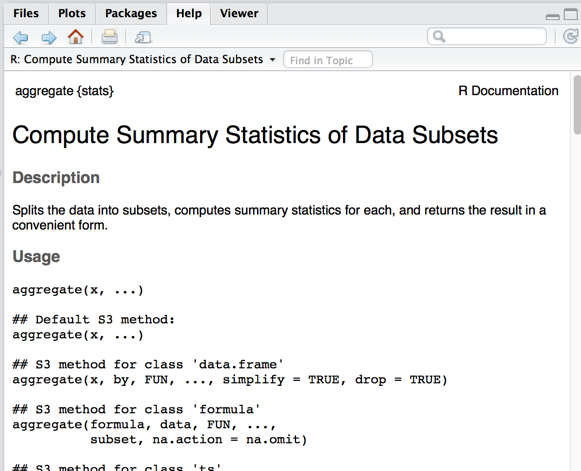
aggregate
> ?aggregate
>
Remove $ in data frame
> Z <- Y
> Z$Employee.Annual.Salary = as.numeric(gsub("[\\$,]","",Z$Employee.Annual.Salary))
New dataframe
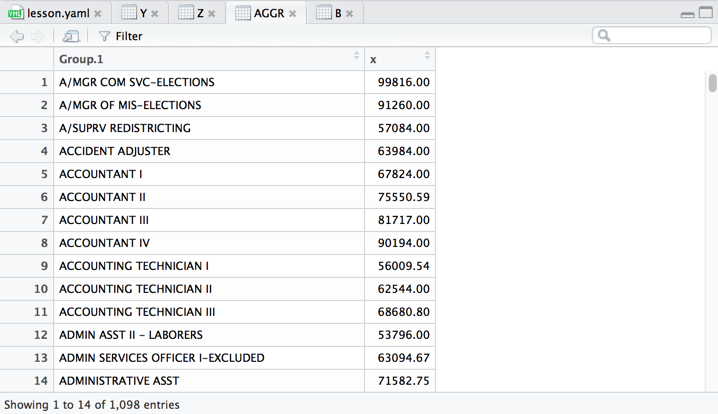
> AGGR <- aggregate(Z$Employee.Annual.Salary,
by = list(Z$Position.Title), FUN = mean)
> View(AGGR)
>
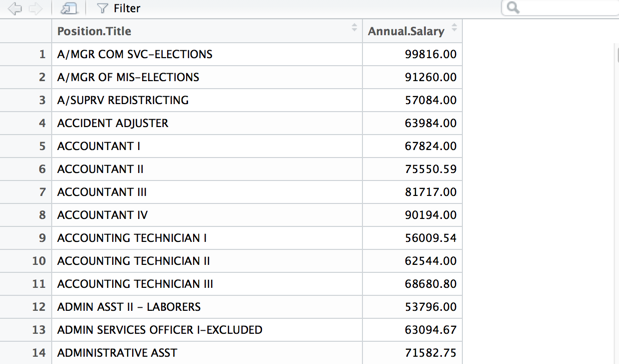
New dataframe with column name
> AGGR <- aggregate(Z$Employee.Annual.Salary,
by = list(Z$Position.Title), FUN = mean)
> View(AGGR)
> AGGR <- setNames(AGGR, c("Position.Title",
"Annual.Salary"))
> View(AGGR)
>
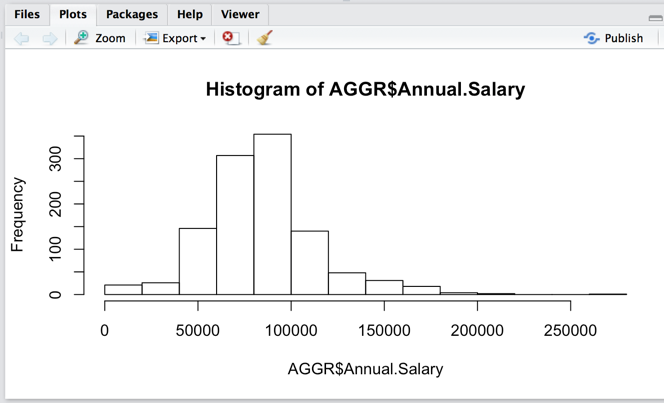
Draw histrogram
> hist(AGGR$Annual.Salary)
>
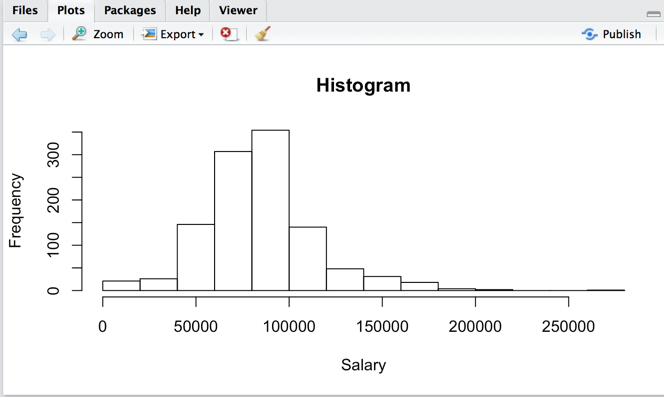
Draw histrogram
> hist(AGGR$Annual.Salary, main="Histogram",
xlab = "Salary")
>
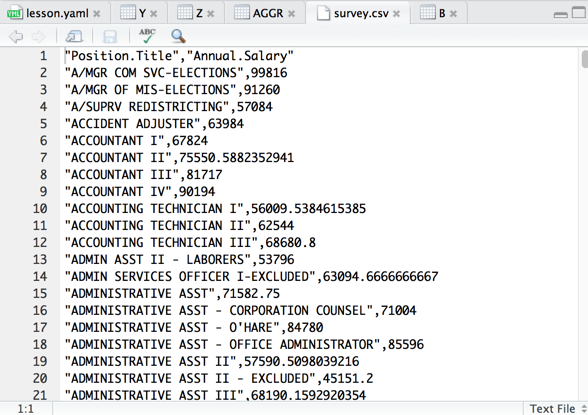
Write to csv file
> write.csv(AGGR,"survey.csv",row.names = FALSE)
>

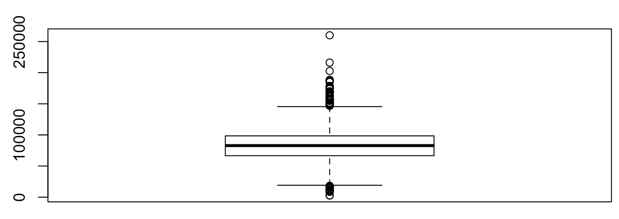
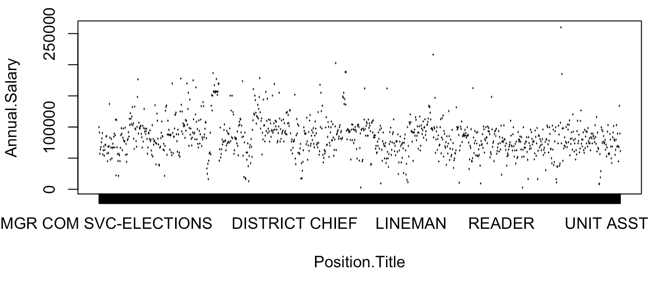
Try it!
- plot()
- boxplot()
plot
boxplot
Exercise3
> install.packages("swirl")
> library(swirl)
> install_course_github("shiyoubun","CDL-TW_BDA-R")
> swirl()
>

deck
By Chen Hsiang-wen
