Anatomy

of a 

Web Map

Most basic principles

of web mapping, with some history and gifs sprinkled in

Disclaimer:

I do not know everything -- interrupt with questions/comments


FYI links are blue

Let us begin...

But first, let's thank

Why Anatomy?

Both bodies and web maps are comprised of systems that interact and intertwine 

Fundamental Building Blocks


Cells

= Data

Digestive,
Circulatory & Nervous Systems

=

Styles, Tiles & Servers

What is a web map?

Not just on the web, but powered by the web

How do web maps differ from digital maps?

Digital:

Involves a computer- a web map is a kind of digital map

Internet is key

Web maps are viewed in a browser

History:

How did we get here?

First, there were digital maps. Like those made in ArcGIS

Good for desktop GIS

Not user friendly for web-based viewing

1996

Directions on the web?

PARTY!

MapQuest:

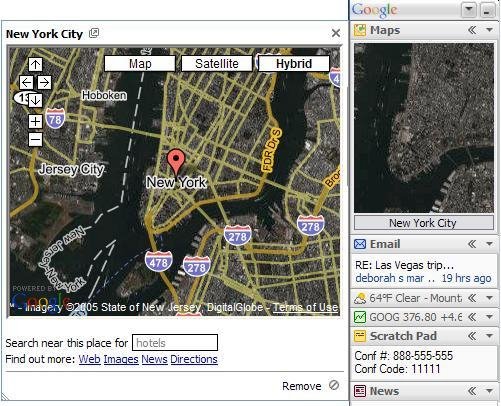
Earth-shattering, online directions engine

BUT

Slow to load, required full page refresh to scroll or zoom, and was always aligned to tile boundaries

2005:

Enter Google Maps

What's so great about google maps?

The TILE

All tiles are the same size (256 x 256 px)

and share 

the same

boundaries

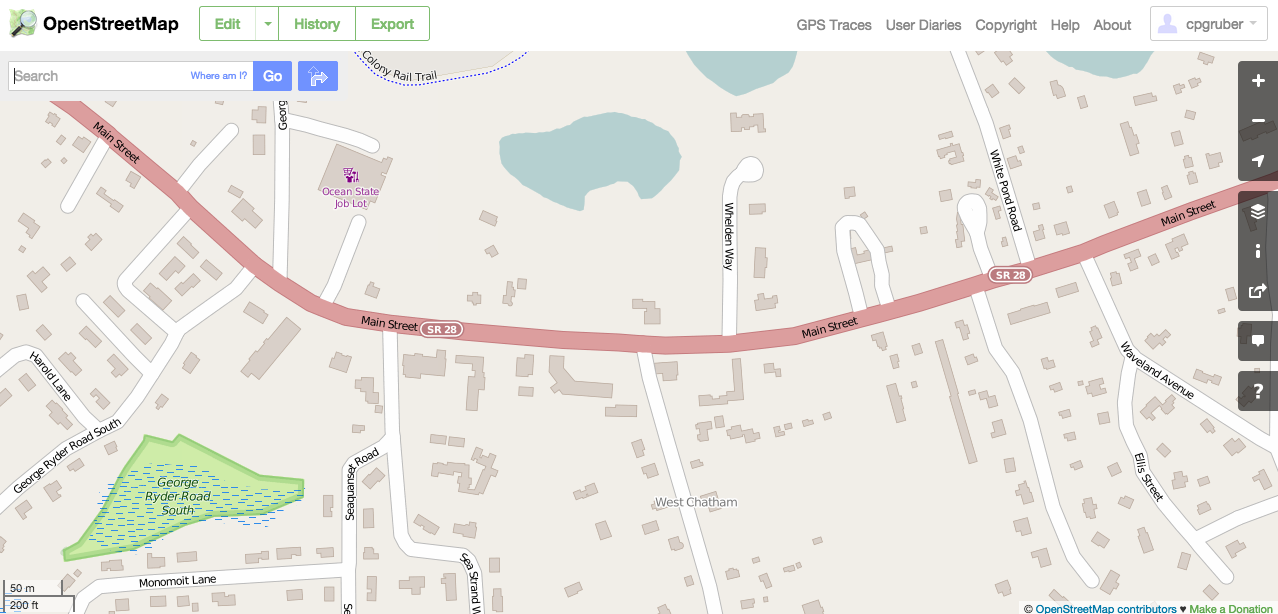
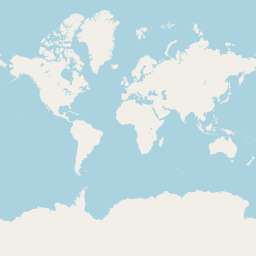
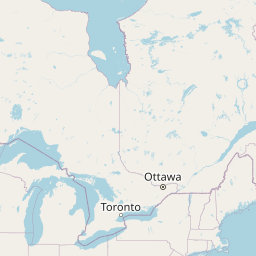
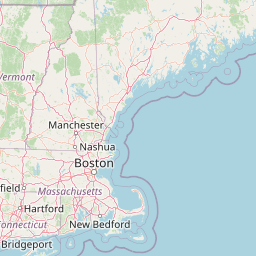
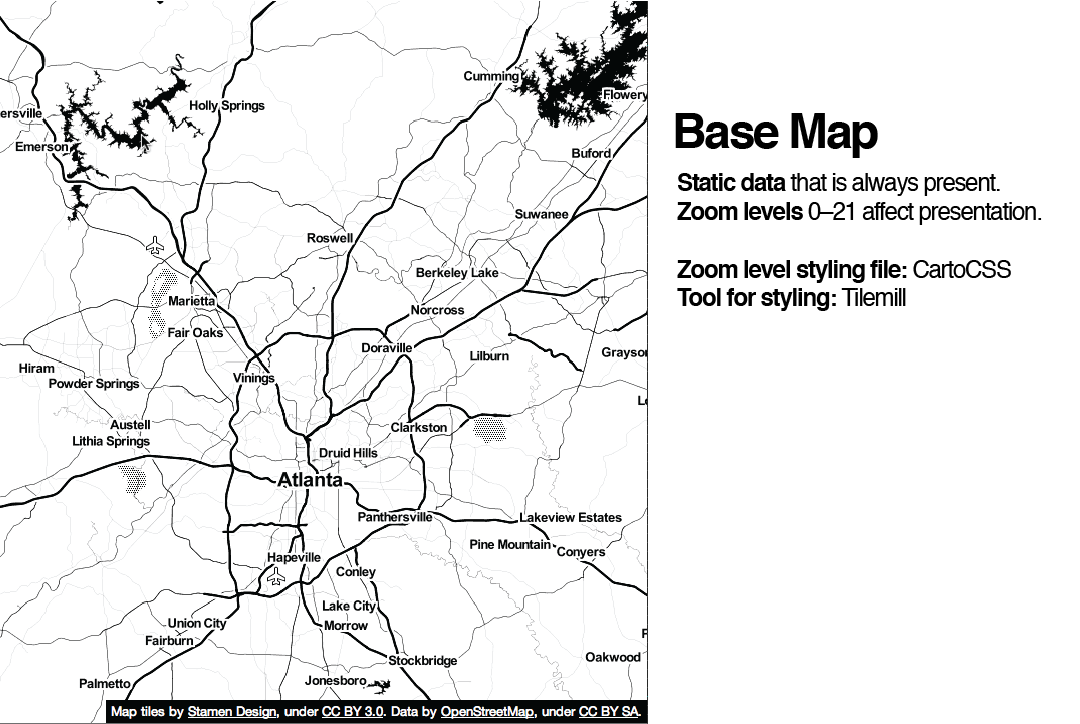
Tiles can be a road map,

satellite image,

or anything else

Individual tiles load faster than a huge, single image

Web maps like this load the tiles that are on your screen. If the map is “smart,” it will pre-load tiles outside of the screen, along the top, bottom, left, and right. 

These are referred to as

Slippy

maps

MapQuest (1996)


Google Maps (2005)

Each zoom level has a set of tiles

0

4

6

12

16

With each zoom level

the number

of tiles


Increases

Exponentially

Usually 20ish

zoom levels

Map tiles are just images on the web

Tile Server Name

Zoom level (z)

XY pair

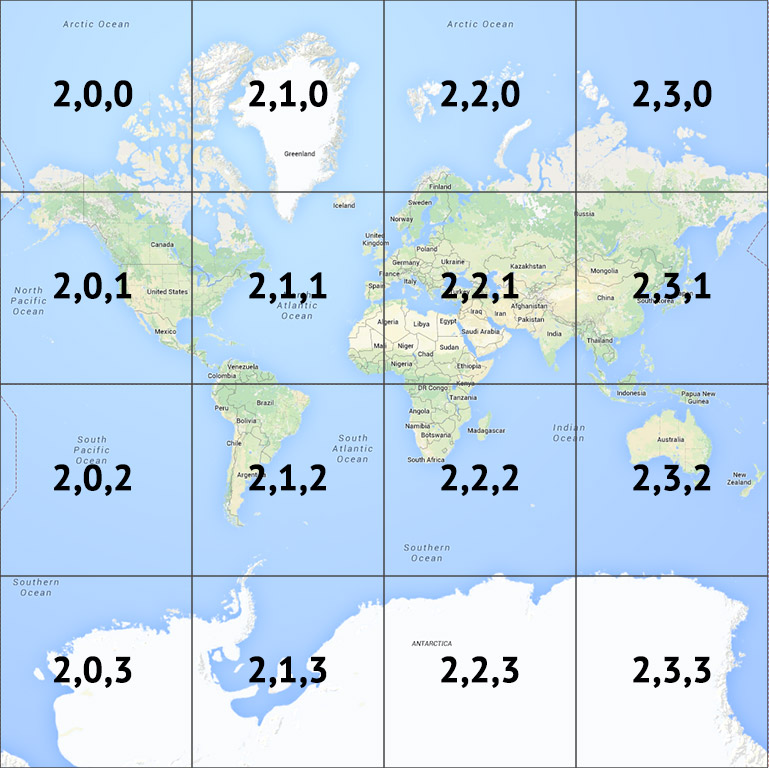
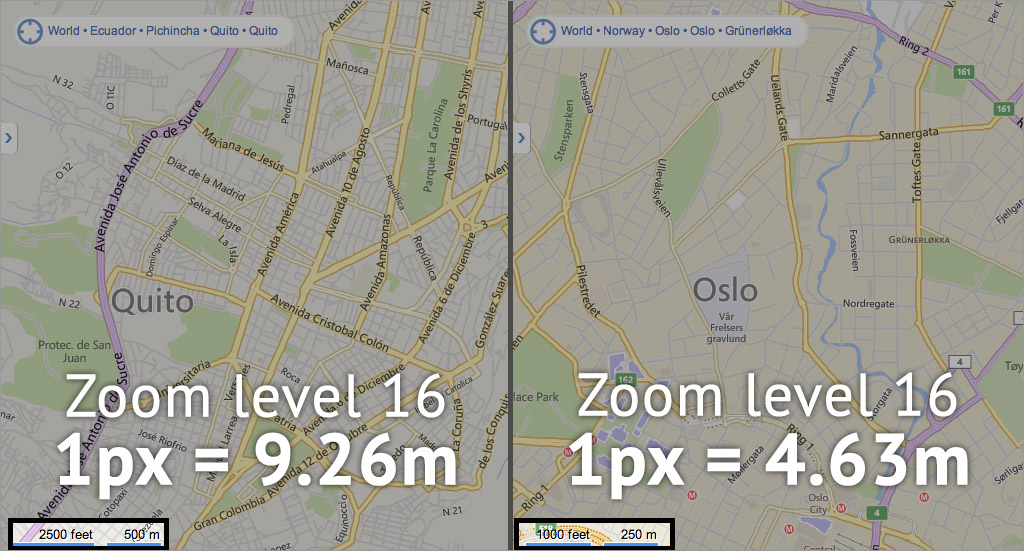
(Location of the tile on a global grid)

Number of tiles at zoom-level z:

2^z * 2^z = 4^z
2z2z=4z

Tiled web maps use the Mercator projection

Designed for marine navigation, does a good job at preserving shape and direction

The math is (relatively) simple

x = λ
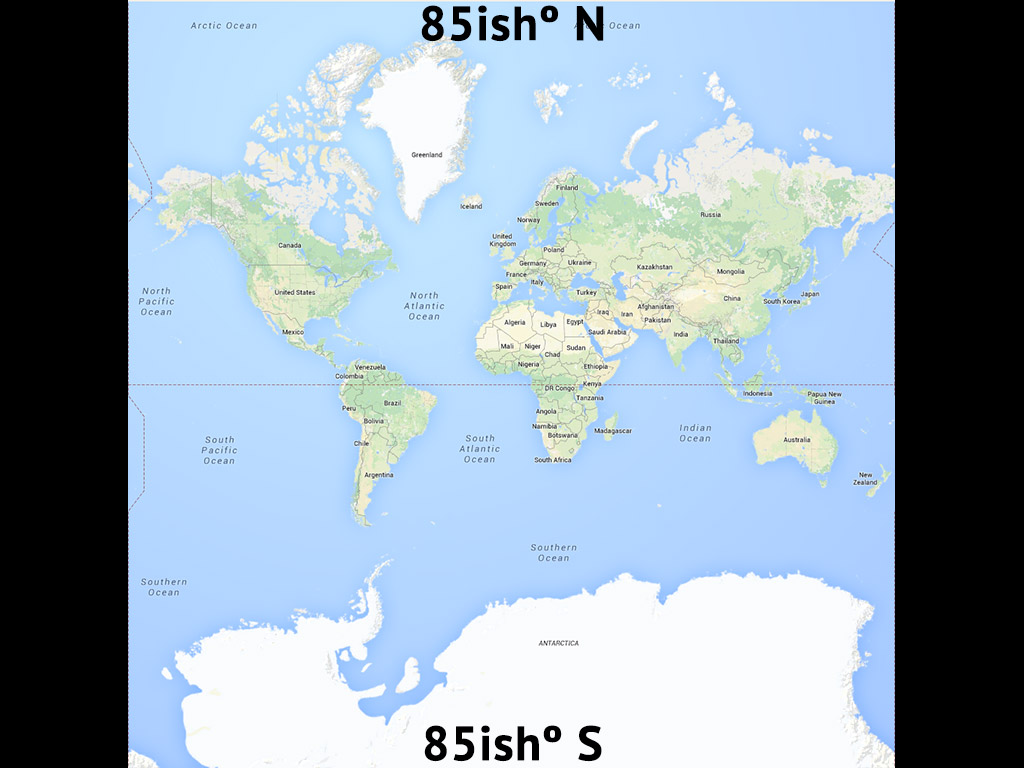
y = ln(tan φ + sec φ)
where λ is longitude, φ is latitude

BUT

ln(tan 90° + sec 90°) = Infinity

SO

Zoom level ≠ 

Scale

All other slippy map software followed Google's lead, using tiles as their map's base

Not surprisingly, a collection of raster tiles makes up what we call a base layer or basemap

When we layer things like markers on top of them, we call those data layers or content layers or feature layers

They are often  vector layers (points, lines, or polygons) that can be made interactive (ex.click a marker and a popup appears)

Data layers:

Desktop GIS prefers shapefiles

Web maps prefer KML or GeoJSON

WHOA

Back to the anatomy...

<html>
  <head>
    <link rel="stylesheet" href="http://cdn.leafletjs.com/leaflet-0.6.4/leaflet.css" />
    <script src="http://cdn.leafletjs.com/leaflet-0.6.4/leaflet.js"></script>
    <style type="text/css">
      #mapdiv { height: 100%; }
    </style>
  </head>
  <body>
    <div id="mapdiv"></div> 

    <script>
      var geojsonFeature = { 
        "type": "Feature",
        "properties": {
            "name": "PARISOMA"
        },
        "geometry": {
            "type": "Point",
            "coordinates": [-122.41598, 37.77349]
        }
      };

      var mapvar = L.map('mapdiv').setView([37.7706,-122.3782],12); 

      var tileLayer = L.tileLayer(
        'http://{s}.tile.stamen.com/toner/{z}/{x}/{y}.jpg', 
        {attribution: 'Map tiles by <a href="http://stamen.com">Stamen Design</a>, under CC BY 3.0. Data by <a href="http://openstreetmap.org">OpenStreetMap</a>, under CC BY SA.'}
      );

      mapvar.addLayer(tileLayer);

      var geojsonLayer = L.geoJson(
        geojsonFeature, 
        {
          onEachFeature: function(feature, layer)
            { layer.bindPopup(feature.properties.name);}
        }
      );

      mapvar.addLayer(geojsonLayer);

    </script>

  </body>
</html>

???

Javascript library grabs tiles, adds content layers, and handles interaction

The javascript:

we recommend Leaflet, although there are others: OpenLayers(which is making a comeback) / Modest Maps /Polymaps

My head is spinning...

How do I get started on my own?

Do I need to make my own tiles?

No? Use these! 

OpenStreetMap,

StamenMapBox,

MapQuest, Cloudmade

Yes? Use TileMill or Mapbox Studio to design your own styles

Style using CartoCSS


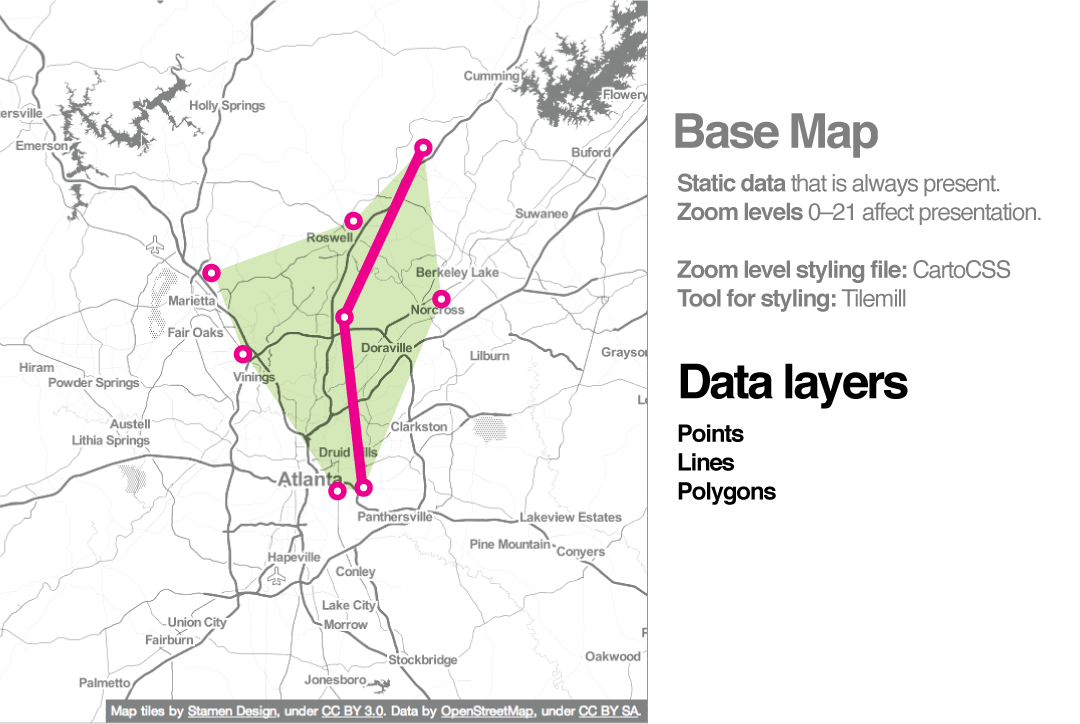
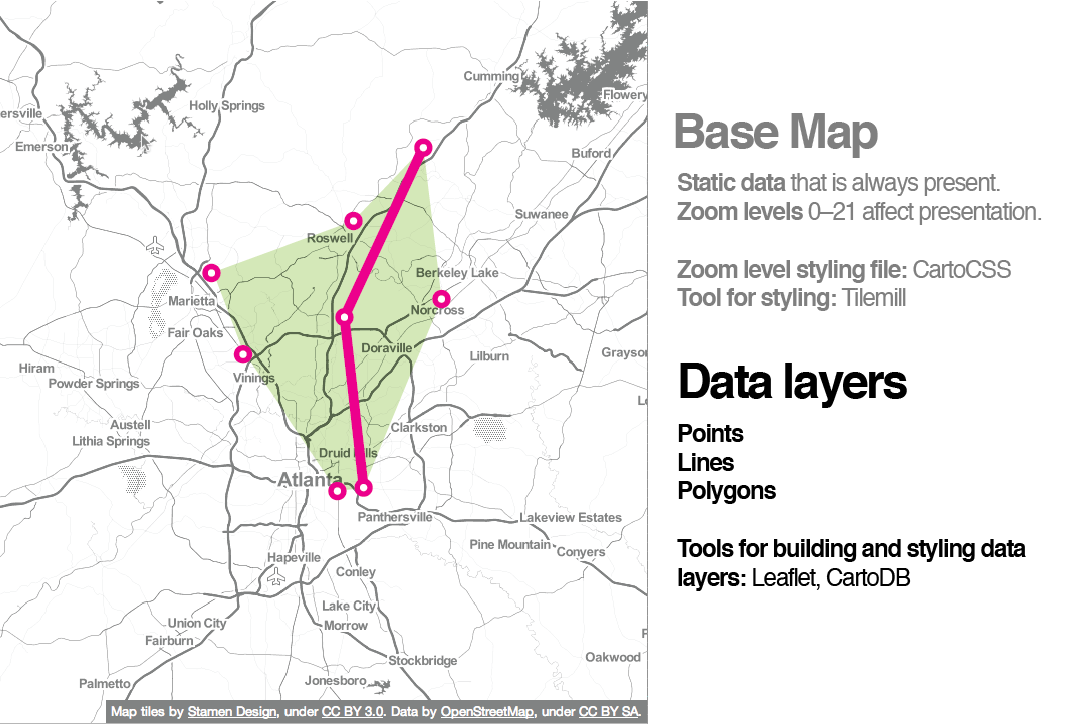
Full control over all map elements

Literally everything

Serve the tiles by running your own tile server. For example: TileServer.php,  TileStacheTileCache,

TileStreammbtiles-servermod_tile

More details here: Geo Platform tutorial 
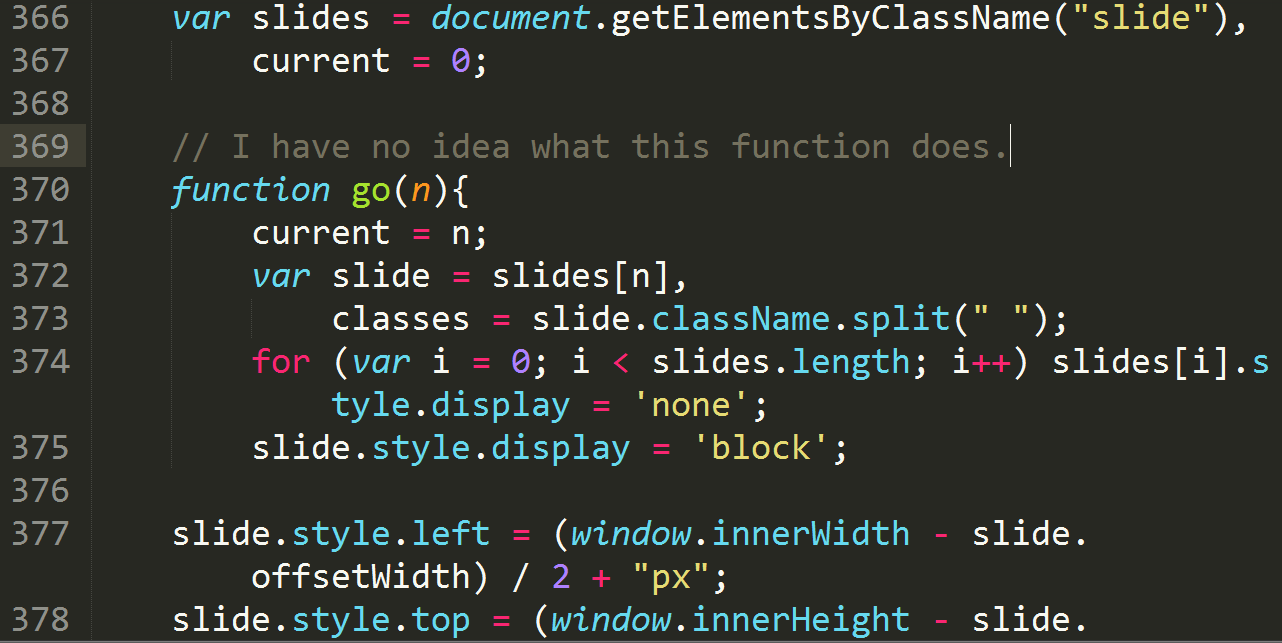
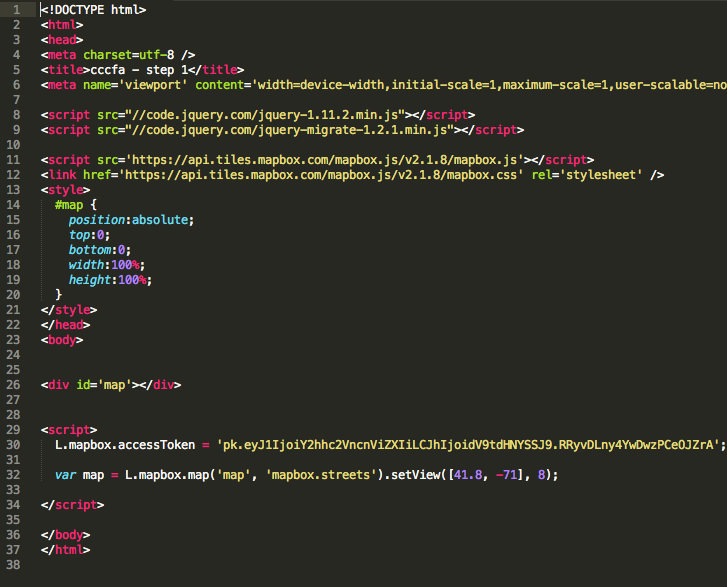
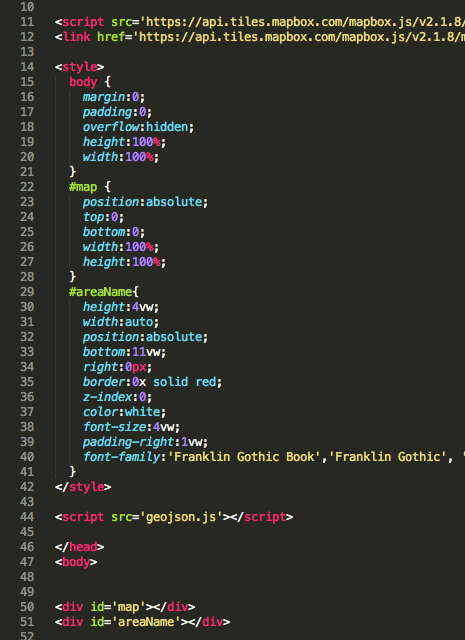
Do I need a content layer?

No?

Put all your data into the tiles,

make it interactive using UTF-Grid

Yes?

Convert shapefiles, csv, kml to GeoJSON using OGRE,

or make one using geojson.io

CartoDB can be a one-stop shop for all of this

What about code?

Find a text editor!
Notepad ++
Brackets
Sublime Text

Set up a Sandbox
JSFiddle
Codepen

Share on Github

Find examples, copy/paste/fork, change things

That's all! Now you can play for hours on end

Once again, let's thank

Let's make a map...

Follow along the code here

the map div

mapping library

"make a map in the div called 'map' "
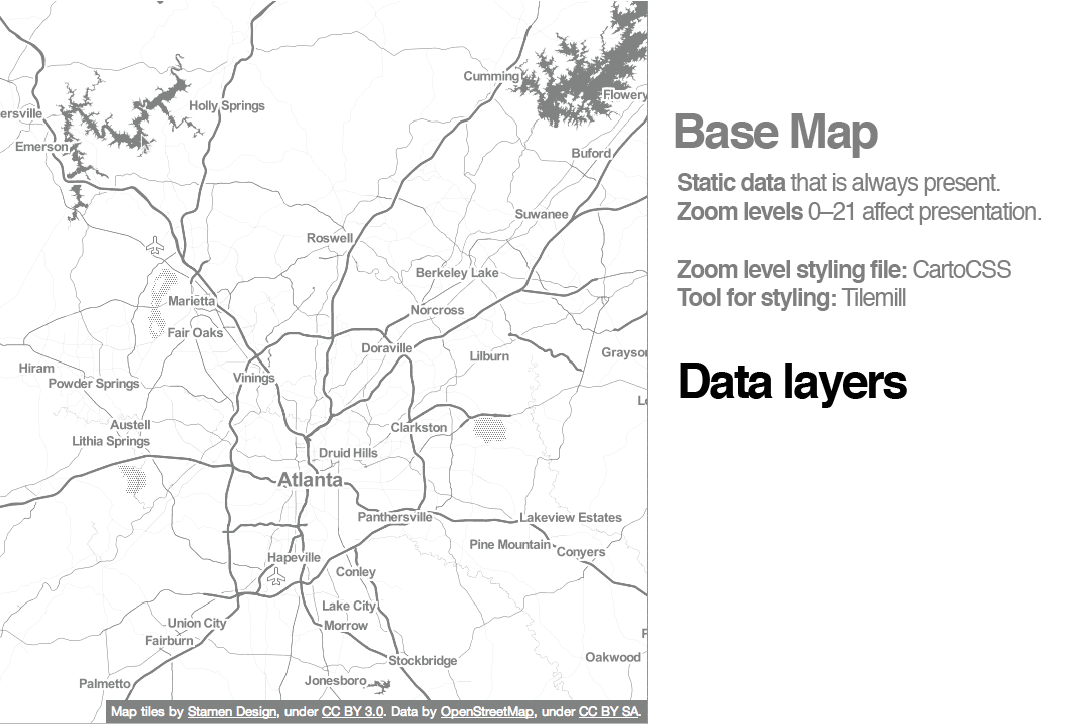
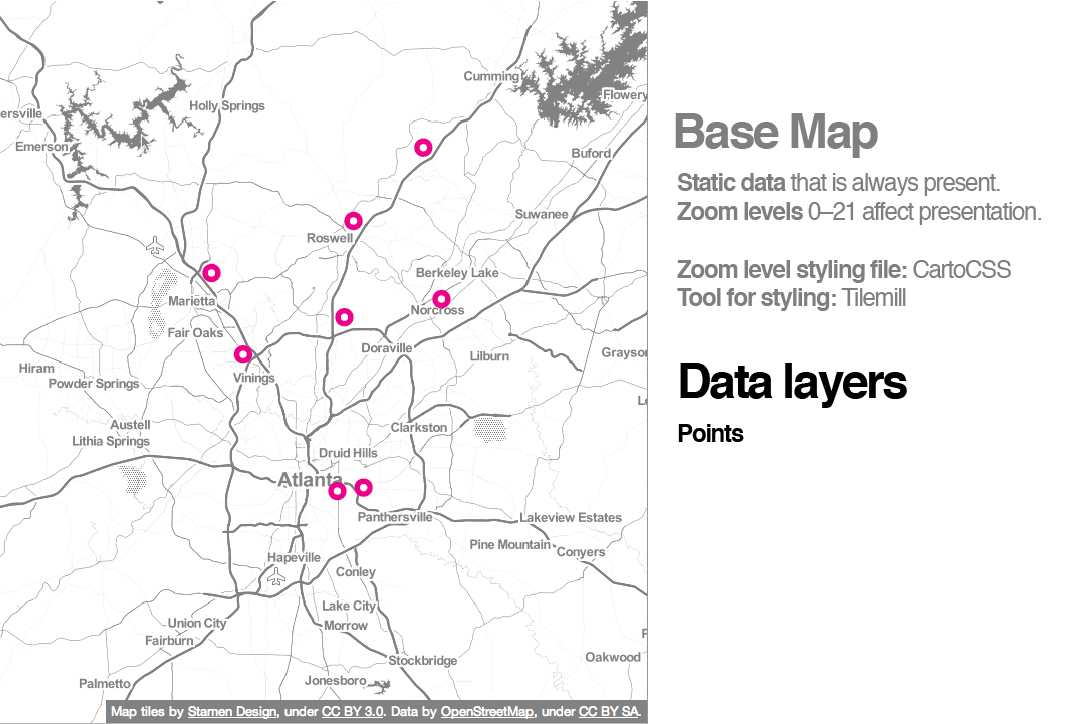
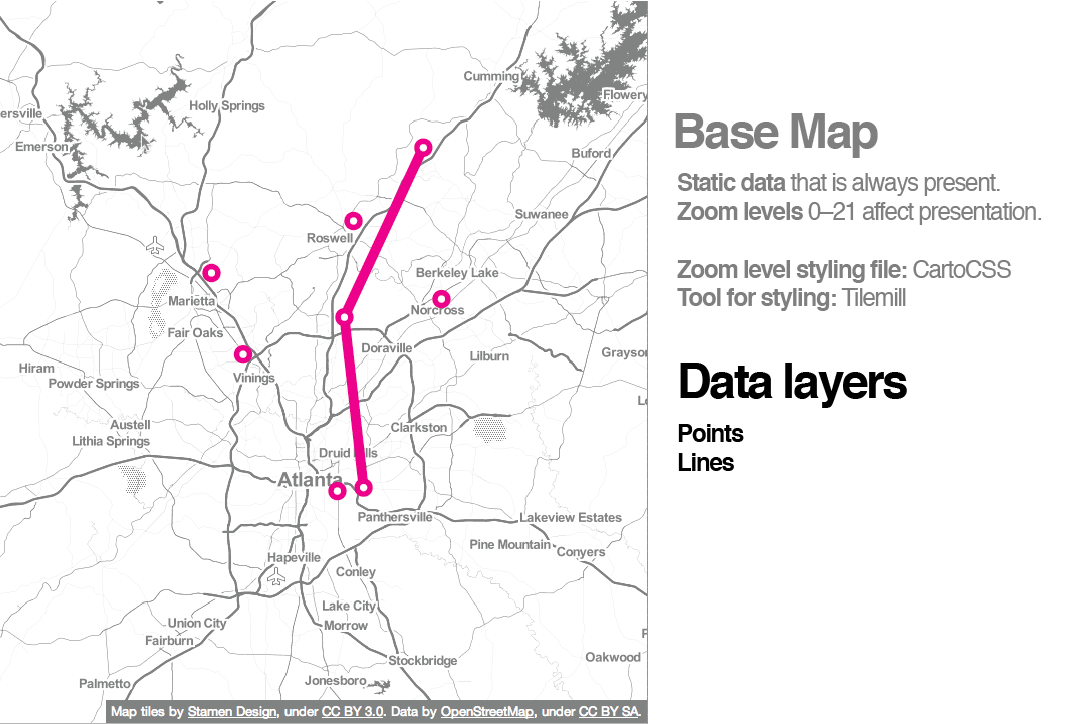
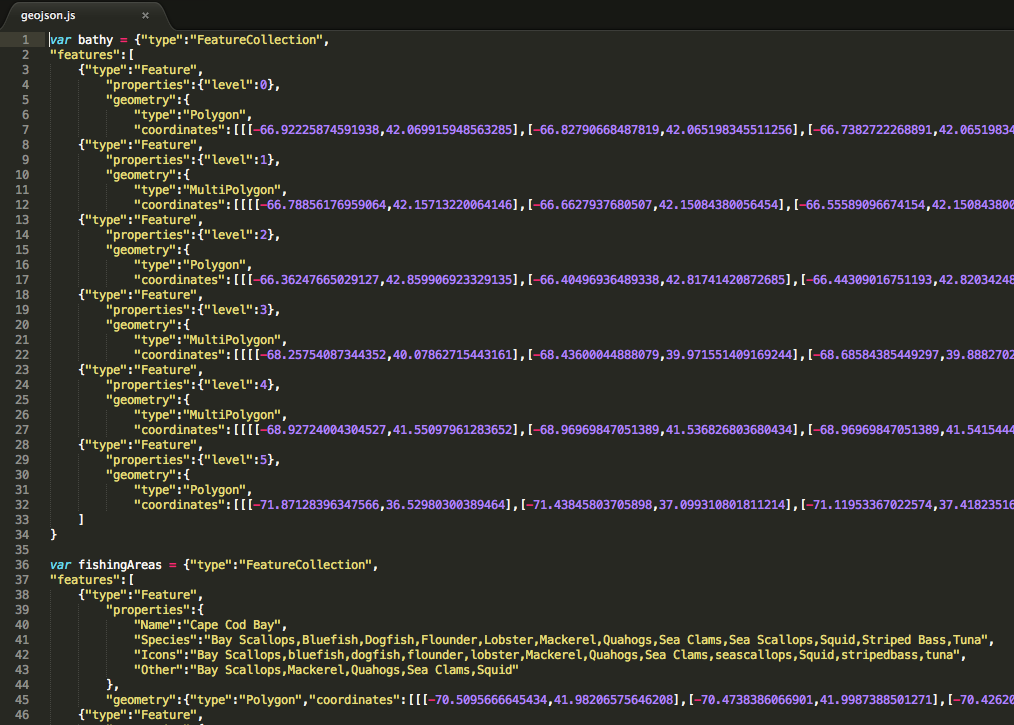
DATA!

Add data

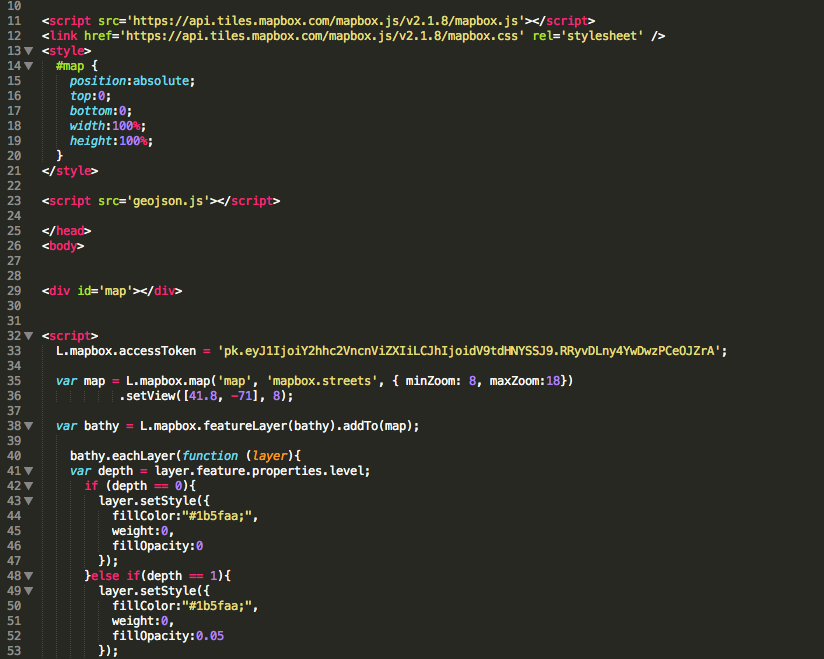
Add bathymetry geoJson to map

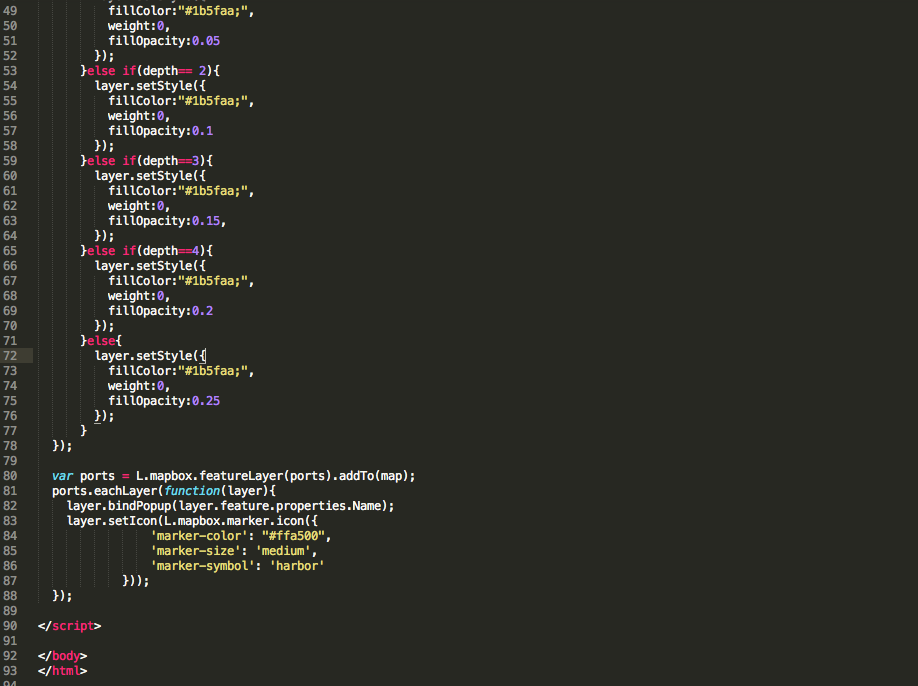
Style bathymetry geoJson

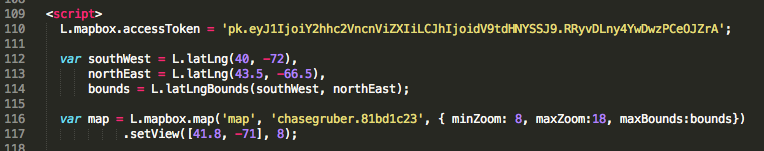
Restrict zoom levels
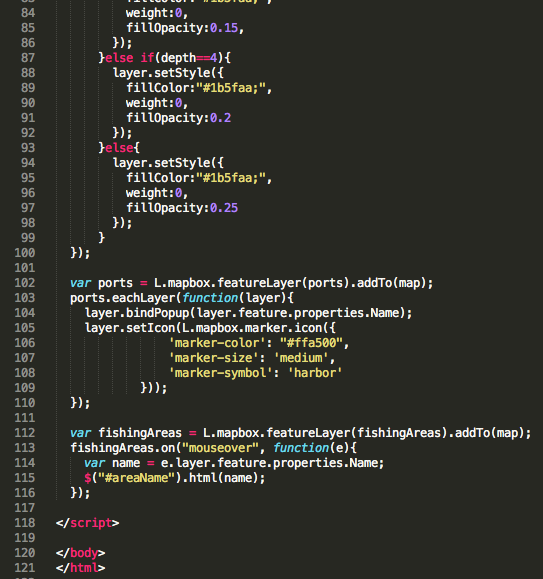
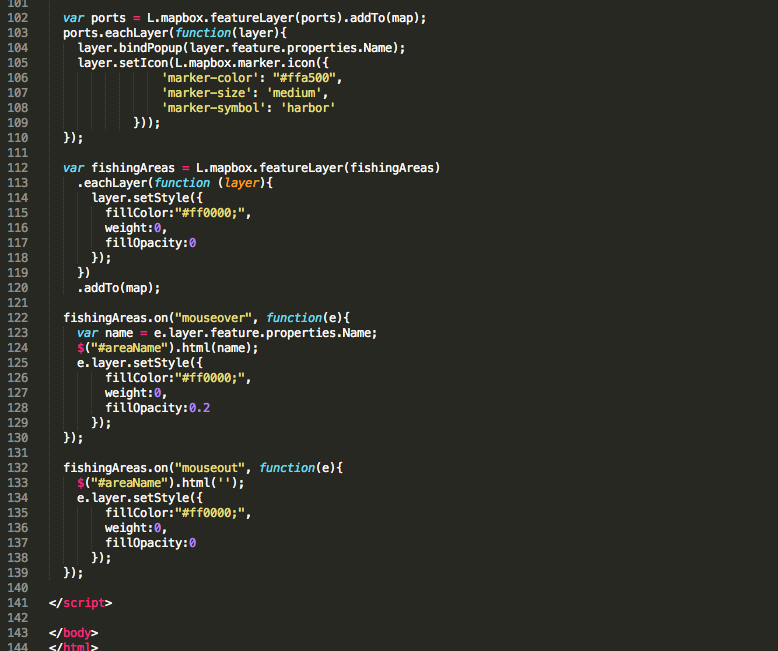
Add ports

geoJson to map

Bind popup to each feature

Set marker icon

Add 'areaName' element

Add fishing areas geoJson to map

Add interaction

Style fishing areas transparent

When the mouse enters a fishing area, make it opaque

When the mouse leaves a fishing area, make it transparent again

Custom map tiles

Restrict map bounds (preserves map views)

+ a little more HTML, CSS & jQuery...

That's all folks

June 9, 6-8p Sturgis Library Barnstable Village

See you there!

Tell your friends!

maptime-cape-cod-webmaps

By Chase Gruber

maptime-cape-cod-webmaps

maptime cape cod, second meeting slides

  • 5,039