Сети и структура пьесы
практика в Gephi
План
- Introducing Gephi
- Hands-on session
Gephi intro
Gephi
Open Source Software for Exploring and Manipulating Networks
download and install at
gephi.org
Gephi

Gephi is
- an open source software for exploring and manipulating networks
- "like Photoshop but for graph data" (gephi.org)
- written in Java and runs on most OS's
- extensible (plugins with additional features)
- ...a bit buggy :)
Let's get it started!
Do you have Gephi installed?
gephi.org
Importing data to Gephi
- Specific graph formats (GEXF, GraphML, Pajek NET, GDF, GML, TLP)
- File->Open
- Edges table in CSV
- File -> Import spreadsheet
goo.gl/1rnQp0
два GEXF файла, которые мы попробуем открыть в Gephi
Main windows
- Preview (Обработка)
- layout and all the calculations
- Data laboratory (Лаборатория данных)
- your original data (can be modified)
- Overview (Просмотр)
- for pretty pictures :)
Graph layouts

Graph drawing
укладка графа
- is a complex scientific area on its own
- lies at the intersection of computer science and some heavy-weight mathematics
- can emphasize different features of a graph
Layouts in Gephi

Layouts in Gephi
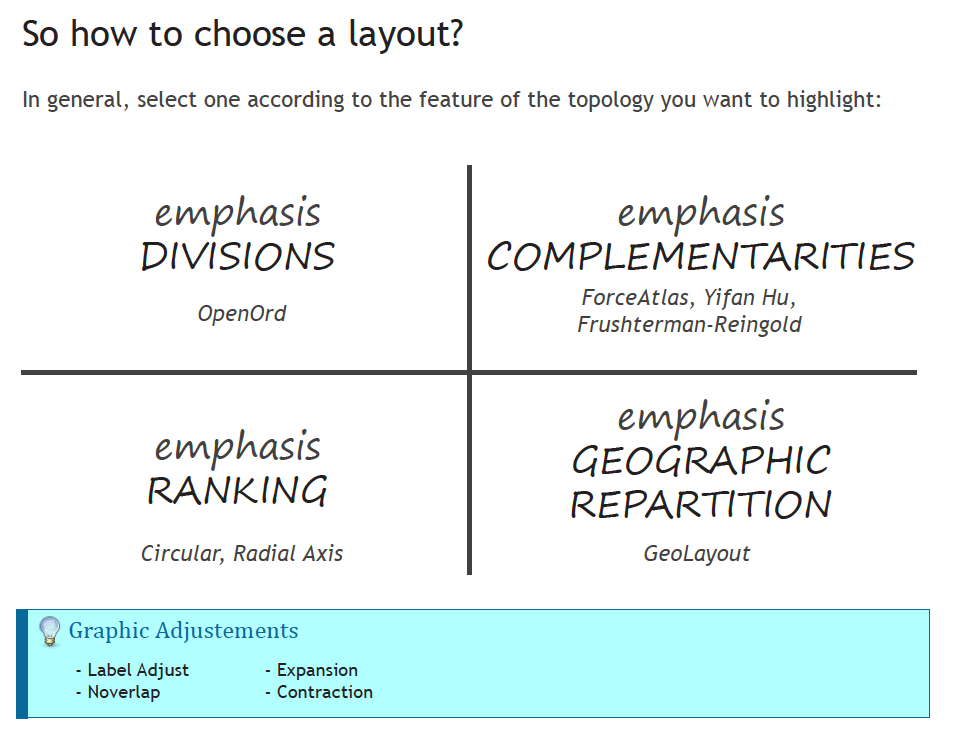
Let's try some layouts!
Layout/укладка

Advanced part
Statistics
(and how to vizualize it)
Statistics
- Window -> Context (Окно -> Контекст)
- Number of nodes and edges
-
Window -> Statistics (Окно -> Статистика)
- Click 'Run' to calculate metrics
Now let's see who has the highest degree!
Go to Data Laboratory
Vizualizing statistics
- Appearance
- Size
- Attribute
- Degree
- Attribute
- Size

Filtering
- Windows -> Filters
- Attributes
- Degree (or other attribute of your choice)
- Equal (for exact values)
- Range
- Degree (or other attribute of your choice)
- Attributes
Clustering

Clustering in Gephi
- Louvain algorithm (Blondel et al, 2008)
- The value to be optimized is modularity
- modularity measures the density of links inside communities compared to links between communities.
Formal definition

Intuition behind it
Modularity parameter
- >1 to get less clusters
- <1 (e.g. 0,5) to get more clusters
Let us try and cluster Hamlet now
Bonus: directed Hamlet graph
for those who want to try it:
Dynamic graphs
- Can be processed in Gephi
- Feel free to explore at your own risk
Title Text

Assignment for next week
Choose one:
- Encode drama using 'Simple formalization'
- Bring some data (CSV or Graph formats). Some sources:
- https://github.com/gephi/gephi/wiki/Datasets
- http://snap.stanford.edu/data/
- or whatever you find. Remember you can convert XLS(X) table to CSV using (Open/Libre)Office or Excel
Gephi 22 may
By danilsko


