Detecting Memory Leaks in Node.js
Dara Hayes
dara.hayes@redhat.com
@darahayess
@darahayes


That's me!

Let's talk about V8
Resident Set
Code
Stack
Pointers, Primitive types
Heap
Objects, Strings, Closures
Used Heap
V8 Memory Scheme
process.memoryUsage()

{
  rss: 21561344,
  heapTotal: 10522624,
  heapUsed: 4110504
}
Garbage Collection
Heap
Young Space (1-8MB)
Young Space and Old Space in V8 Heap
Old Space
New allocations
Scavenge Garbage Collection
More Frequent, Much Faster GCs
Objects that Survived 2 GCs in Young Space
Mark-Sweep Collection
Less Frequent, Pauses All JS Execution
Scavenge GC
- Occurs in young space.
- Cheney's Algorithm
- Frequent and fast.
Mark-Sweep GC
- Occurs in old space
- Mark, Sweep, Compact
- Less frequent, pauses all JS execution (generally)
node --trace-gc index.js
Let's find a memory leak
aka demo time :)
const http = require('http')

const server = http.createServer((req, res) => {
 for (var i=0; i<1000; i++) {
   server.on('request', function leakyfunc() {})
 }

 res.end('Hello World\n')
}).listen(1337, '127.0.0.1')

server.setMaxListeners(0)
1. Create heap dumps at different time intervals
2. Compare the dumps to see growth areas
It's so Simple!
Tools We Can Use
const memwatch = require('memwatch-next')

memwatch.on('leak', function (info) {
  console.log('Memory leak detected:\n', info)
})
‘A leak event will be emitted when your heap usage has increased for five consecutive garbage collections.’
A fork of the outdated memwatch module.
Last published 2 years ago but it works on Node 8.
--inspect
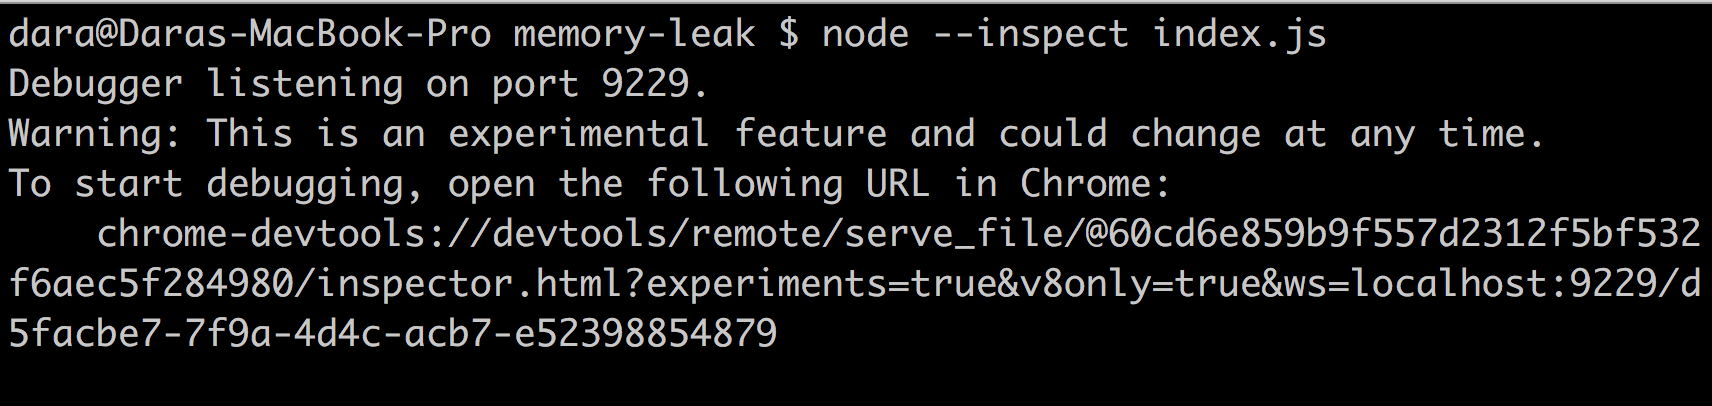
Debug your node process in Chrome dev tools
Create heap dumps
Only available in Node v6+
Otherwise use npm.im/node-inspector
const heapdump = require('heapdump')

heapdump.writeSnapshot((err, filename) => {
  if (err) console.error(err)
  else console.log('Wrote snapshot: ' + filename)
})Snapshots can be opened in dev tools.
Can be triggered by sending SIGUSR2 signal.
demo
Are there low level tools out there?
Take Core Dumps of Your Node Process
--abort-on-uncaught-exception
# Create a core dump when process crashes
gcore <pid>
# Low level tool to create dumps
Inspect Core Dumps with Low Level Debugging Tools
Things to Consider
-
Snapshots are expensive on CPU and Memory.
-
Try to find leaks in a test environment
-
If using something like memwatch in prod, make sure leaks are picked up by alerting tools
-
Consider other ways of tracking memory e.g. process.memoryUsage()
-
Beware of false positives
end ☕️
Notes
Detecting Memory Leaks in Node.js
By Dara Hayes
Detecting Memory Leaks in Node.js
This slide deck demonstrates approaches to finding memory leaks in Node.js. Topics covered include memory management and garbage collection in v8, and tooling used to find memory leaks.