Digital Media Analysis Using Information Fusion and Machine Learning
Dima Kagan
Advisor: Dr. Michael Fire


The online world
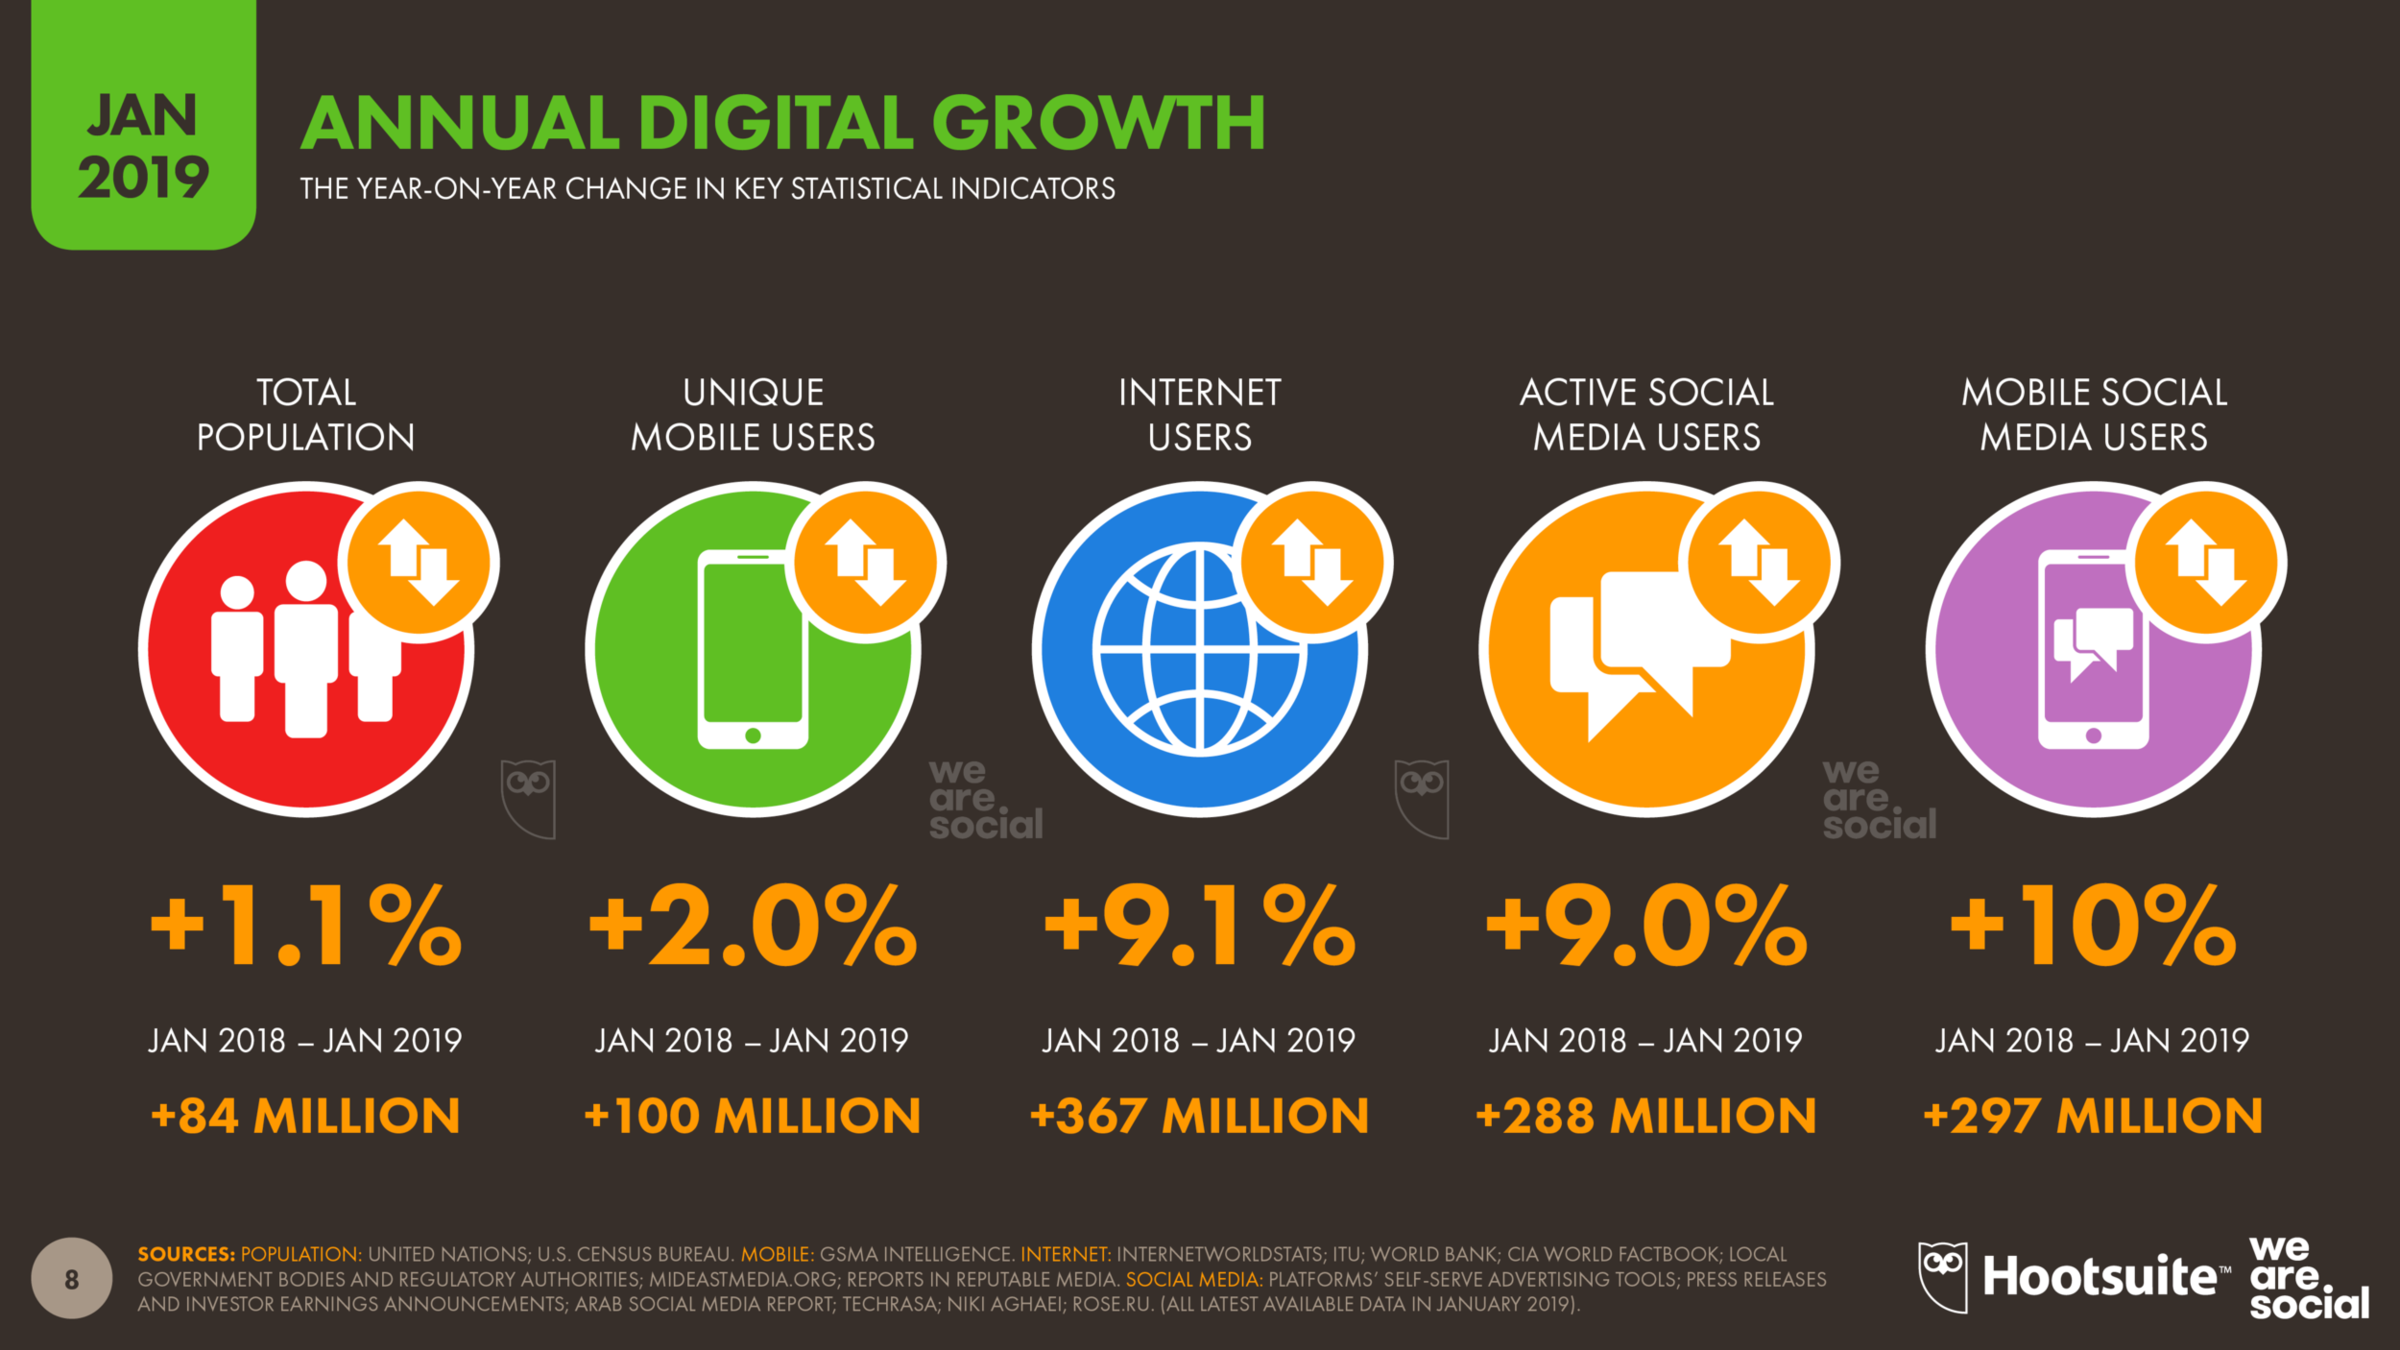
Kemp, S. (2019). Digital 2019: Global Internet Use Accelerates. Retrieved from wearesocial: https://wearesocial. com/blog/2019/01/digital-2019-global-internet-useaccelerates.
The Data
The Data
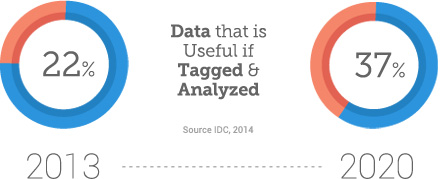
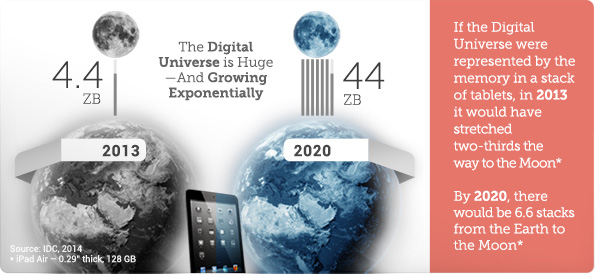
The data revolution
The Sloan Digital Sky Survey (SDSS) project revolutionized the field of astronomy:
- Constantly releasing terabytes of data.
- Generated over 3,000 papers.
- In total more than 160,000 citations.

Feigelson, E. D. and Babu, G. J. (2012). Big data in astronomy. Significance , 9(4):22– 25.
In 2009 the U.S government launched data.gov releasing more than 450,000 datasets over the next 3 years allowing many projects for improving citizen's lives:
- Predict future flight delays.
- Detecting vehicle models with major defects.
- Discovering relationships between parameters and chronic conditions.
- Raghupathi, W., & Raghupathi, V. (2018). An empirical study of chronic diseases in the United States: a visual analytics approach to public health. International journal of environmental research and public health, 15(3), 431.
- Mayer-Schonberger, V. and Cukier, K. (2013). Big data: A revolution that will transform how we live, work, and think. Eamon Dolan/Houghton Mifflin Harcourt, page 83.
- Das, S., Mudgal, A., Dutta, A., & Geedipally, S. R. (2018). Vehicle consumer complaint reports involving severe incidents: Mining large contingency tables. Transportation Research Record, 2672(32), 72-82.
Quantifying Reputation and Success in Art
Fraiberger et al. quantified reputation and success in art. They created an exhibition network of museums and galleries and used it to discover communities of institutions that exchange art. Additionally, they create a Markov model that can predict the evolution of an individual artist career.
Fraiberger, S. P., Sinatra, R., Resch, M., Riedl, C., & Barabási, A. L. (2018). Quantifying reputation and success in art. Science, 362(6416), 825-829.
Over-optimization of academic publishing metrics: observing Goodhart’s Law in action
Fire and Guestrin analyzed over 120 million papers to examine how the academic publishing world has evolved over the last century.
- They found that the number of publications has ceased to be a good metric as a result of longer author lists, shorter papers, and surging publication numbers. Citation-based metrics, such as citation number and h-index, are likewise affected by the flood of papers, self-citations, and lengthy reference lists.
Fire, M., & Guestrin, C. (2019). Over-optimization of academic publishing metrics: observing Goodhart’s Law in action. GigaScience, 8(6), giz053.

The General Method
Data Collection
- We collect data from various sources by a variety of techniques, for instance, crawling a public website.
The General Method
Data Collection
Dataset Creation
2. We clean and prepossess the raw data.
The General Method
Data Collection
Dataset Creation
NLP
3. We use NLP methods such as NER, word embedding, etc. to add additional dimensions to the dataset.
The General Method
Data Collection
Dataset Creation
NLP
Fusion With Additional Datasets
4. We fuse the collected datasets.
The General Method
Data Collection
Dataset Creation
NLP
Fusion With Additional Datasets
Temporal Analysis
SNA
Classifier Construction
5. We extract insights using temporal analysis, social network analysis, and ML-based methods.
The General Method
Data Collection
Dataset Creation
NLP
Fusion With Additional Datasets
Temporal Analysis
SNA
Classifier Construction
- We collect data from various sources by a variety of techniques, for instance, crawling a public website.
- We clean and prepossess the raw data.
- We use NLP methods such as NER, word embedding, etc. to add additional dimensions to the dataset.
- We fuse the collected datasets.
- We extract insights using temporal analysis, social network analysis, and ML-based methods.
USING DATA SCIENCE TO UNDERSTAND GENDER GAP IN THE FILM INDUSTRY
Dima Kagan, Thomas Chesney, and Michael Fire


- Titles: 5,487,394
- Full-Length Movies: 505,380
- Actor: 24,496,030
- Actress: 15,549,871
Movies Data
Data SCIENCE
Network Science

RELATED Work
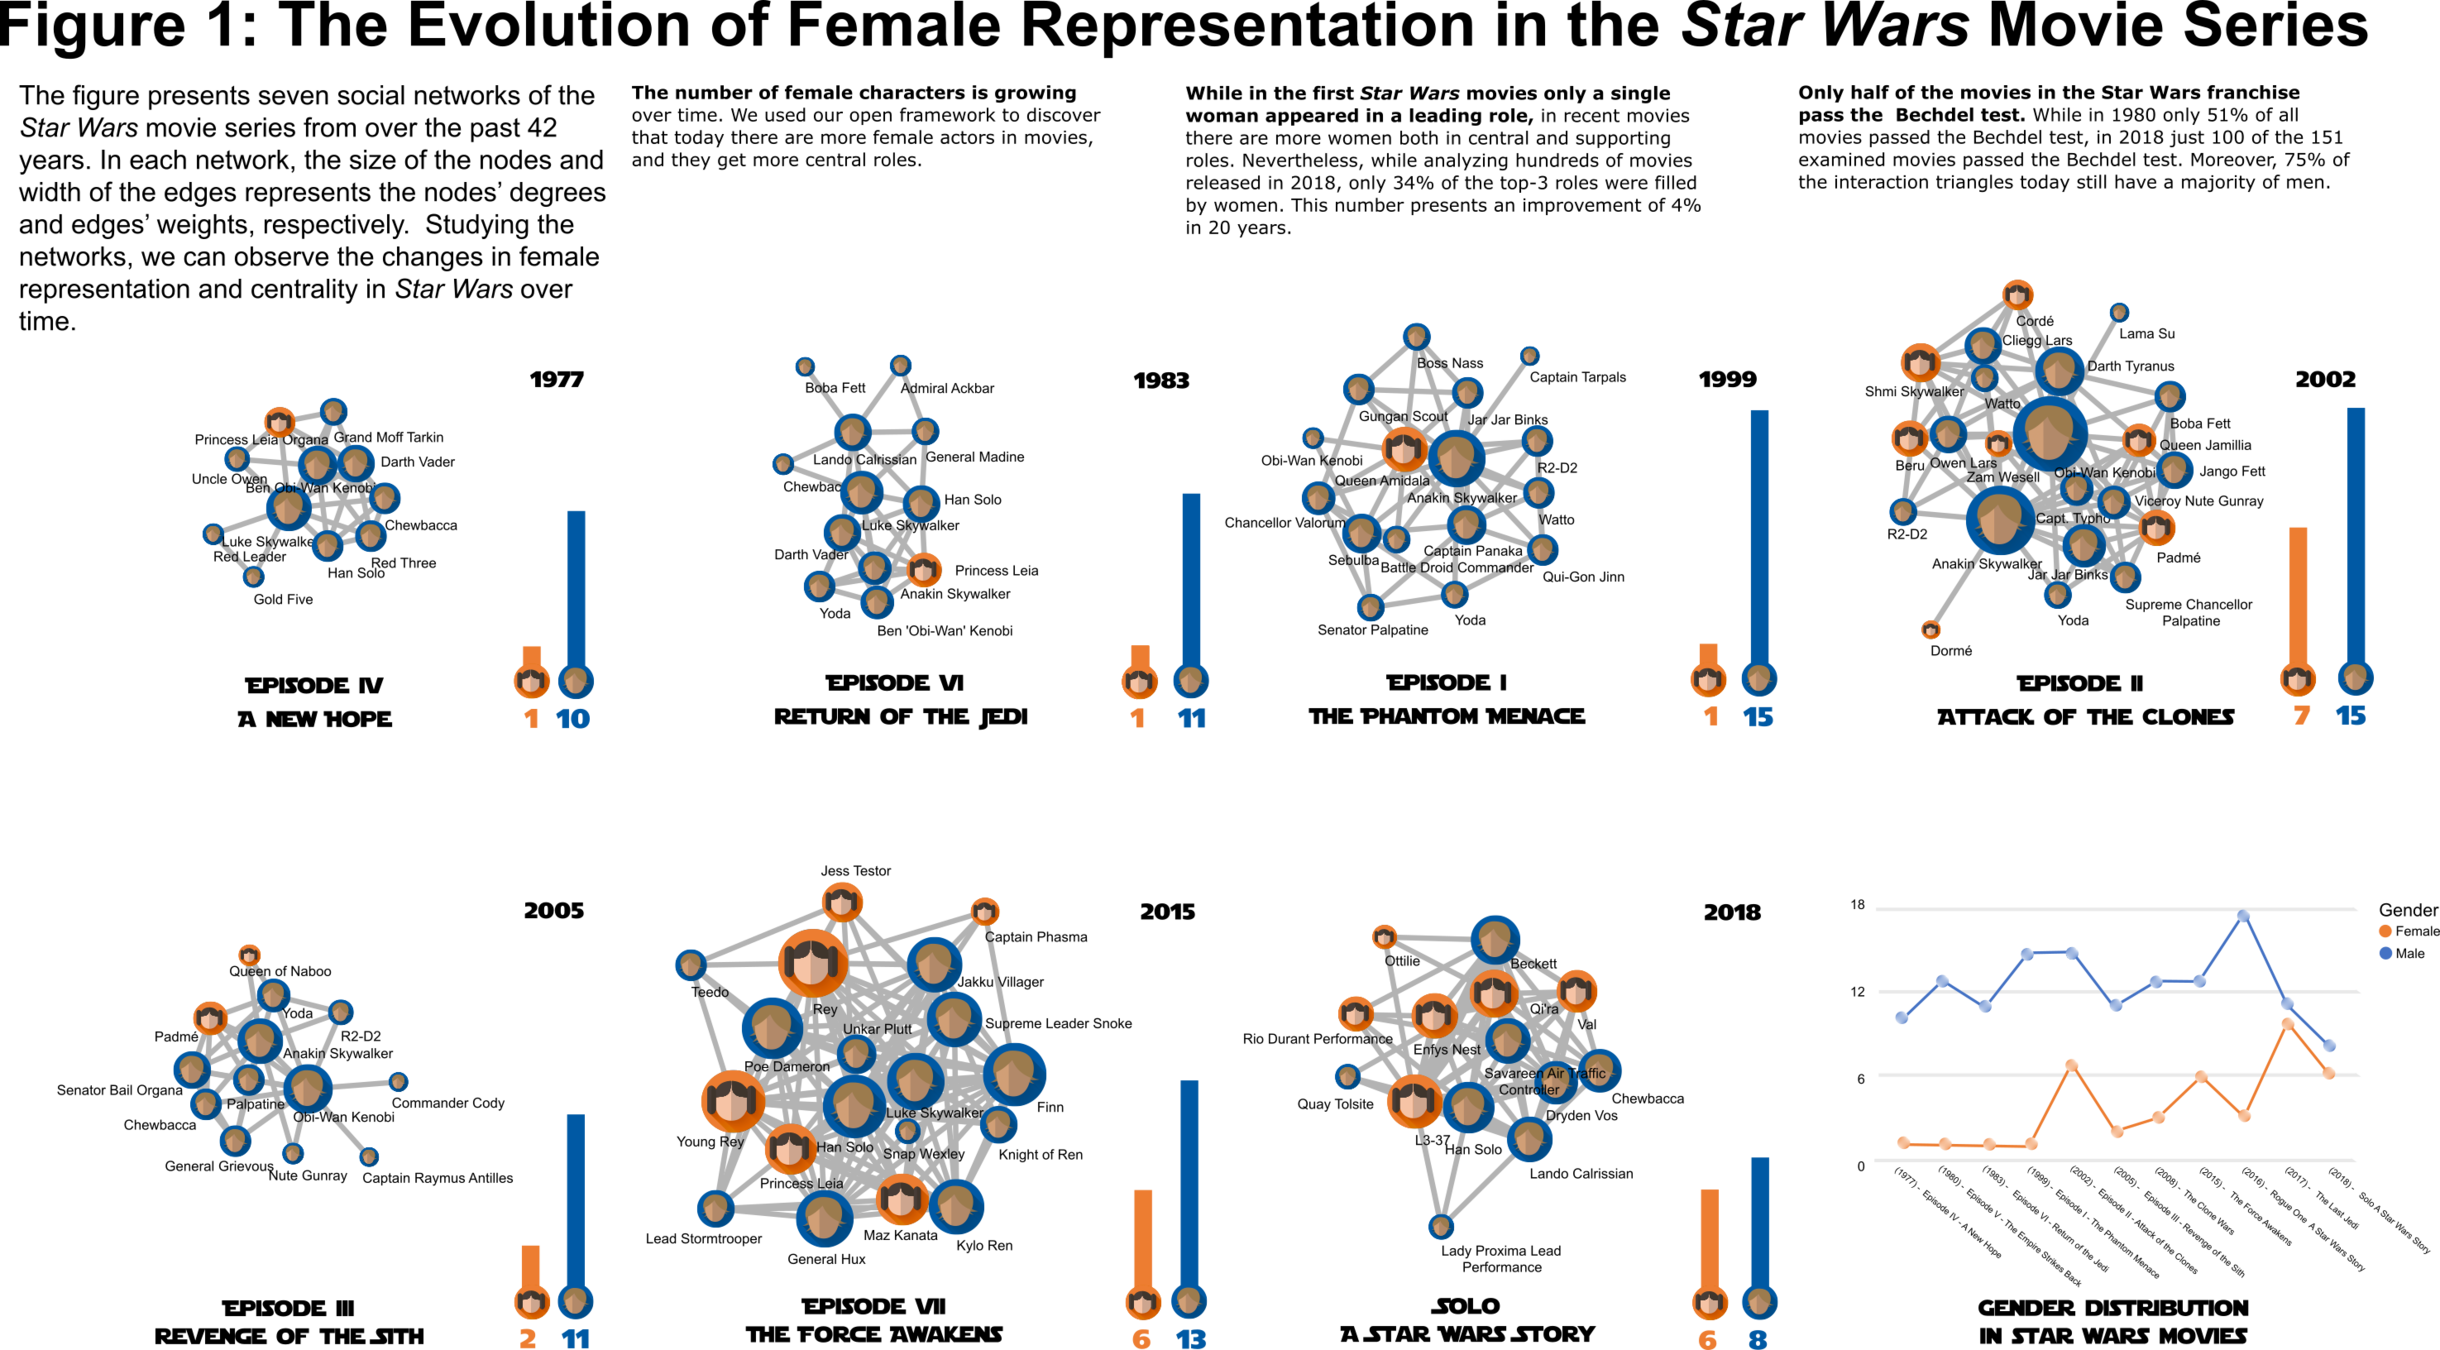
- Garcia et al. created social networks from online social networks discussions of movie trailers. They found that trailers of movies that are male-biased are more popular.
- Agrawal et al. studied the differences between movies that pass and fail the Bechdel test using social networks of screenplays. They created a classifier to automate the Bechdel test, which was trained on 367 movies and evaluated on 90. In the evaluation, they discovered that network-based features perform better than linguistic features.
- The Boxed In 2017-18 report observed a 2% decline in female major characters across all platforms, compared to the previous year.
- Garcia, D., Weber, I., & Garimella, V. R. K. (2014, May). Gender asymmetries in reality and fiction: The bechdel test of social media. In Eighth International AAAI Conference on Weblogs and Social Media.
- Agarwal, A., Zheng, J., Kamath, S., Balasubramanian, S., & Dey, S. A. (2015). Key female characters in film have more to talk about besides men: Automating the bechdel test. In Proceedings of the 2015 Conference of the North American Chapter of the Association for Computational Linguistics: Human Language Technologies (pp. 830-840).
- Lauzen, M. M. (2018). Boxed In 2017-18: Women On Screen and Behind the Scenes in Television. Center for the Study of Women in Television and Film, San Diego State University. .
Constructing Movie Social Networks


Constructing Movie Social Networks

Constructing Movie Social Networks
W=W+1
Challenges

Am I to understand you're still hanging
around with Dr. Emmett Brown, McFly?


Marty McFly
Lorraine McFly
George McFly


15,540
Subtitles
Cast Data
Cast Data
Subtitles Web Crawler
Subtitles Dataset
NER
Movie Social Networks Dataset
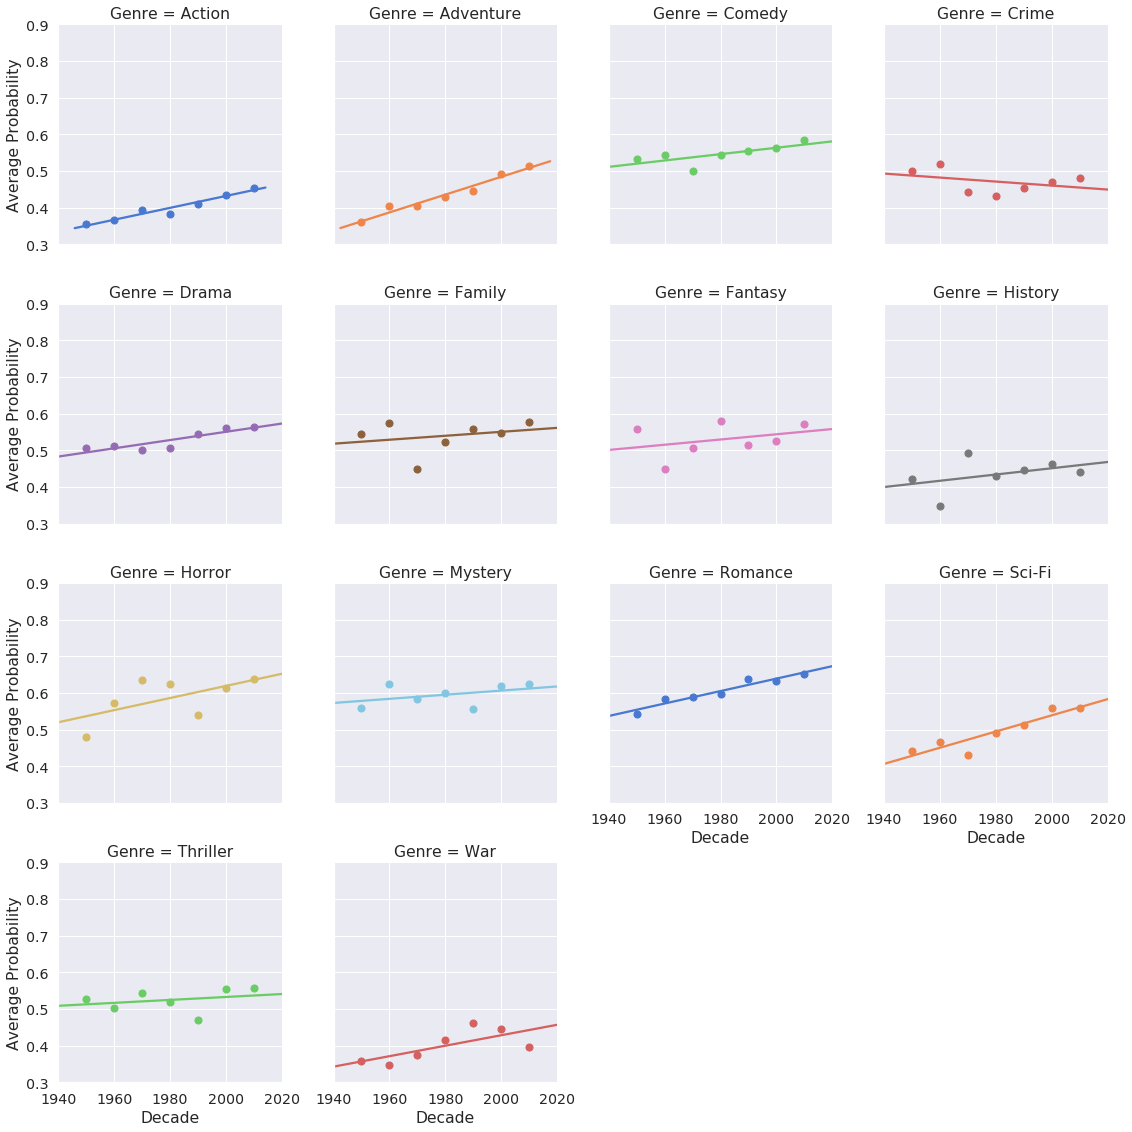
Temporal Analysis of Gender
Cast Extractor
Cast Dataset
Summary

THE SCULLY EFFECT
- Nearly two-thirds (63%) of women who are familiar with Dana Scully say she increased their belief in the importance of STEM.
- Among women who are familiar with Scully’s character, half (50%) say Scully increased their interest in STEM.
- Entertainment media is influential in shaping life choices
THE SCULLY EFFECT: I WANT TO BELIEVE IN STEM Research by 21st Century Fox, Geena Davis Institute on Gender in Media, and J. Walter Thompson Intelligence

What can we do about it?
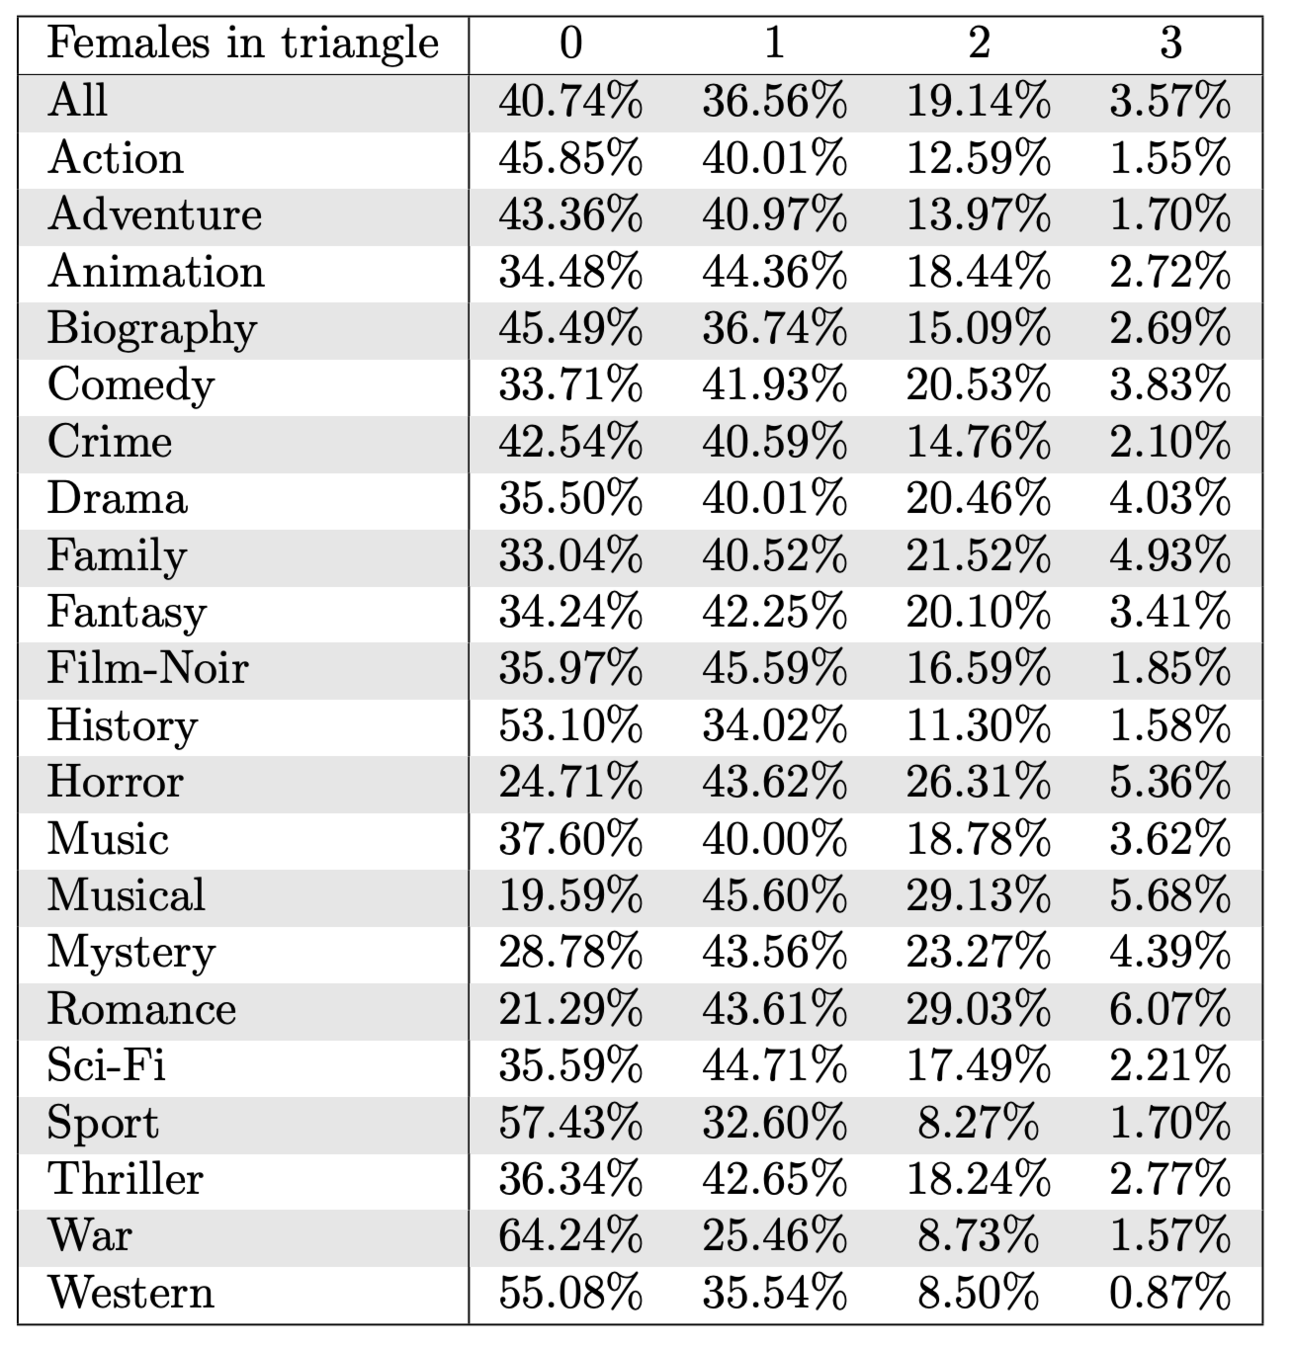
Relationship triangles
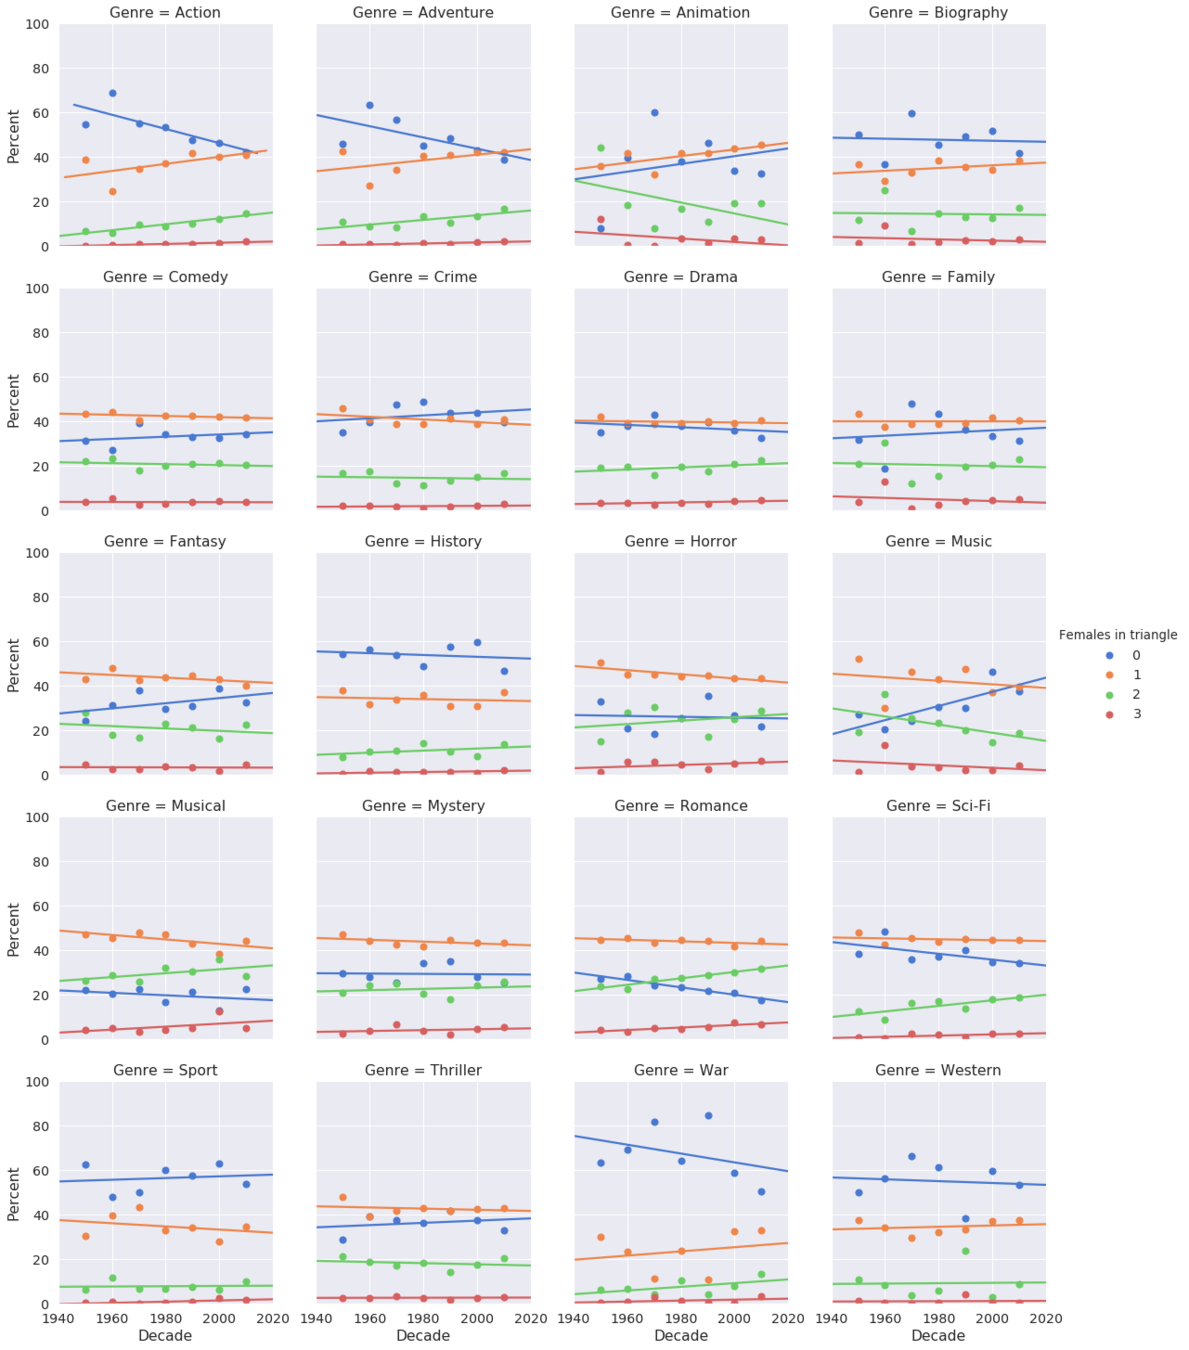
Change in Relationship triangles over time
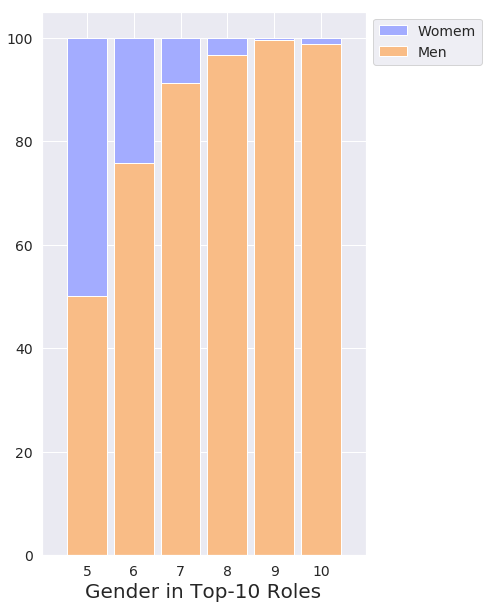
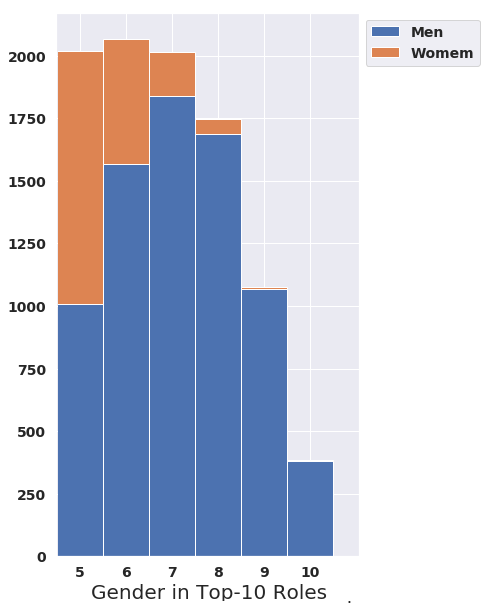
Top-10 Roles Distribution
BECHDEL TEST
- The movie has to have at least two women in it,
- who talk to each other,
- about something besides a man.

15,540
7,322
Subtitles
Cast Data
Cast Data
Features
Network Features

Vertex Feature
Gender Representation
Movie Feature
Actor Features


Bechdel Test Classifier
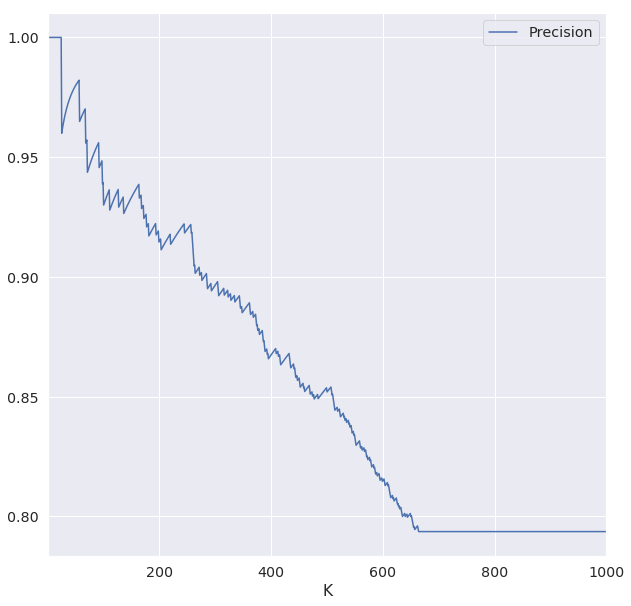
| Feature | Feature Importance |
|---|---|
| Percent of Triangles of 2 Women | 0.15797 |
| Percent of Triangles of 0 Women | 0.14502 |
| Females in Top 10 Roles | 0.13659 |
| Percent of Triangles of 3 Women | 0.12058 |
| Triangles of 3 Women | 0.0743 |
Bechdel Test Classifier
ALTERNATIVE TEST
0.8< \frac{TotalDegree_F}{TotalDegree_M} <1.2
- It is easy to pass the Bechdel-Test.
- We found that 55.8% of movies the total degree of male characters is at least twice as high as female characters.
-
A good test could be:
-
Sadly today only 12% of all movies pass this test.
Presntions
NetSci 2019, Vermont, USA
ESUN 2019 Zurich Switzerland
Posters
MSDSE 2019 Santa FE, NM, USA
Journal Paper
Palgrave Communications - Major Revision

Using Data Science to Analyze Infectious Disease Trends
Dima kagan, Jacob-MORAN Gilad, Michael fire
Motivation
- In the past hundred years, the human population quadrupled and the word became more connected than ever before.

- 9,728 1,270,406
- The potential for disease spread is immense.


Brockmann, D., & Helbing, D. (2013). The hidden geometry of complex, network-driven contagion phenomena. science, 342(6164), 1337-1342.
Related work
- Carrion et al. presented ProMED an email service to identify unusual worldwide health events related to emerging and reemerging infectious diseases.
- Yu and Edberg presented GIDEON an interactive encyclopedia with information about outbreaks, diagnosis, symptoms of infectious diseases.
- Cowen et al. evaluated the ProMed dataset discovering that there are diseases that received more extensive coverage than others.
- Jones et al. discovered that the threat of emerging infectious diseases to global
health is increasing.
- M. Carrion and L. C. Madoff. Promed-mail: 22 years of digital surveillance of emerging infectious diseases. International health , 9(3):177–183, 2017.
- V. L. Yu and S. C. Edberg. Global infectious diseases and epidemiology network (gideon): a world wide web-based program for diagnosis and informatics in infectious diseases. Clinical infectious diseases , 40(1):123–126, 2005.
- P. Cowen, T. Garland, M. E. Hugh-Jones, A. Shimshony, S. Handysides, D. Kaye, L. C. Madoff, M. P. Pollack, and J. Woodall. Evaluation of promed-mail as an electronic early warning system for emerging animal diseases: 1996 to 2004. Journal of the American Veterinary Medical Association , 229(7):1090–1099, 2006
- K. E. Jones, N. G. Patel, M. A. Levy, A. Storeygard, D. Balk, J. L. Gittleman, and P. Daszak. Global trends in emerging infectious diseases. Nature, 451(7181):990, 2008
Research GOAL
To establish infectious disease trends analysis and utilize data science to discover new insights, on the relationships between the real-world occurrence of communicable diseases, such as influenza, malaria, and ebolavirus, and a wide range of temporal associations that have practical implications to public health and scientific research of infections. For instance:
- Which diseases are understudied?
- Which diseases are overstudied?

Infectious Disease Analysis
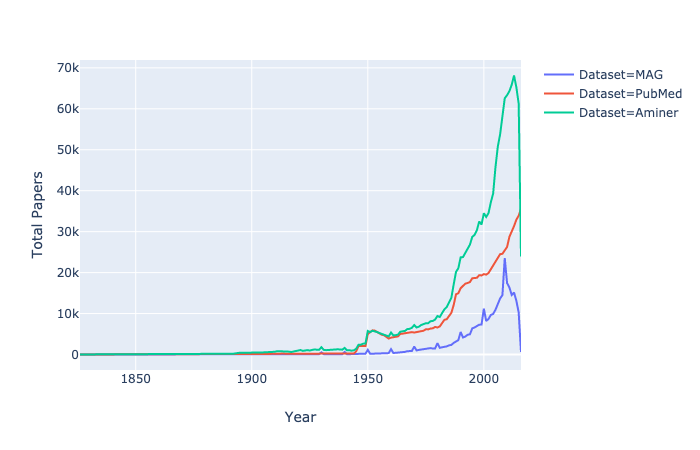
Datasets
- ProMED - is an online surveillance system for outbreaks of infectious diseases. The ProMED dataset was supplied directly from the ProMED team. The dataset contains the data of 27,972 alerts from 1995 up to 2019 that were labeled as incidents related to humans.
- PubMed -Academic publications on the topics of medicine, nursing, dentistry, veterinary medicine, health care systems, and preclinical sciences.
- Aminer Open Academic Graph - Aminer is an academic publication dataset that was generated from a combination of Microsoft Academic Graph (MAG) and AMiner.
- Microsoft Academic Graph - is a dataset containing “scientific publication records, citation relationships between those publications, as well as authors, institutions, journals, conferences, and fields of study”.
- Global Disease Burden - describes “mortality and morbidity from major diseases, injuries and risk factors to health at global, national, and regional levels”
- SJR - contains the information and ranking of academic journals.
Paper Trends
- Which diseases have a high death rate and understudied?
- Which diseases have a low death rate and studied intensively?
- Is there a time lag from a disease outbreak to an increase in research?
Paper Trends
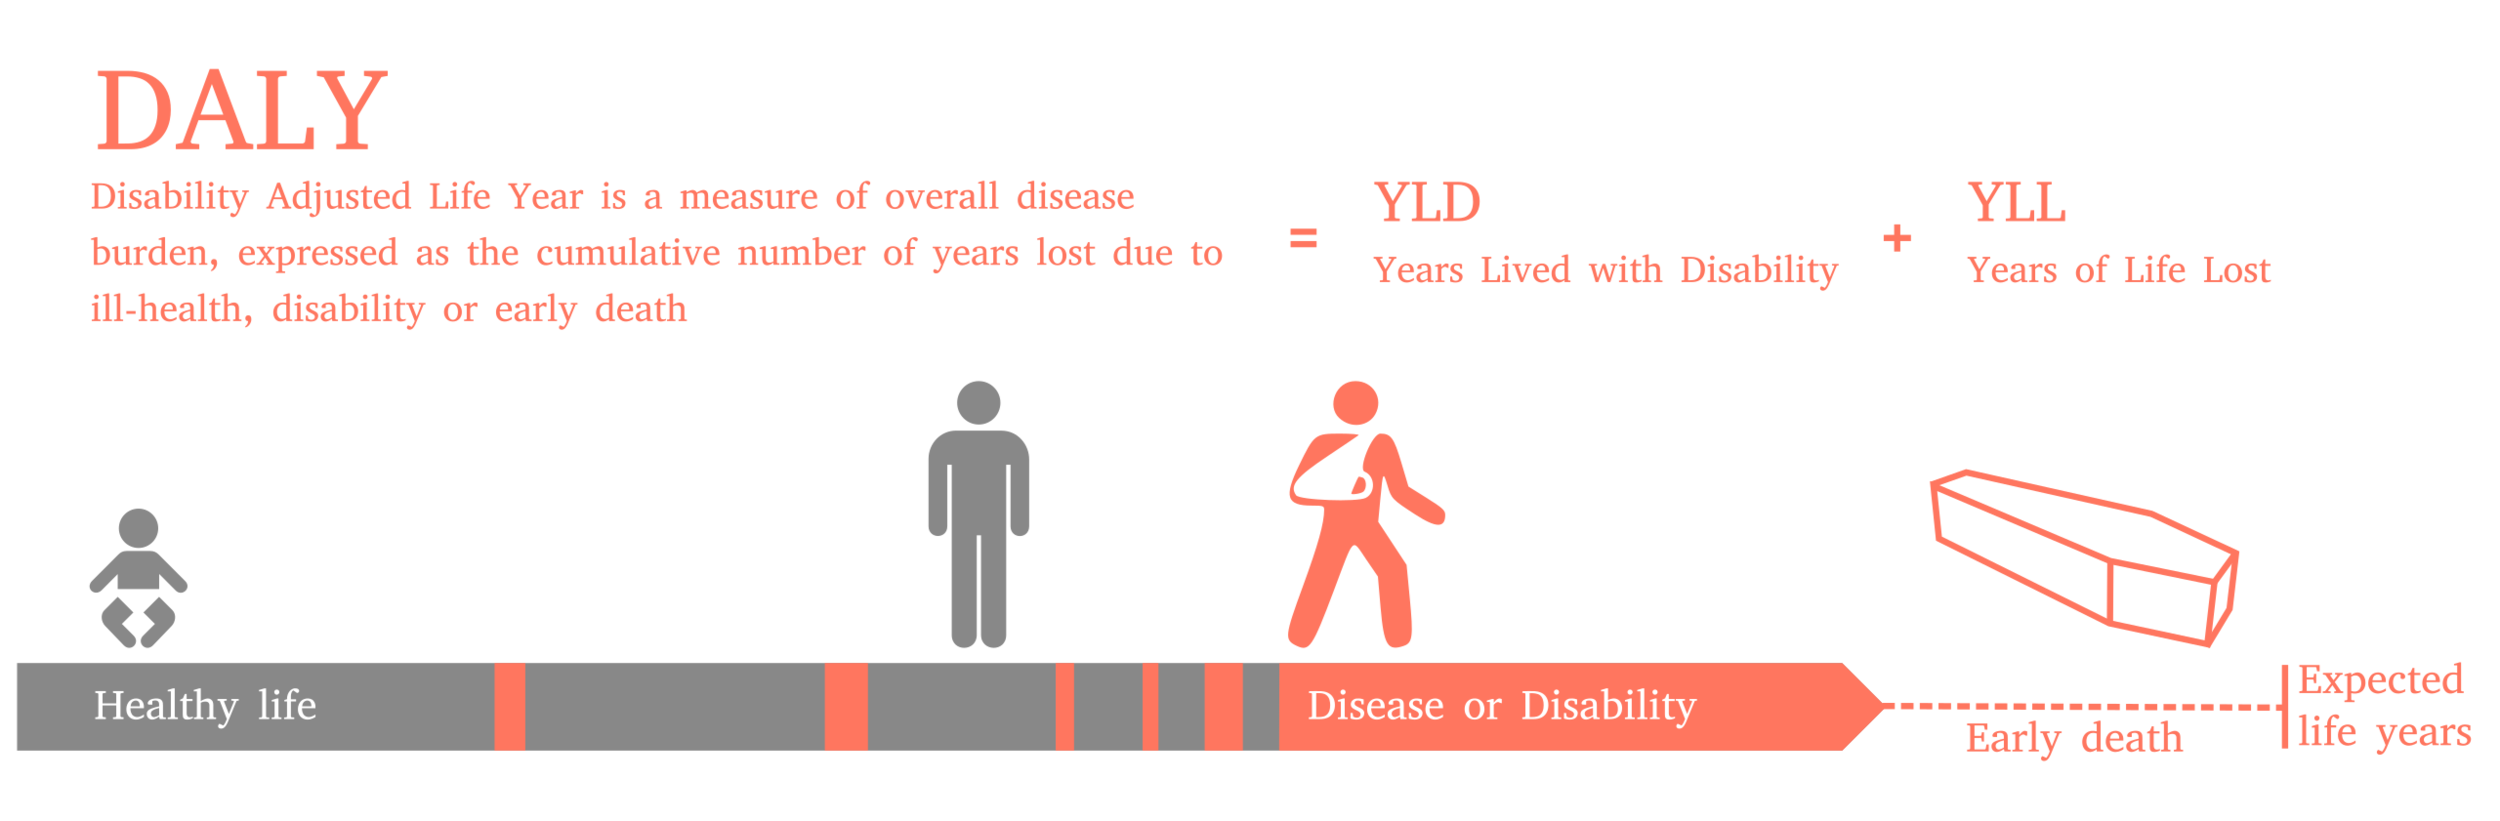
To diseases in the real-world vs the academia, we examined the correlation between the disease impact in the real-world and research rate in academia. To measure the impact we used the GDB dataset from we decided to use DALY (Disability-Adjusted Life Year).
PAPER TRENDS - Features
- Number of Citations - the total number of citations for a specific infectious disease (Aminer dataset).
- Number of Papers - the total number of published papers for a specific infectious (Pubmed dataset).
- Normalized Citation Rate (NCR) - the ratio between the Number of Citations on a specific infectious disease d to the total number of citations in epidemiology in year y.
-
Normalized Paper Rate (NPR) - the ratio between Number of Papers published on specific infectious disease d to the total number of papers in epidemiology in year y.
NCR_{y}(d) = \frac{\sum_{\{p \in Papers | Year=y, Disease=d\}} p.citaions}{\sum_{\{p \in Papers | Year=y\}} p.citaions}
NPR_{y}(d) = \frac{\sum_{\{p \in Papers | Year=y, Disease=d\}} p}{\sum_{\{p \in Papers | Year=y\}} p}
Journal trends- Popularity
Which venues are the most popular among infectious disease studies in terms of publications?
- Using Aminer dataset we explored which journals are the most popular in terms of the total and the average number of citations per journal.
Journal trends - Ranking
- Papers on which diseases are published in the top-10 journals? (SJR dataset).
-
Are there are papers about specific diseases that are published in lower-ranked journals and research about which diseases have a higher probability to be published in a prestigious journal?
-
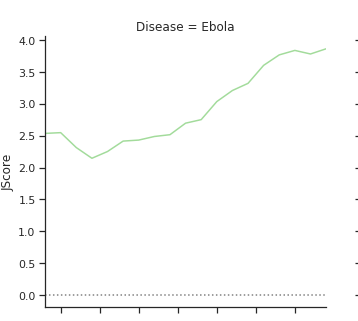
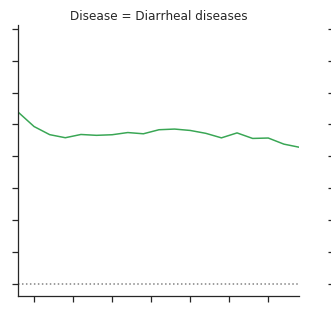
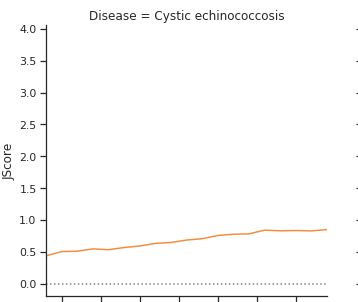
To this end, we defined a new metric JScore.
- We used JScore to see how overtime the JScore of each disease has changed.
-
To this end, we defined a new metric JScore.
JScore(T) = \frac{|\{SJR | p \in T\}|}{|{\{p \in T\}}|}
Collaboration trends
To study how scientific collaboration changed in the domain of infectious disease, we explored two perspectives:
- Is today more researchers working on each paper than in the past? and are some diseases require more researchers to study?
- To this end, we used PubMed dataset to model the average number of authors for each disease over time.
Collaboration trends
To study how scientific collaboration changed in the domain of infectious disease, we explored two perspectives:
Using the extracted country data we explored how international collaborations change over time in different infectious diseases.
2. What is the state international collaborations in epidemiology?
- To determine the country of each author we applied two steeped process:
- We matched the institutions in the MAG dataset to the SJR dataset which has a country field for each institution.
- To detect the countries of the institutions that we were not able to match we used NER to extract country data from raw affiliations.
ProMED Crawler
ProMED Raw Reports
NER
ProMED Dataset
Temporal Analysis of Infectious Diseases Research
Academic Publications Dataset Downloader
Academic Publications Raw Dataset
Summary
Academic Publications Preprocessing
Academic Publications Dataset
Infectious Diseases Research Social Network
ProMED Crawler
ProMED Raw Reports
NER
ProMED Dataset
Temporal Analysis of Infectious Diseases Research
Academic Publications Dataset Downloader
Academic Publications Raw Dataset
Summary
Academic Publications Preprocessing
Academic Publications Dataset
Infectious Diseases Research Social Network
GDB Dataset
Temporal Analysis of Infectious Diseases Research
ProMED Official Dataset
Temporal Analysis of Infectious Diseases Research
Academic Publications Dataset Downloader
Academic Publications Raw Dataset
Summary
Academic Publications Preprocessing
Academic Publications Dataset
Infectious Diseases Research Social Network
GDB Dataset
Temporal Analysis of Infectious Diseases Research
Academic Publications Dataset Downloader
Academic Publications Raw Dataset
Summary
Academic Publications Preprocessing
Academic Publications Dataset
Infectious Diseases Research Social Network
GDB Dataset
Temporal Analysis of Infectious Diseases Research
Results
- In recent years there was a surge in publications in epidemiology, almost 70,000 new papers a year.
- These results are very similar to surge in scientific publications presented by Fire and Gustrin.
Results - Paper Trends
Performing the analysis we discovered that many diseases that have a high negative or positive correlation between NPR and DALY.
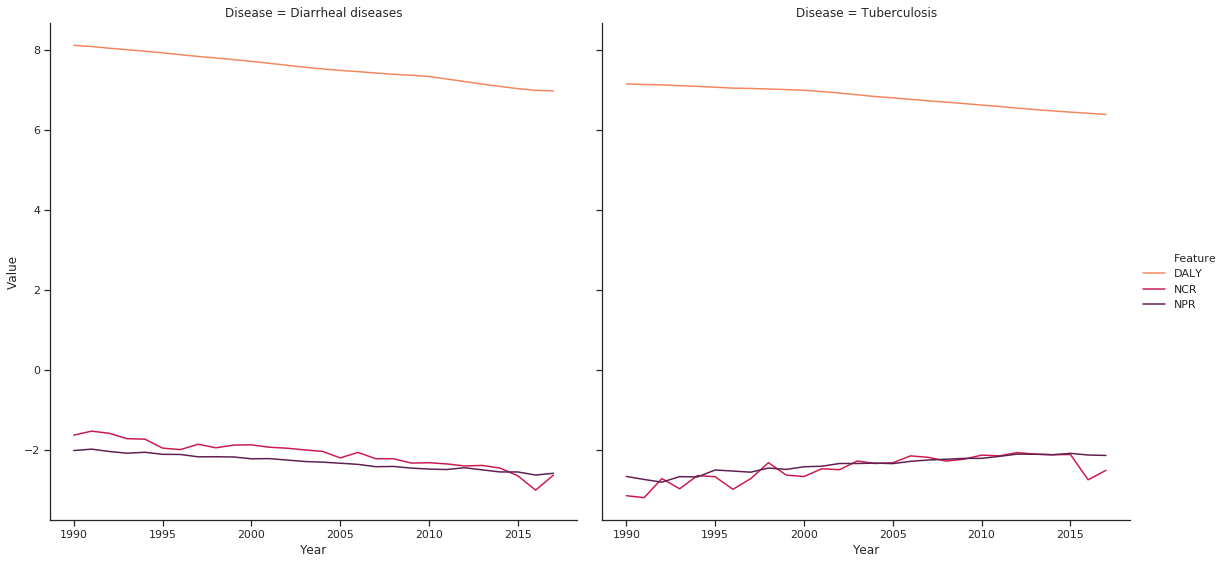
Results - Paper Trends
- There are only 14 out of 38 diseases that have a positive correlation between the DALY and Number of Papers but when looking at the correlation between DALY and NPR there are 19 out of 38 diseases that have a positive correlation.
- From the citations point of view, there are 24 and 23 out of 38 diseases that have a positive correlation between the DALY and Number of Citations and DALY and NCR respectively.
- From a paper perspective for most of the diseases, the highest correlation was without a time shift but from citation perspective about half of the diseases had their maximal correlation at time shift 0.
Results - Paper Trends
- We inspected in which diseases there are more publications and citations.
- HIV is the disease that has the highest number of publications more than twice than Hepatitis which is the second-highest.
- In terms of citations, Trichuriasis has the highest number of average citations.
| Disease | Paper Count | Number of Citations | Average Number of Citations |
|---|---|---|---|
| Trichuriasis | 262 | 2377 | 9.14 |
| Hepatitis | 176778 | 1471180 | 8.45 |
| Hiv | 475188 | 3418330 | 7.26 |
Results - JOURNAL Publications
| Title | Count |
|---|---|
| PLoS ONE | 11620 |
| AIDS | 7560 |
| Journal of Acquired Immune Deficiency Syndromes | 5247 |
| Journal of Infectious Diseases | 5199 |
| Clinical Infectious Diseases | 4946 |
| International Journal of Tuberculosis and Lung Disease | 3933 |
| Journal of Clinical Microbiology | 3781 |
| Journal of Biological Chemistry | 3471 |
| Infection and Immunity | 3199 |
| American Journal of Tropical Medicine and Hygiene | 3112 |
Results - JOURNAL Citations
| Venue | Number of Citations | Average Number of Citations | Paper Count |
|---|---|---|---|
| Nature | 241599 | 42.3412 | 5706 |
| Journal of Virology | 224641 | 21.9226 | 10247 |
| Journal of bacteriology | 157365 | 11.3711 | 13839 |
| PloS one | 153125 | 14.4854 | 10571 |
| Infection and Immunity | 132717 | 15.6303 | 8491 |
| Molecular Microbiology | 109604 | 23.9991 | 4567 |
| Journal of clinical microbiology | 103397 | 13.4948 | 7662 |
| Aids | 98770 | 18.5693 | 5319 |
| New England Journal of Medicine | 76792 | 45.1984 | 1699 |
| Antimicrobial agents and chemotherapy | 72570 | 13.6052 | 5334 |
Results - JOURNAL Citations
| Venue | Number of Citations | Average Number of Citations | Paper Count |
|---|---|---|---|
| Molecular systems biology | 10647 | 217.286 | 49 |
| Cellular and molecular biology | 2967 | 123.625 | 24 |
| Nature genetics | 26946 | 115.154 | 234 |
| Embo Journal | 11941 | 108.555 | 110 |
| Annual Review of Immunology | 6381 | 106.35 | 60 |
| Genome research | 8524 | 100.282 | 85 |
| PLoS biology | 10943 | 95.1565 | 115 |
| Clinical microbiology reviews | 16308 | 79.5512 | 205 |
| Journal of health and social behavior | 2424 | 78.1935 | 31 |
| Journal of nanobiotechnology | 1792 | 77.913 | 23 |
Results - Top-10 ranked journals
- At 2017:
- Only about 30 out of the 38 infectious diseases were published at least one paper in these journals.
- Published 322 HIV/Aids-related papers in these journals while the second-highest topic was about Tuberculosis with only 105 papers.
Results - JScore
- All diseases except for Diarrheal diseases there is a constant rise in JScore.
- Currently, papers about Ebola have the best chances to be published a high ranked journal while Cystic echinococcosis has the lowest.
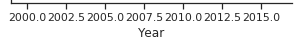
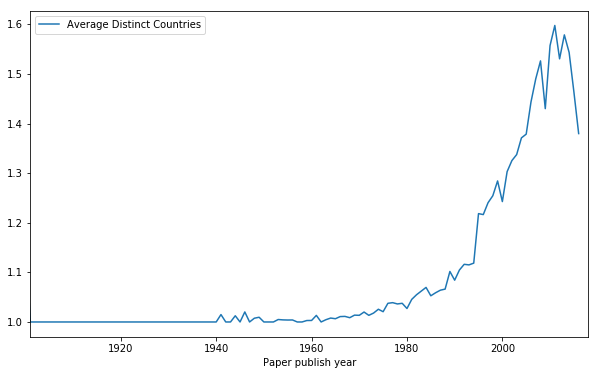
Results - COLLABORATION
- There is an increase in international collaborations.
- Malaria and Paratyphoid diseases have the highest and lowest average amount of international collaborations respectively.
| Disease | Average Distinct Countries |
|---|---|
| Malaria | 1.57219 |
| African Trypanosomiasis | 1.50467 |
| Leishmaniasis | 1.47862 |
| Hepatitis B | 1.46758 |
| Dengue | 1.45026 |
| Cystic Echinococcosis | 1.43223 |
| Hiv | 1.4315 |
| Zika Virus | 1.42857 |
| Chagas Disease | 1.42474 |
| Trachoma | 1.4108 |
| … | …. |
| Diphtheria | 1.24589 |
| Leprosy | 1.23681 |
| Pertussis | 1.22829 |
| Herpes Simplex | 1.20117 |
| Ascaris | 1.19054 |
| Escherichia Coli | 1.18061 |
| Trichuriasis | 1.14035 |
| Trichomoniasis | 1.13778 |
| Dracunculiasis | 1.12346 |
| Gonococcal | 1.1085 |
| Paratyphoid | 1.09846 |
Results - COLLABORATION
Future work
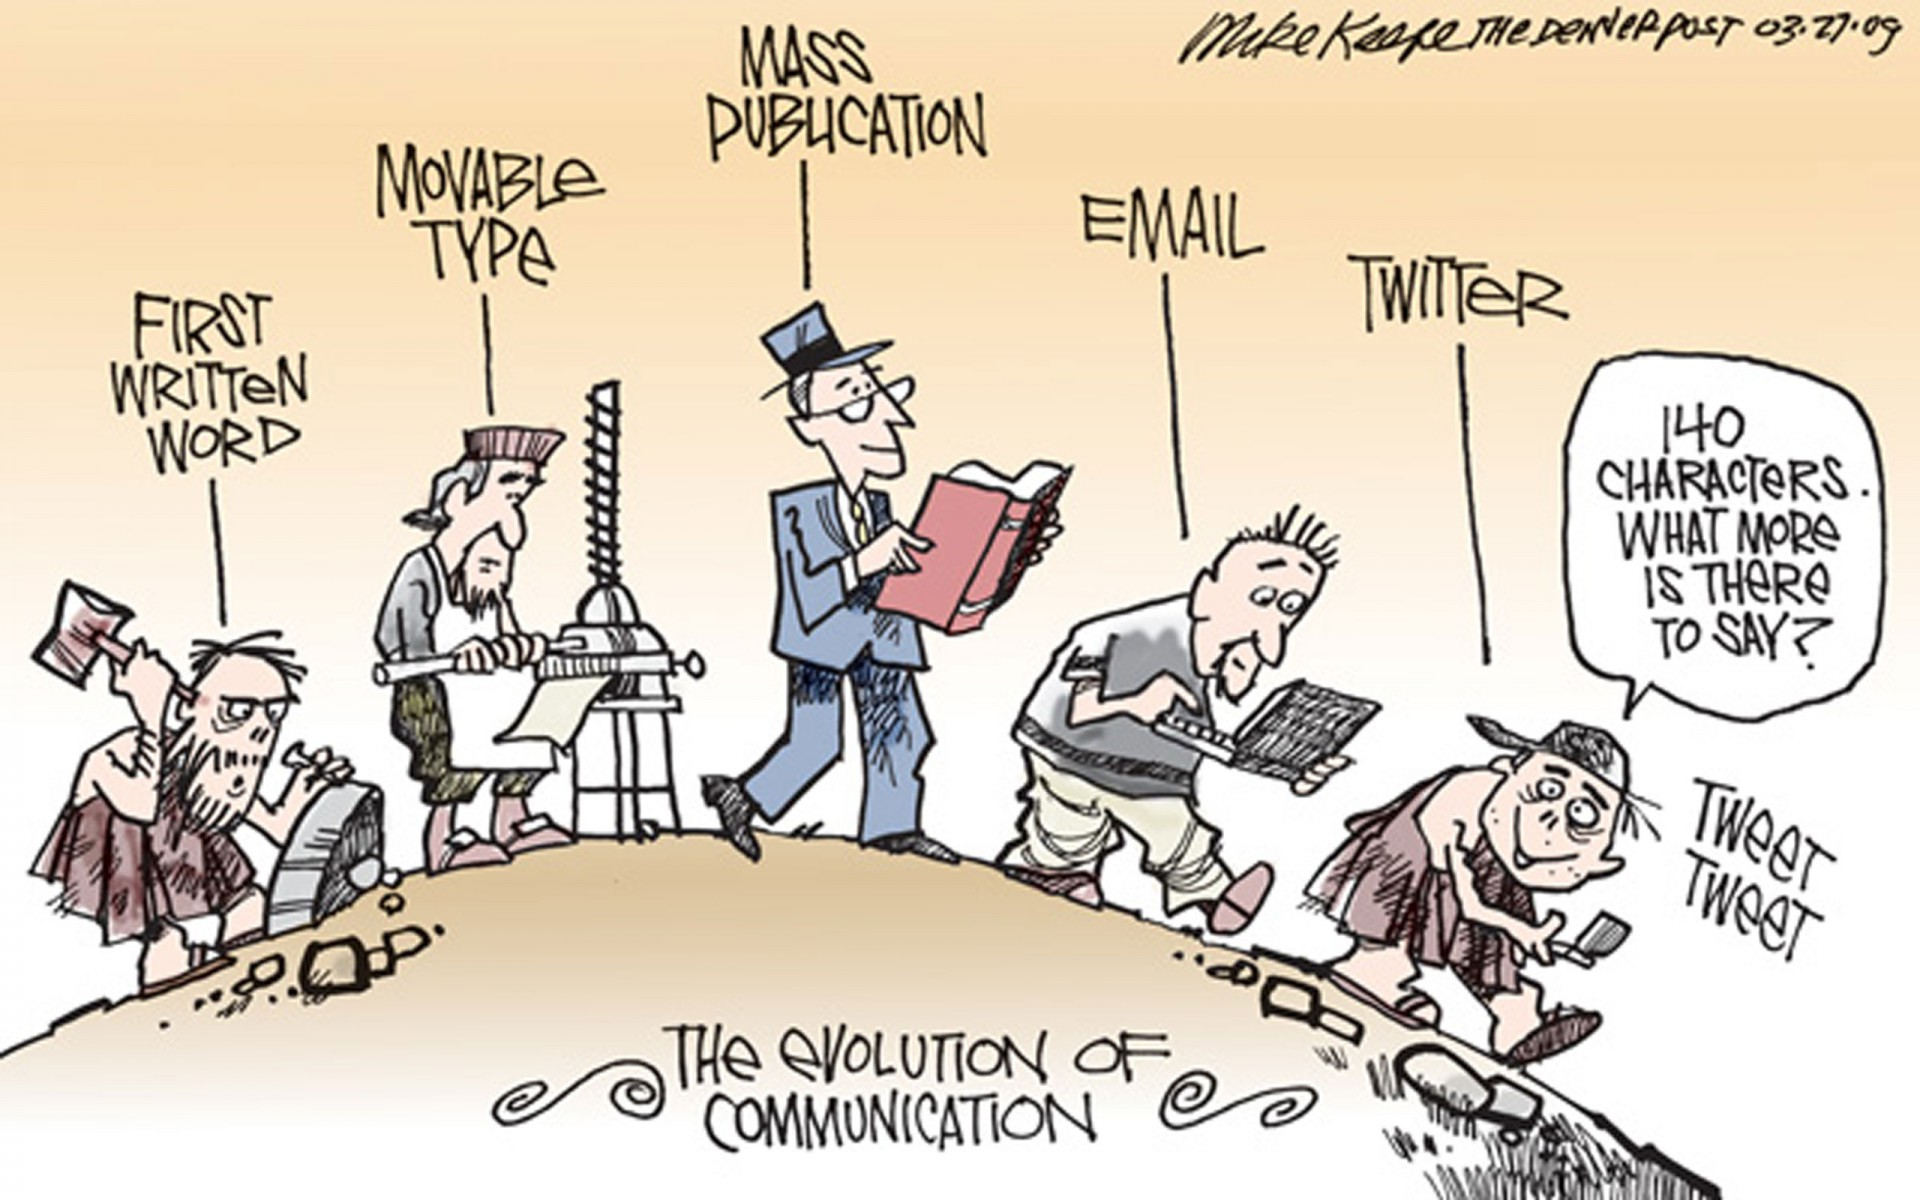
Representation of Real World Events in Memes


Related work
- Bauckhage investigated the temporal dynamics and infectious properties of 150 famous Internet memes, to create a time series model based on Google Insights and Delicious data.
- Weng et al. studied memes diffusion in Twitter. They used an agent-based model to examine how popular memes compete with fleeting attention spans.
- Drakett et al. analyzed 240 memes to study sexist humor.
Bauckhage, C. (2011, July). Insights into internet memes. In Fifth International AAAI Conference on Weblogs and Social Media.
Weng, L., Flammini, A., Vespignani, A., & Menczer, F. (2012). Competition among memes in a world with limited attention. Scientific reports, 2, 335.
Drakett, J., Rickett, B., Day, K., & Milnes, K. (2018). Old jokes, new media–Online sexism and constructions of gender in Internet memes. Feminism & Psychology, 28(1), 109-127.

Proposed study
- We believe that the study of the meme's life cycle can present many insights about millennial's opinions about real-world events.
- For instance, we can discover what millennials think about the gender gap problem, anti-vexation movement, U.S elections, etc.

Data collection
- Collect memes and metadata from multiple sources for instance: Reddit, 9gag
- Use existing datasets:
- Meme Generator - Data Set 86,310 total memes harvested from Meme Generator
- Reddit Memes Dataset - 3,164 memes
- 96 million memes from Memetracker - textual data form 2008-2009.
- Collecting data on real-life events.

Data extraction
- Extract text from Memes using OCR
- Extract visual data using, object detection, segmentation, etc.
- Extract metadata from votes, comments, etc.

Analysis
- Visual similarity.
- Textual similarity.
- Clustering.
- Correlation to real-world events.
- Sentiments in the text and comments.

Diversity in the Film Industry
Mor Levy, Dima Kagan, THOMAS CHESNEY, Michael Fire
PROPOSED Research
- Utilization of deep learning to study diversity in the film industry analyzing:
- Films
- Posters
- Trailers

Thank you questions?


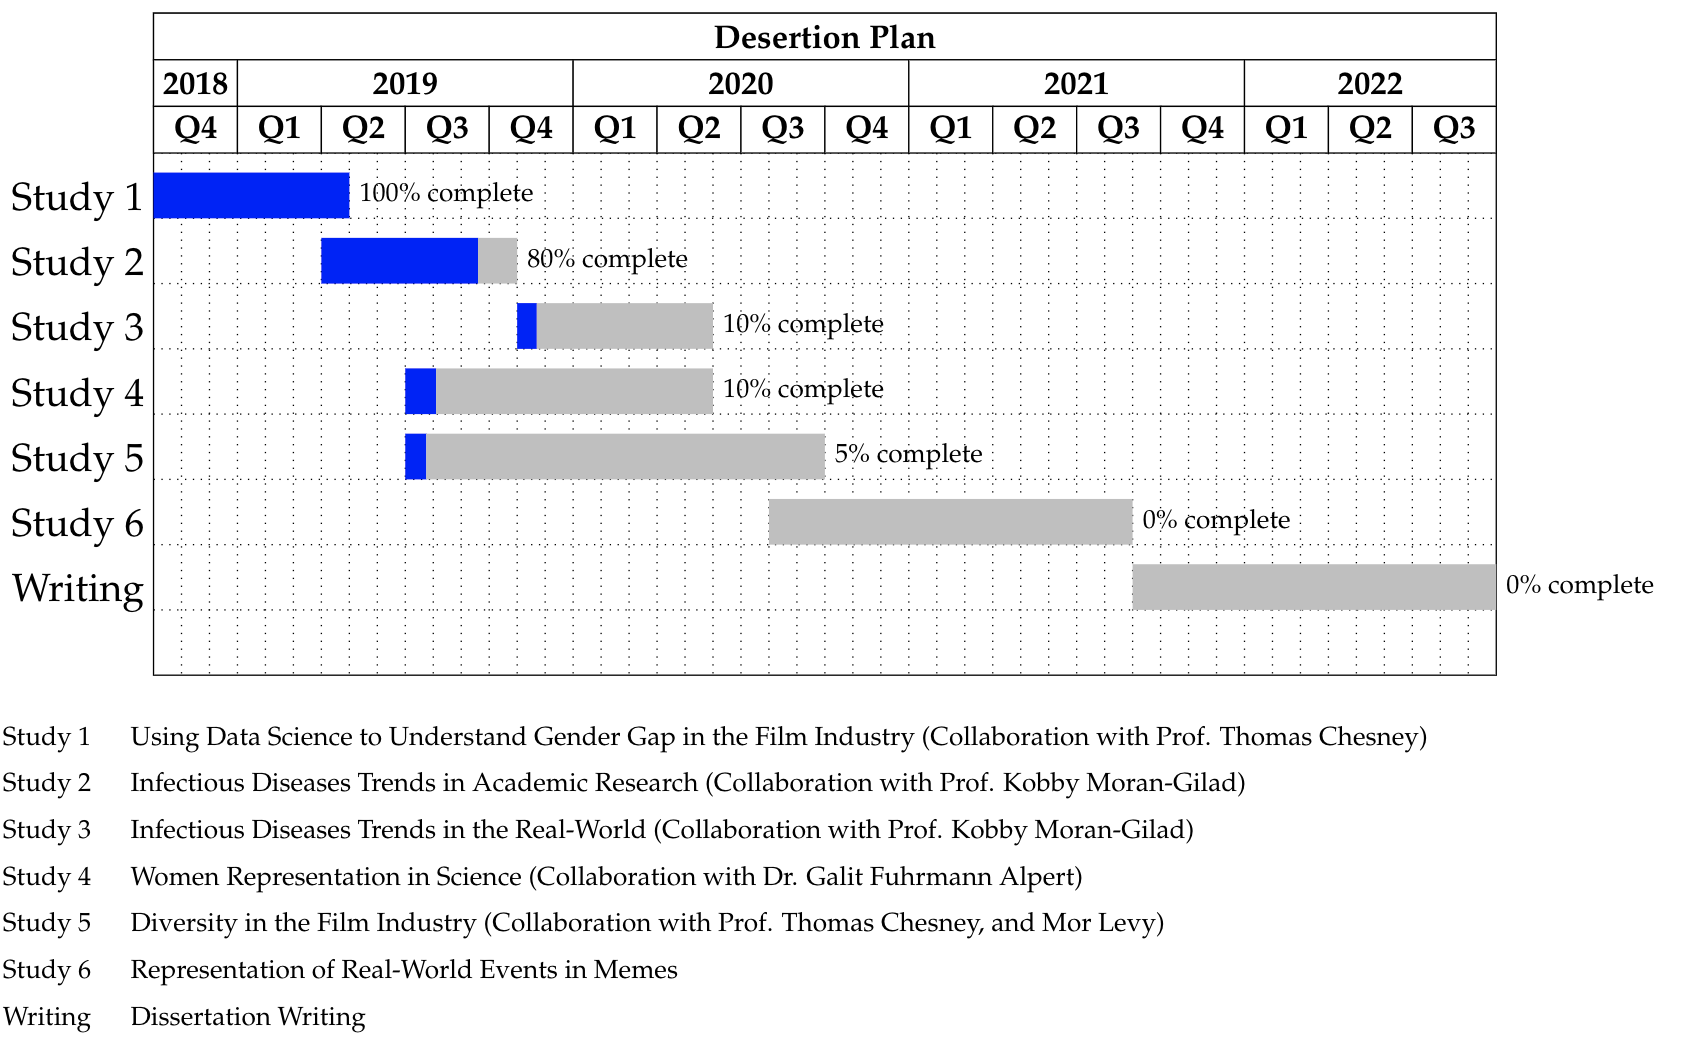
Research Proposal
By Dima Kagan


