Detecting the Behavioral Relationships of Malware Connections
Sebastian Garcia - CTU University, Prague
sebastian.garcia@agents.fel.cvut.cz
@eldracote
Live Slides: bit.ly/BotConf
The Network Detection Controversy
-
IoC are the best we have.
-
IoC are not enough, specially for new malware. Not to mention how malware evolves.
-
In the Net, payloads are usually not available.
-
Flows may be. But what can we do with them?
The Behavioral Proposal
-
Behavior is one way to go.
-
Look at the intentions.
-
Look at what happens in time. Harder to avoid.
-
But what should we use? Machine... learning...??
The Machine Learning Discussion
-
Is it working?
-
>> Amount of Data
-
<< Time
-
Validation/Results
-
Are humans not working?
Stratosphere IPS
Free
Software
Machine
Learning
Behavioral
IPS
Protecting
NGOs
Model the behavior of each connection
Stratosphere Project

Each flow has features that define its state.
Each state is assigned a letter.
The Upatre Proximity Controversy
The Graph Idealization
-
Given that the malware connections are generated by an algorithm, they are related. We hypothesize that the relationship can be modeled.
-
Our model produces a graph for each srcIP, where:
-
Each node is a tuple DstIP, DstPort, Proto.
-
The sequence of flows from one node to another in the network are the edges.
-
The Graph Idealization
-
Made by Daniel Šmolík, from the Stratosphere team
-
The more times an edge is found, the thicker it is.
-
The more times a node is repeated, the bigger it is.
-
The more times a node loops with it self, the color gets darker.
The Normality Behavior
The Other Normality Behavior
The Cerber Ransomware Contraption
The Simple Analytic Analysis
-
Number of nodes.
-
Number of edges.
-
Number of times a node loops with itself.
-
Number of times an edge is repeated.
-
The percentage of repeating edges from the total edges.
The Behavior of a Host
-
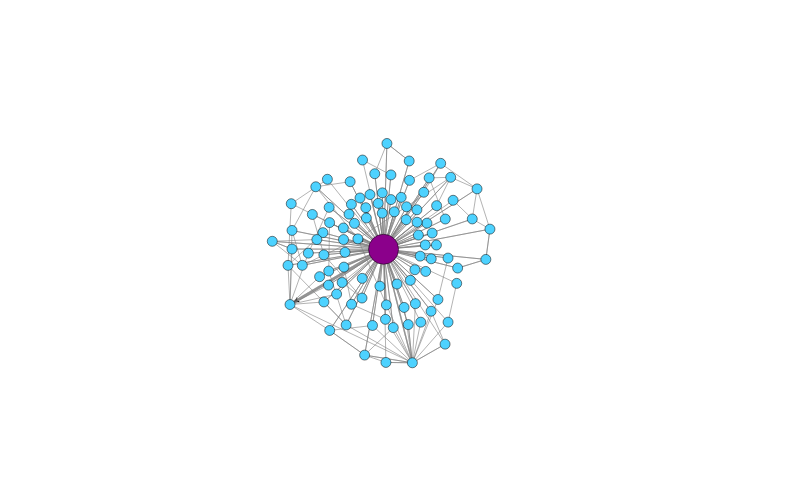
Cerber Ransomware
-
Nodes: 566, Edges: 702
-
Autolooping nodes: 20
-
Repeating edges: 590 (84%)
-
-
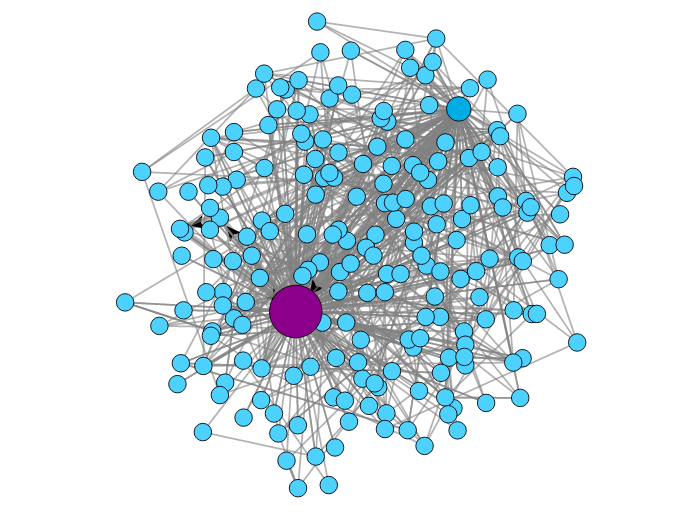
Normal I
-
Nodes: 98, Edges: 263
-
Autolooping nodes: 47
-
Repeating edges: 6 (2.2%)
-
-
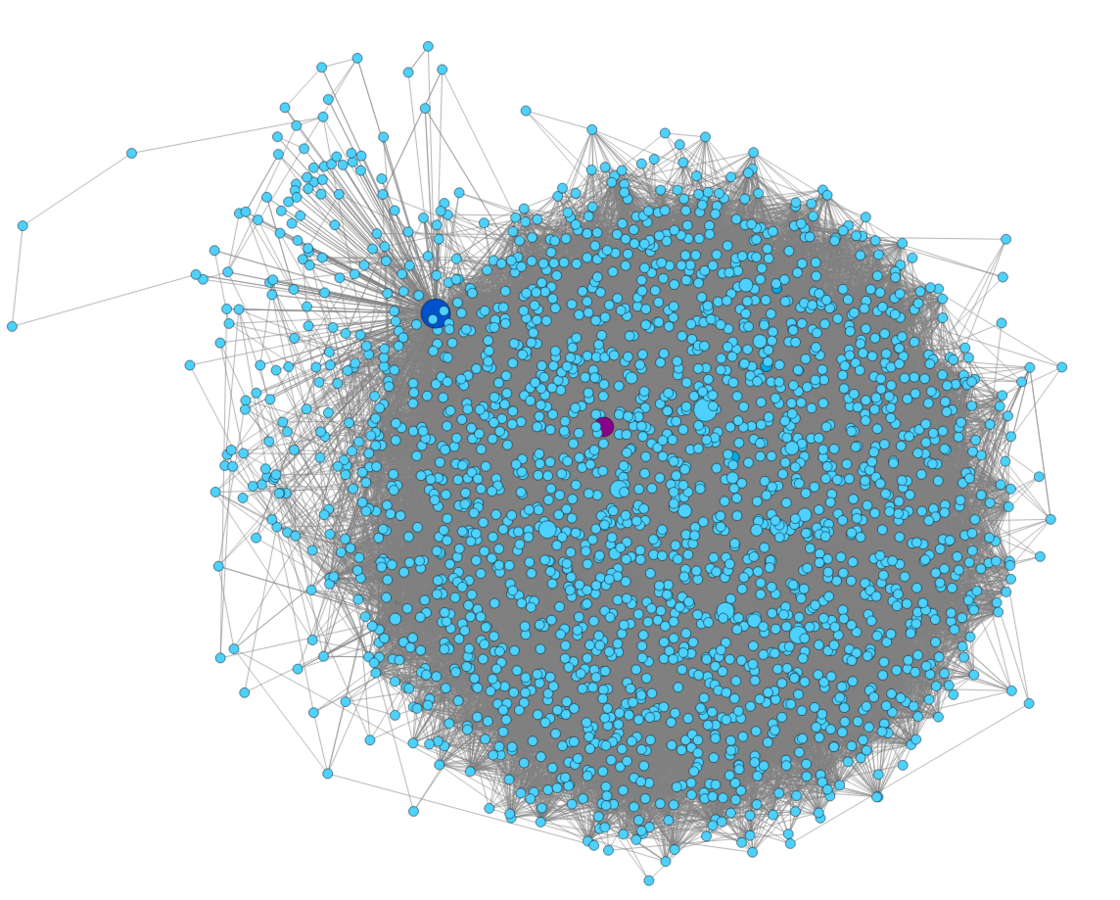
Normal II
-
Nodes: 1072, Edges: 1881
-
Autolooping nodes: 95
-
Repeating edges: 4 (0.21%)
-
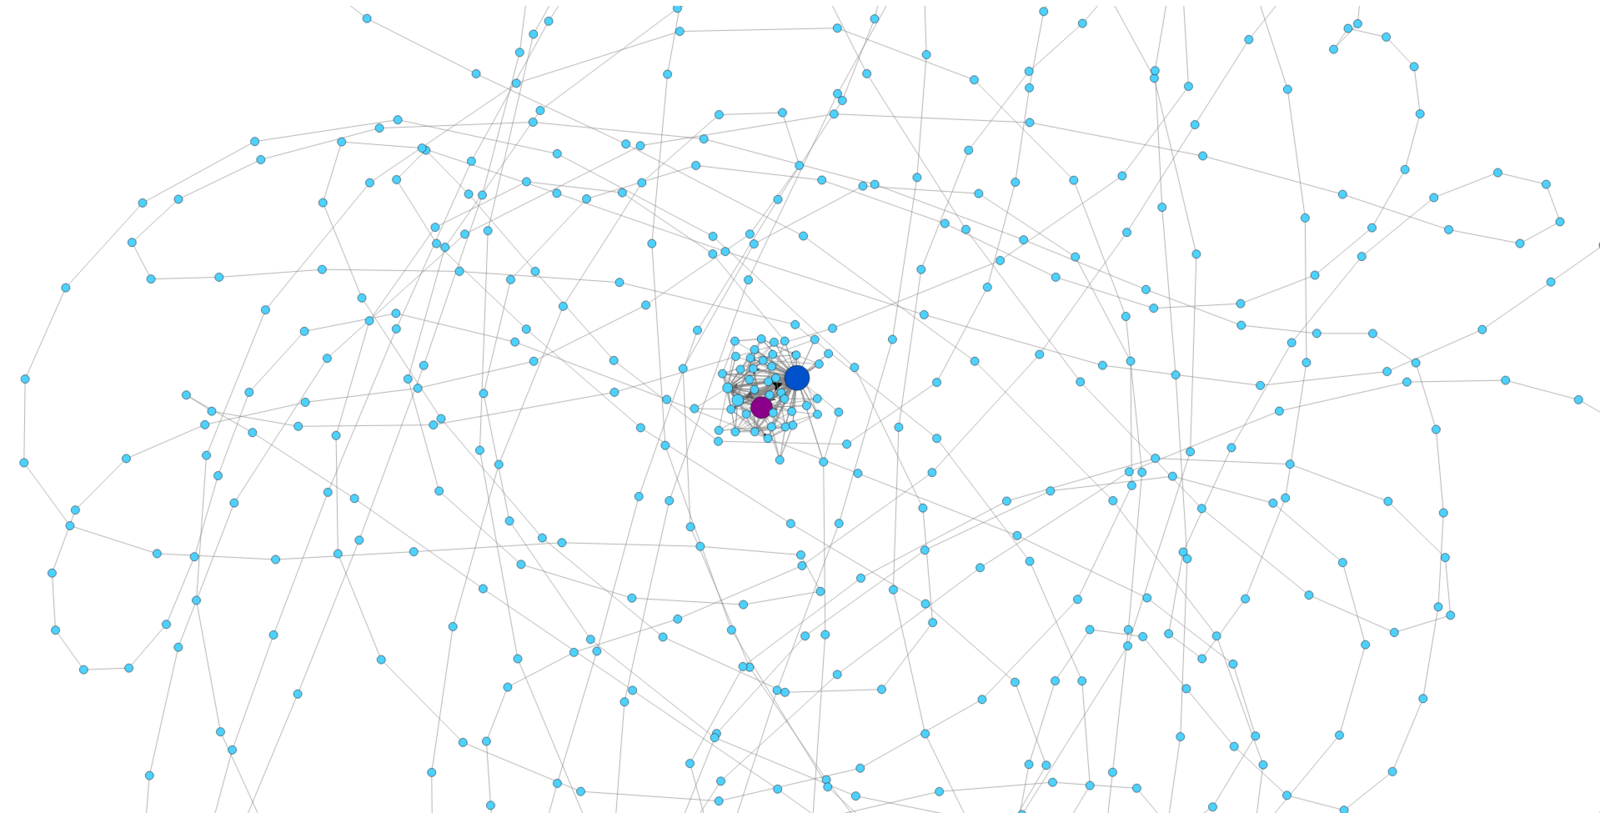
The Extreme Normality Case
Analyzing the Behavior of a Host
The Sality Case

(6.2%)
Conclusion and Thanks!
-
The behavior of the malware can be modeled and detected.
-
The behavioral relationships seem to be consistent.
Sebastian Garcia
sebastian.garcia@agents.fel.cvut.cz
https://stratosphereips.org/category/dataset.html
@eldracote
Detecting the Behavioral Relationships of Malware Connections
By eldraco
Detecting the Behavioral Relationships of Malware Connections
We still have problems to solve when it comes to detecting malware in the network. If the malware is new, there are not signatures, no IoCs, no threat information. If you have thousands of hosts you can not even analyze the payloads, or you don't have payloads and have to resort to NetFlows. In this limited context is where we developed a new idea to detect the behavioral patterns of how a computer works in the network by analyzing its communications as a cyclic graph. Our technique applies new concepts to reduce the information being analyzed while retaining and graphing the major features. We test our concept on dozens of Normal and Malware traffic, which gives significance to the work. The takeaway is: the way you use your computer leaves traces in the network, and those traces can be used to detect when you are infected.


