prometheus @ home
Linux Engineer @ Snow
twitter.com/@erwindekeijzer
github.com/gnur
https://snow.nl
Erwin de Keijzer
How do you get to know new
open source
technology?
Scratch your own itch
learning anything is a lot easier to be motivated about if you have a problem to solve
My itches
- the washing machine
- monitoring golpje
- making, and verifying, backups
The washing machine
13:30

14:48

15:04


15:23


So lets get some notifications when the machine is done
The setup
- Raspberry pi zero w
- usb - p1 cable
- prometheus
- custom go binary for exposing data
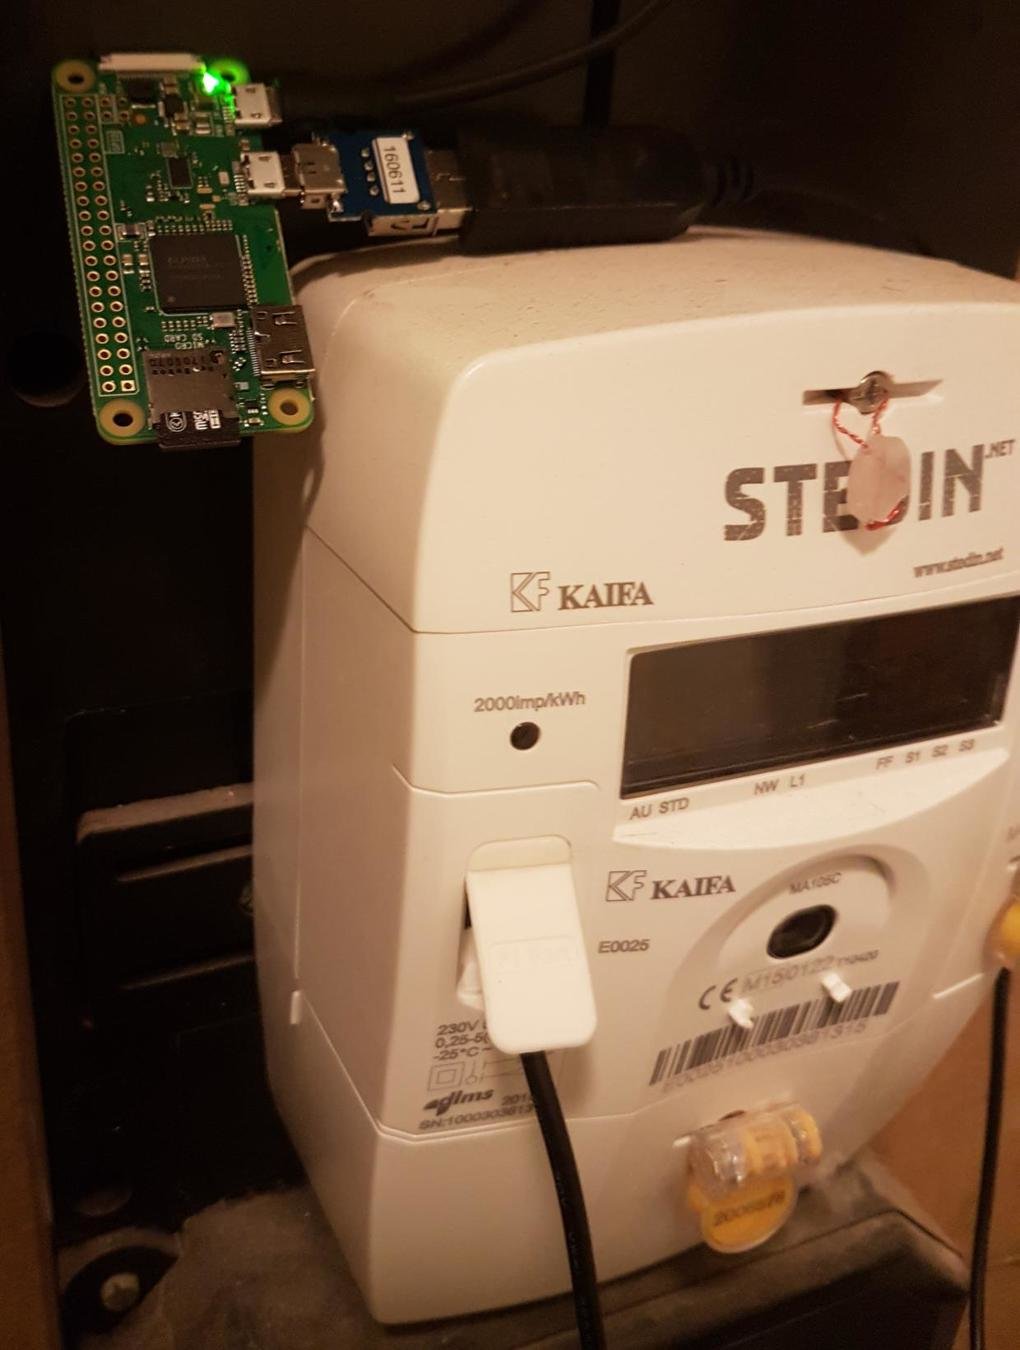
Raspberry pi
zero wifi ->
usb -> p1 cable
smart meter
p1 port ->
prometheus-p1-exporter
- reads /dev/ttyUSB0
- stores relevant info in global vars
- exposes these metrics using promhttp library
- prometheus scrapes endpoint
Prometheus
- pulls metrics from targets
- targets can be predefined or dynamic
- flexible query language
- integrated web-ui
- grafana integration for dashboards
LIVE DEMO

the result
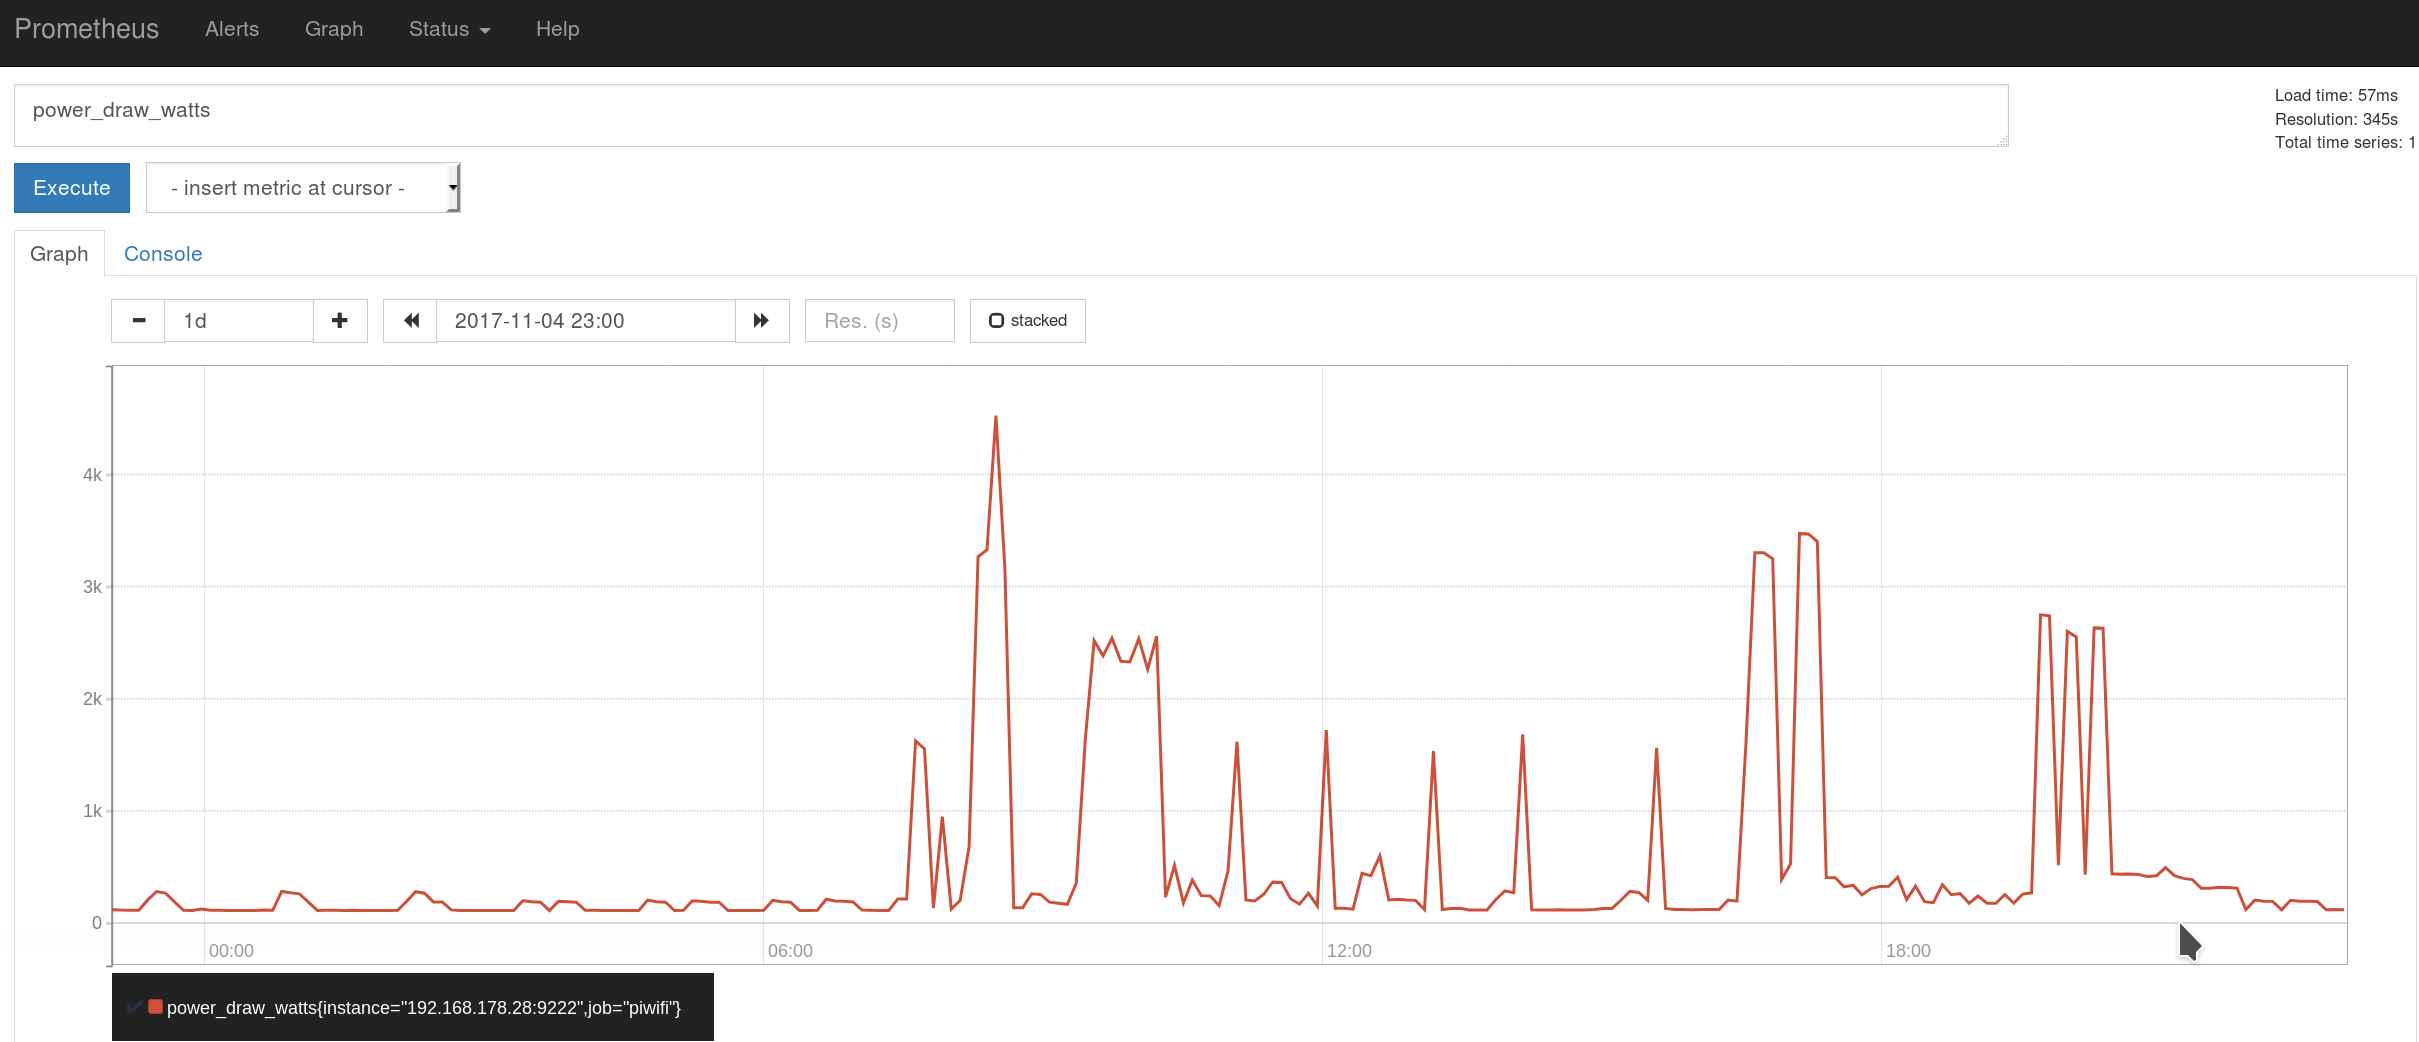
it doesn't work
- power usage is not constant
- can only monitor total usage
- Other machines have similar usage patterns
Doesn't matter,
had fun
golpje
- go lang
- searches piratebay for tv shows
- downloads new episodes
need for monitoring
- I had no idea how much resources it was using
- I was pretty sure it had a memory leak
- sometimes it just stopped working
the setup
- systemd slice for resource usage tracking
- cAdvisor for exporting these metrics
Text
- made by Google
- container advisor
- exposes metrics of containers
- (also keeps historical data, not using that)
systemd setup
[Unit]
Description=Limited resources Slice
DefaultDependencies=no
Before=slices.target

[Slice]
CPUShares=1024
MemoryLimit=512M
[Unit]
Description=golpje agent
Requires=network-online.target
After=network-online.target
[Service]
Environment=GOMAXPROCS=2
User=upload
Group=upload
Restart=always
ExecStart=/usr/local/bin/golpje start
KillSignal=SIGINT
PrivateTmp=true
PrivateDevices=true
ProtectHome=true
ProtectSystem=full
ReadWriteDirectories=/var/lib/golpje /mnt/video
Slice=golpje.slice
CPUAccounting=true
MemoryAccounting=true
[Install]
WantedBy=multi-user.targetgolpje.slice
golpje.service
live demo
but it's not enough
- "Black box" monitoring can only provide so much information
- "White box" monitoring can provide much more data, but needs some more work
Let's add some metrics to golpje
- # searches
- # failed searches
- # searchresults
type Searchmetrics struct {
	Enabled        bool
	Searches       prometheus.Counter
	FailedSearches prometheus.Counter
	SearchResults  prometheus.Counter
}

var sm searcher.Searchmetrics
if con.config.GetBool("metrics_enabled") {
	sm = searcher.Searchmetrics{
		Enabled: true,
		Searches: prometheus.NewCounter(
			prometheus.CounterOpts{
				Name: "golpje_searches",
				Help: "total number of searches",
			},
		),
		FailedSearches: prometheus.NewCounter(
			prometheus.CounterOpts{
				Name: "golpje_failed_searches",
				Help: "total number of searches that failed",
			},
		),
		SearchResults: prometheus.NewCounter(
			prometheus.CounterOpts{
				Name: "golpje_search_results",
				Help: "total number of results that have been found",
			},
		),
	}
	prometheus.MustRegister(sm.Searches)
	prometheus.MustRegister(sm.FailedSearches)
	prometheus.MustRegister(sm.SearchResults)
}
func Start(db *storm.DB, piratebayURL string, results chan Searchresult, searchInterval time.Duration, m Searchmetrics) {
pb := piratebay.New(piratebayURL)
for {
shows, err := shows.All(db)
if err != nil {
continue
}
for _, show := range shows {
if m.Enabled {
m.Searches.Inc()
}
torrents, err := pb.Search(show.Name)
if err != nil {
if m.Enabled {
m.FailedSearches.Inc()
}
continue
}
for _, torrent := range torrents {
if m.Enabled {
m.SearchResults.Inc()
}
results <- Searchresult{
Title: torrent.Title,
Magnetlink: torrent.MagnetLink,
Vipuser: torrent.VIP,
Seeders: torrent.Seeders,
ShowID: show.ID,
}
}
}
time.Sleep(searchInterval)
}
}if con.config.GetBool("metrics_enabled") {
go func() {
http.Handle(con.config.GetString("metrics_path"), promhttp.Handler())
log.Fatal(http.ListenAndServe(con.config.GetString("metrics_port"), nil))
}()
}Another demo
alerting with prometheus
- prometheus not high available
- alertmanager is highly available (clustered)
- alertmanager does smart deduplication
live demo
sources
- https://prometheus.io
- https://github.com/prometheus/alertmanager
- https://github.com/gnur/golpje
- https://github.com/gnur/prometheus-p1-exporter
- https://github.com/prometheus/client_golang
- https://github.com/google/cadvisor
- https://github.com/mholt/caddy
- https://mosh.org/
prometheus at home
By Erwin de Keijzer