Allocations and the Garbage Collector
The Garbage Collector and Generations
The Garbage Collector and Generations
When running a .NET application, the runtime allocates a big chunk of memory in which it manages (de)allocations of objects.
Allocations are done whenever a new object instance is created, deallocations are handled by the Garbage Collector (GC).
The Garbage Collector and Generations
The 2 components that belong to GC are the allocator and the collector.
The allocator is responsible for getting more memory and triggering the collector when appropriate.
The collector reclaims garbage, or the memory of objects that are no longer in use by the program.
There are other ways that the collector can get called, such as manually calling GC.Collect or the finalizer thread receiving an asynchronous notification of the low memory (which triggers the collector).
The Garbage Collector and Generations
When is memory from the heap allocated?
When is memory from the heap allocated?
Memory from the heap is allocated when you new an object.
Executing var person = new Person(); will allocate a Person object on the heap, consuming memory.
No memory is allocated when making use of value types, such as int or bool, a custom struct.
The garbage collector never has to collect these, as they are not “pointers towards a value elsewhere in memory”, like objects. They just contain the value directly.
When is memory from the heap allocated?
int i = 42;

// boxing - wraps the value type in an "object box"
// (allocating a System.Object)
object o = i;

// unboxing - unpacking the "object box" into an int again
// (CPU effort to unwrap)
int j = (int)o;
When is memory from the heap allocated?
There are some other interesting cases where you would not expect allocations. Let’s see how we can detect them:
- Staring at Intermediate Language
- Using plugins for Visual Studio and/or ReSharper
- Profiling
How to detect allocations
Staring at Intermediate Language
Staring at Intermediate Language
Tools:
- ReSharper’s IL viewer
- ildasm.exe
Quick note:
When using any IL viewer to look at allocations, make sure to build using the Release build configuration.
Debug builds usually do not run any/all compiler optimizations, making for different IL code from what you would see with a Release build.
Staring at Intermediate Language
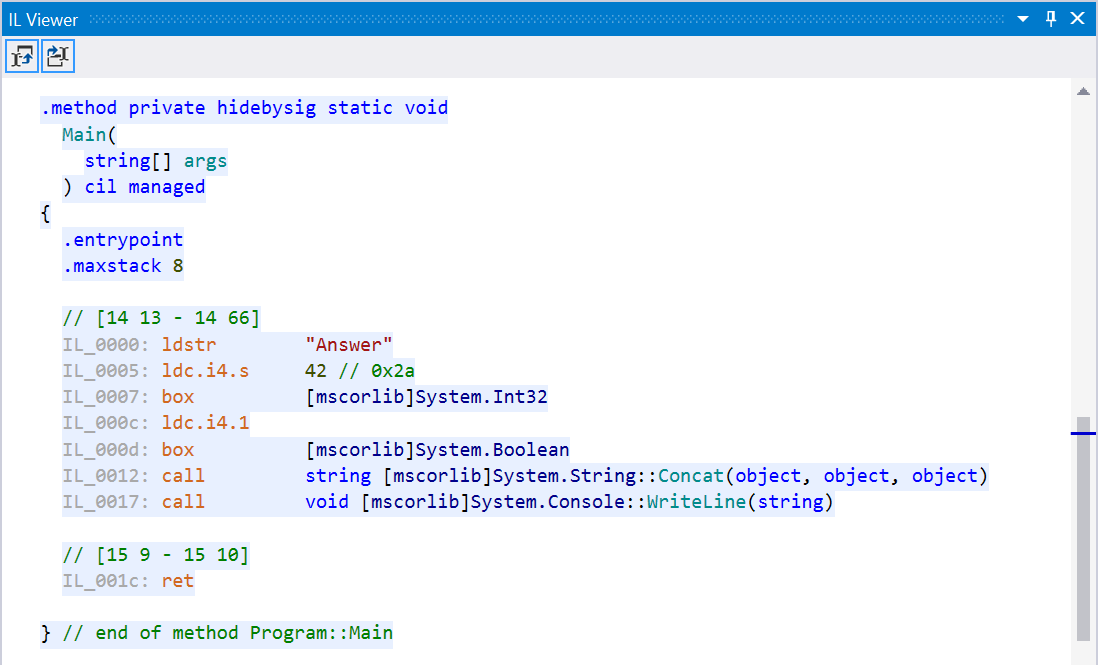
Console.WriteLine(string.Concat("Answer", 42, true));How about this line of code?
Staring at Intermediate Language
In IL, this is compiled to:
Staring at Intermediate Language
private static void ParamsArray()
{
    ParamsArrayImpl();
}

private static void ParamsArrayImpl(params string[] data)
{
    foreach (var x in data)
    {
        Console.WriteLine(x);
    }
}
Working with params arrays in methods.
Have a look at this code:
Staring at Intermediate Language
There’s a hidden allocation in here…
The call to ParamsArrayImpl() looks like this in IL:
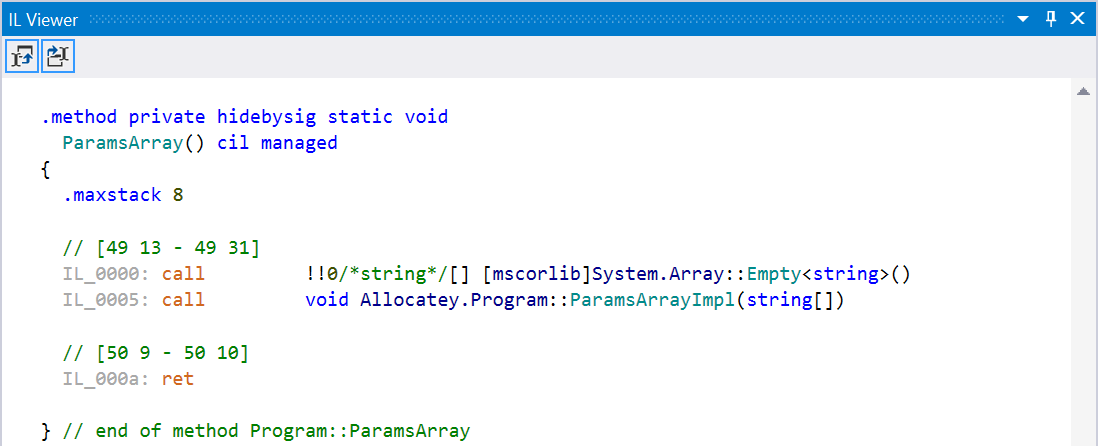
Quick note:
Starting with .NET 4.6, no empty array will be allocated. Instead, Array.Empty<T> will be passed which is a cached, empty array.
Staring at Intermediate Language
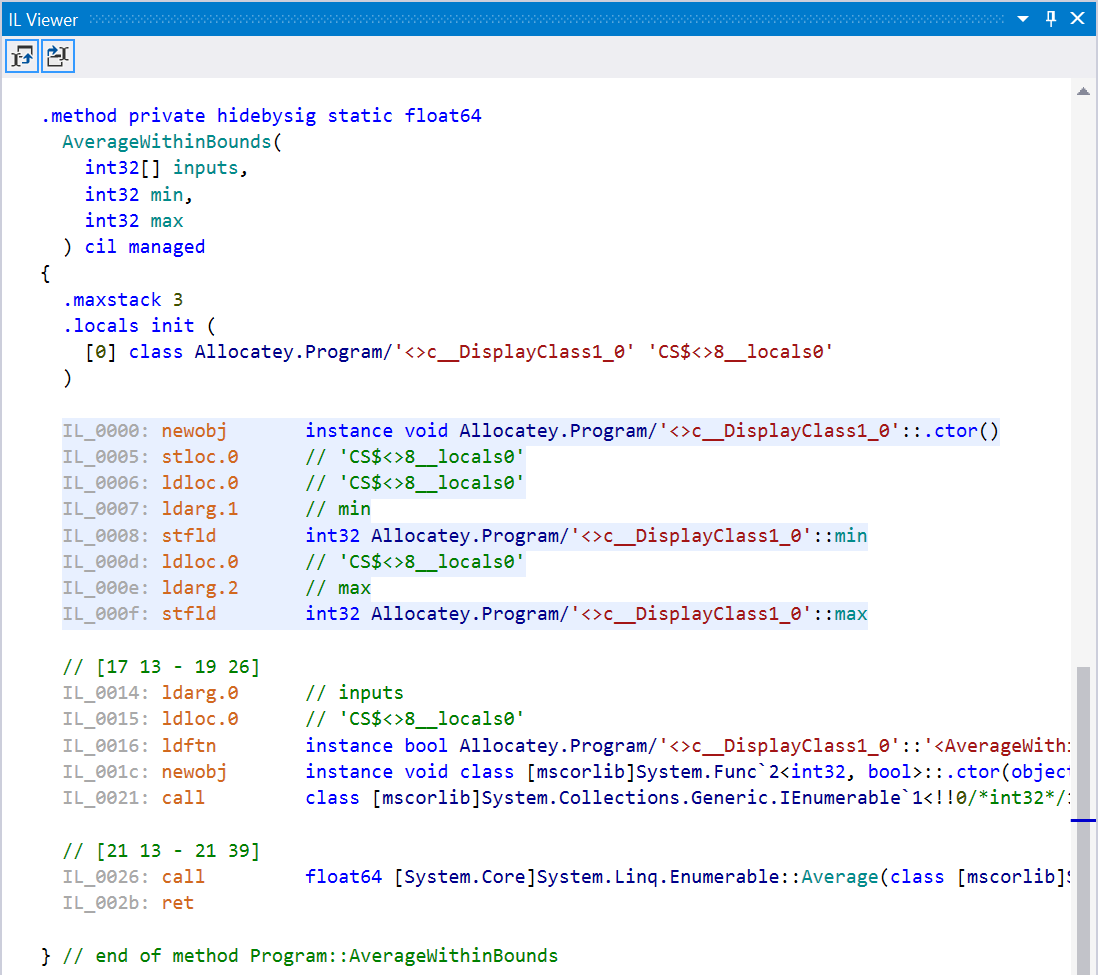
private static double AverageWithinBounds(
    int[] inputs,
    int min,
    int max)
{
    var filtered = from x in inputs
        where (x >= min) && (x <= max)
        select x;

    return filtered.Average();
}
Using LINQ and anonymous functions
Staring at Intermediate Language
Using LINQ and anonymous functions
Staring at Intermediate Language
Using LINQ and anonymous functions
There are many more examples, try looking at this piece of code’s IL:
var strings = new string[] { "x", "y"};
foreach (var s in strings)
{
    Task.Run(() => Console.WriteLine(s));
}
(spoiler alert: a new <>c__DisplayClass0_0 will be allocated, capturing s for use in the System.Action)
How to detect allocations
Using plugins for Visual Studio and/or ReSharper
Using plugins for Visual Studio and/or ReSharper

How to detect allocations
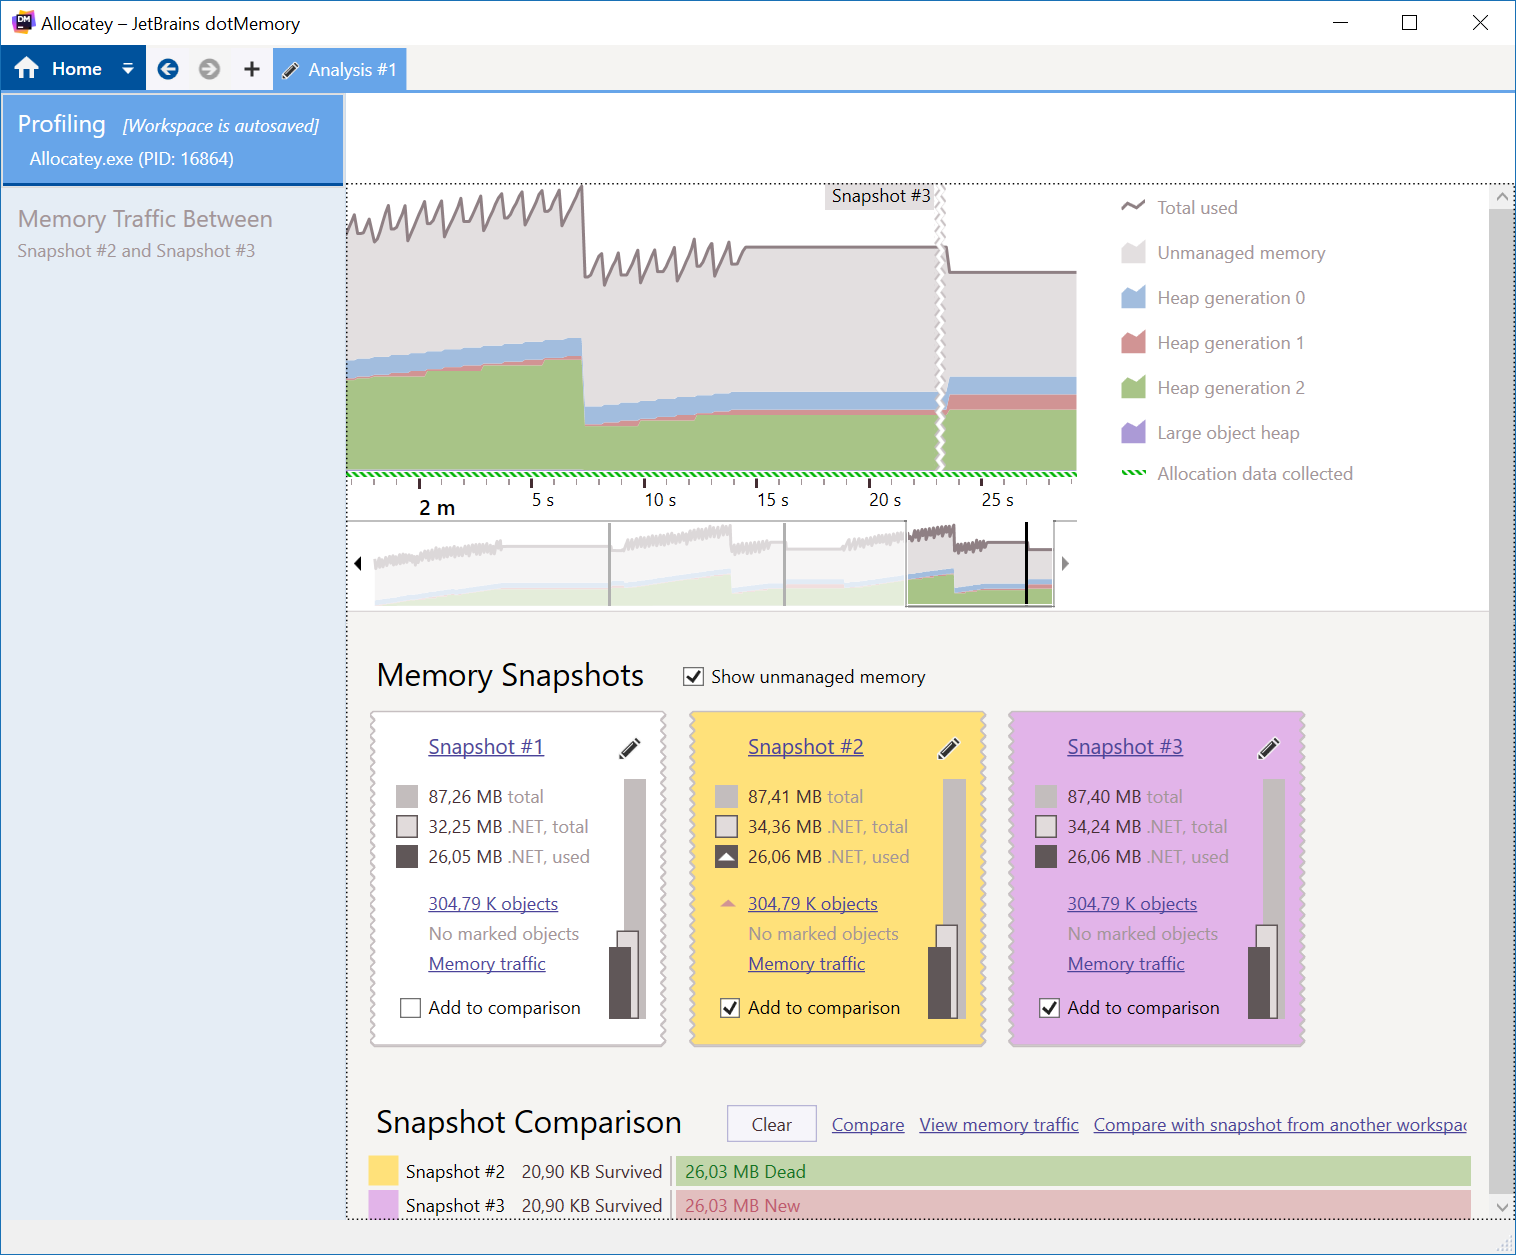
Profiling
Profiling
[
  {
    "name": "Westmalle Tripel",
    "brewery": "Brouwerij der Trappisten van Westmalle",
    "rating": 99.9,
    "votes": 256974
  },
  ...
]
JSON array:
Requirements:
- Read this file into a multi-dimensional dictionary (Dictionary<string, Dictionary<string, double>>)
- Reload this dictionary every couple of minutes
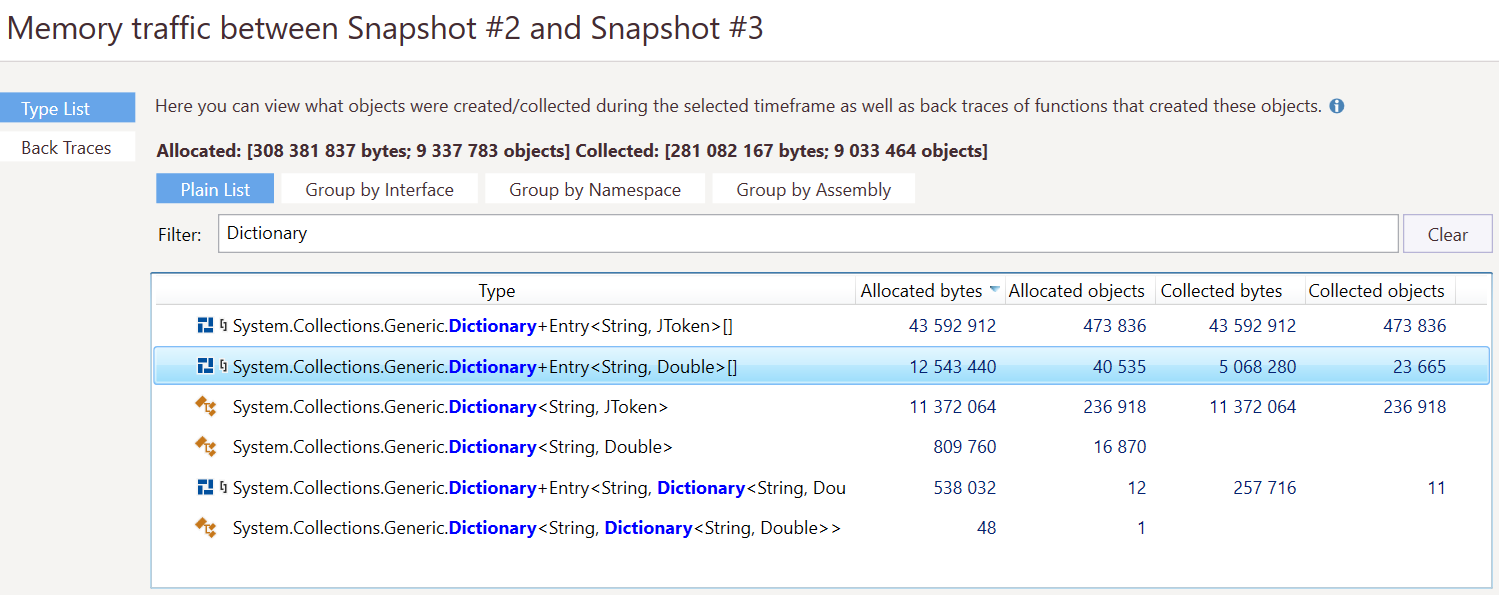
Profiling
public static void LoadBeers()
{
    Beers = new Dictionary<string, Dictionary<string, double>>();
    using (var reader = new JsonTextReader(new StreamReader(File.OpenRead("beers.json"))))
    {
        while (reader.Read())
        {
            if (reader.TokenType == JsonToken.StartObject)
            {
                // Load object from the stream
                var beer = JObject.Load(reader);
                var breweryName = beer.Value<string>("brewery");
                var beerName = beer.Value<string>("name");
                var rating = beer.Value<double>("rating");

                // Add beers per brewery dictionary if it does not exist
                Dictionary<string, double> beersPerBrewery;
                if (!Beers.TryGetValue(breweryName, out beersPerBrewery))
                {
                    beersPerBrewery = new Dictionary<string, double>();
                    Beers.Add(breweryName, beersPerBrewery);
                }
                // Add beer
                if (!beersPerBrewery.ContainsKey(beerName))
                {
                    beersPerBrewery.Add(beerName, rating);
                }
            }
        }
    }
}
Profiling
for (var i = 0; i < 10; i++)
{
    BeerLoader.LoadBeers();
    Console.ReadLine();
}
Profiling
No GCs for your allocations?
No GCs for your allocations?
Short answer:
.NET already have such a feature and that’s called the NoGCRegion.
GC.TryStartNoGCRegion API allows you to tell us the amount of allocations you’d like to do and when you stay within it, no GCs will be triggered.
GC.EndNoGCRegion will revert back to doing normal GCs
No GCs for your allocations?
Long answer:
There’s currently limitations on how much you can allocate with NoGCRegion
If you are using Server GC you are able to ask for a lot more memory on SOH because its SOH segment size is a lot larger.
Currently (and this has been the case for a long time) the default seg size on 64-bit for Server GC is 4GB
When you have > 4 procs it means the SOH segment size is 1GB each.
If have > 8 procs it means the SOH segment size is 1GB each.
No GCs for your allocations?
On Desktop you have ways to make the SOH segment size larger –
use the gcSegmentSize in app config
Don’t optimize what should not be optimized
Don’t optimize what should not be optimized
There is an old adage in IT that says “don’t do premature optimization”.
In other words: maybe some allocations are okay to have, as the GC will take care of cleaning them up anyway.
Resources
Resources
Allocations and the Garbage Collector
By Pavel Nasovich
Allocations and the Garbage Collector
The .NET Garbage Collector (GC) slides based on several articles.


