FACING THE CHALLENGE OF CLIMATE CHANGE WITH XARRAY AND DASK
Francesco Nazzaro <f.nazzaro@bopen.eu> - @fnazzaro89
B-Open, Rome - http://bopen.eu (now hiring!)
12th of July, 2017
Climate Change
[ . . . ]
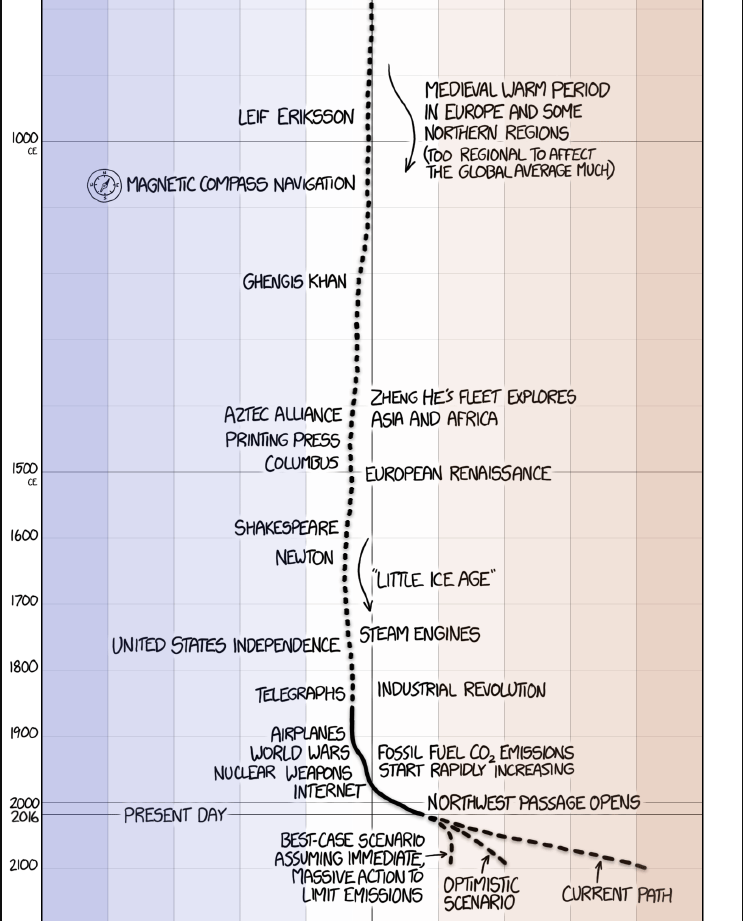
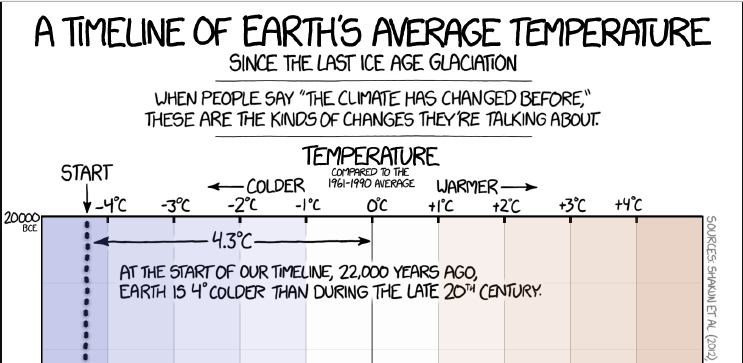
Temperature compared to the 1961-1990 average
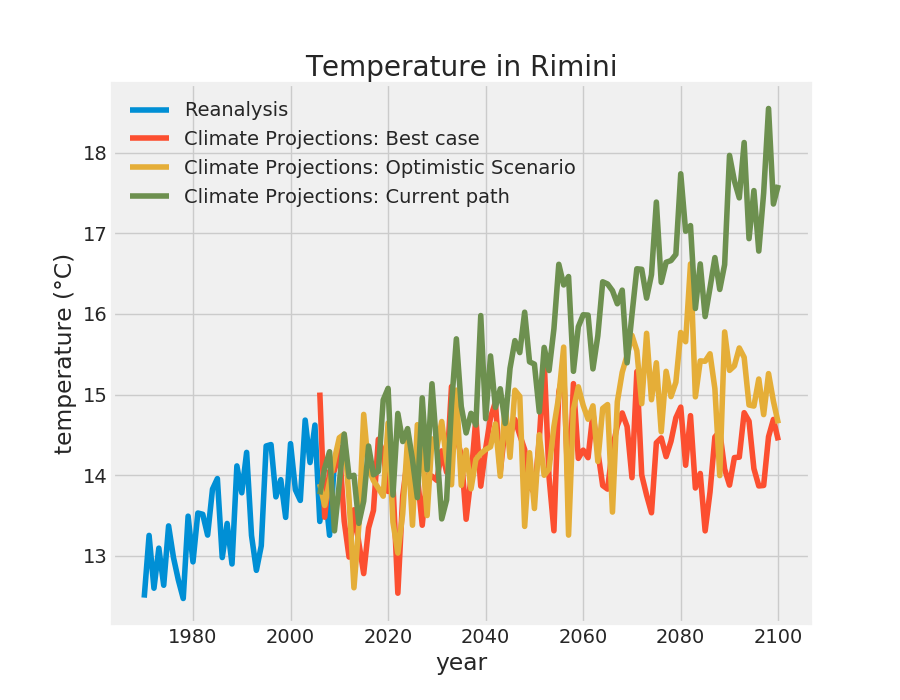
3 scenarios:
- best-case: assuming immediate massive action to limit emissions
- optimistic scenario: +2°C in 2100
- current path: +4°C in 2100
We are here: +1°C
Climate Data
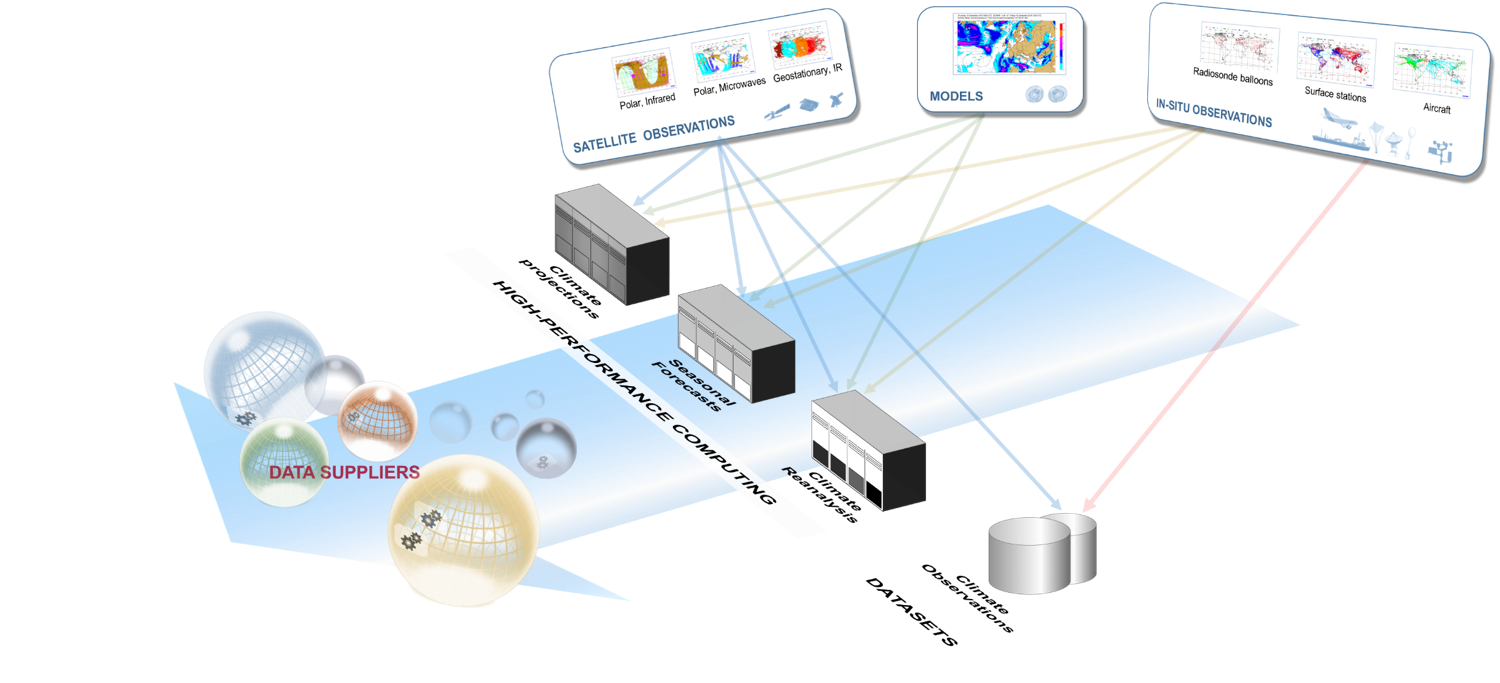
Climate Data
- Weather Forecasts - Meteorological model up to 10 days
- Reanalysis - Meteorological model applied to the past
- Seasonal Forecasts - Meteorological model up to 6 months
- Climate projections - Climate model up to 100 years (several scenarios)
Climate Data
ECMWF ERA-Interim (Reanalysis)
- Spatial resolution: 80km x 80km
- Vertical coverage: up to 64km in 60 levels
- Temporal coverage: from 1979 to today
- Variables: ~100
- Temporal resolution: 12h / 4h
Petabytes everywhere!
- 480 x 240 ~ 100.000
- ... x 60 ~ 7.000.000
- ... x 80.000 ~ 550.000.000.000
- ... x 100 ~ 55.000.000.000.000
- ... x 2 ~ 100.000.000.000.000
100 terabytes
Python tools
The main library to deal with climate data is


thanks to integration, it adds dimensions names and
coordinate indexes to ndarray
from ecmwfapi import ECMWFDataServer
server = ECMWFDataServer()
dataset_path = "dataset.nc"
server.retrieve({
    'stream'    : "oper",
    'levtype'   : "sfc",
    'param'     : "228.128/167.128",
    'dataset'   : "interim",
    'step'      : "0",
    'grid'      : "0.75/0.75",
    'time'      : "00",
    'date'      : "1979-01-01/to/2016-12-31",
    'type'      : "an",
    'class'     : "ei",
    'format'    : "netcdf",
    'target'    : dataset_path
 })
To get climate data from ECMWF you can follow http://apps.ecmwf.int/archive-catalogue/
>>> import xarray as xr
>>> dataset = xr.open_dataset(dataset_path)
>>> print(dataset)
<xarray.Dataset>
Dimensions:  (lat: 241, lon: 480, time: 452)
Coordinates:
  * lat      (lat) float32 -90.0 -89.25 -88.5 -87.75 -87.0 -86.25 -85.5 ...
  * lon      (lon) float64 -180.0 -179.2 -178.5 -177.8 -177.0 -176.2 -175.5 ...
  * time     (time) datetime64[ns] 1979-01-31 1979-02-28 1979-03-31 ...
Data variables:
    tas      (time, lat, lon) float32 249.589 249.589 249.589 249.589 ...
    tprate   (time, lat, lon) float32 9.30046e-10 9.30046e-10 9.30046e-10 ...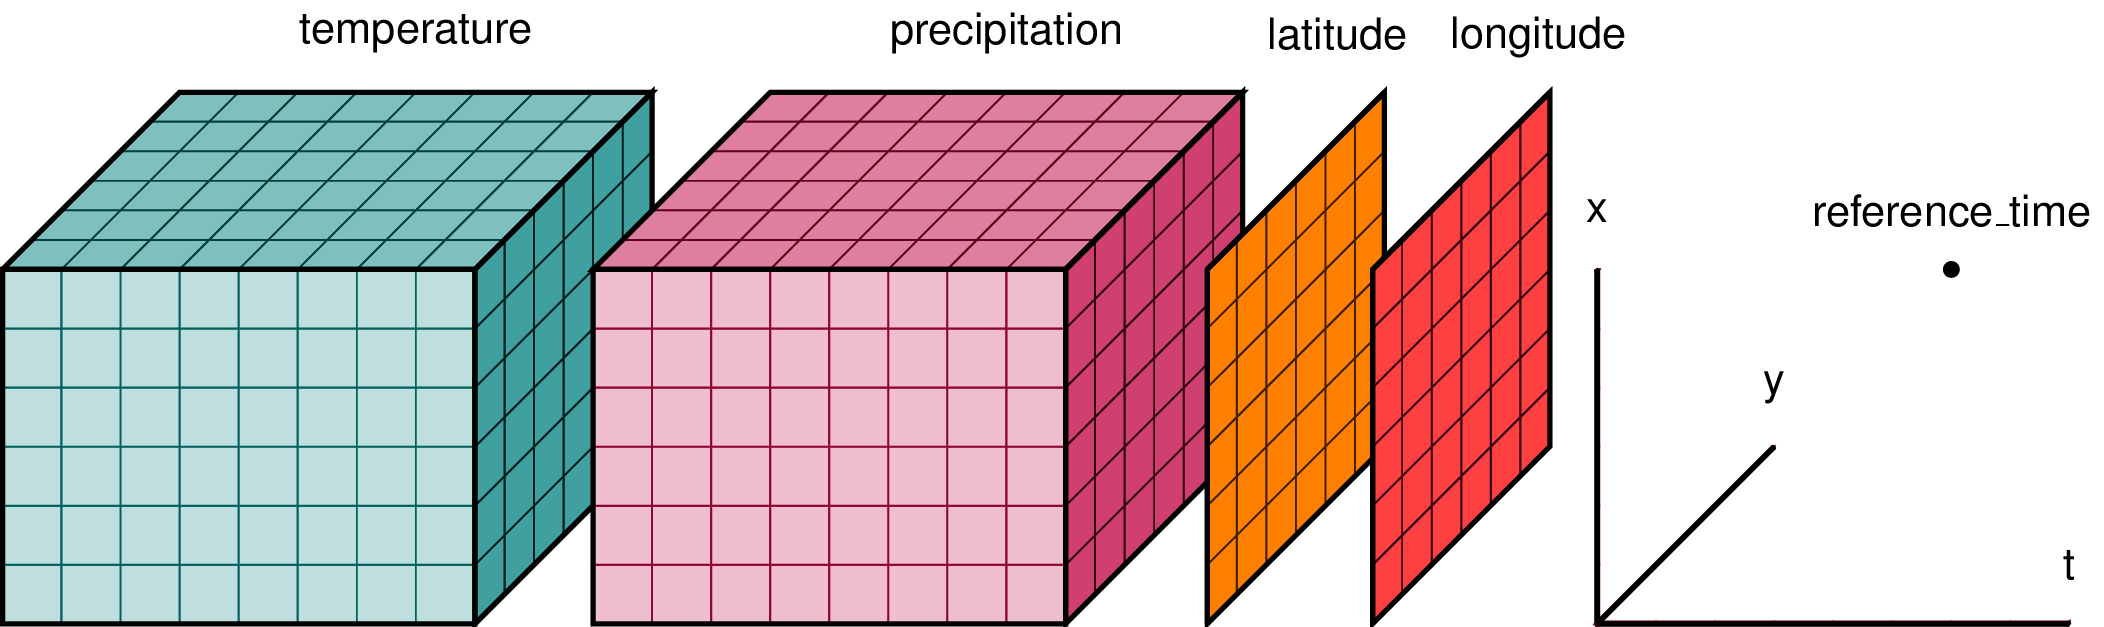
precipitation (tprate) temperature (tas) lat lon
time
Xarray DataSet

You can select only a variable
>>> print(dataset.tas)
<xarray.DataArray 'tas' (time: 452, lat: 241, lon: 480)>
dask.array<open_dataset-00bb1754472e239912b40328fcbb22f6tas, shape=(452, 241, 480), dtype=float32, chunksize=(452, 241, 480)>
Coordinates:
  * lat      (lat) float32 -90.0 -89.25 -88.5 -87.75 -87.0 -86.25 -85.5 ...
  * lon      (lon) float64 -180.0 -179.2 -178.5 -177.8 -177.0 -176.2 -175.5 ...
  * time     (time) datetime64[ns] 1979-01-31 1979-02-28 1979-03-31 ...
Attributes:
    standard_name:  air_temperature
    long_name:      2 metre temperature
    units:          K
precipitation (tprate) temperature (tas) lat lon
time
Xarray DataArray
>>> dataset.tas.shape
(452, 241, 480)
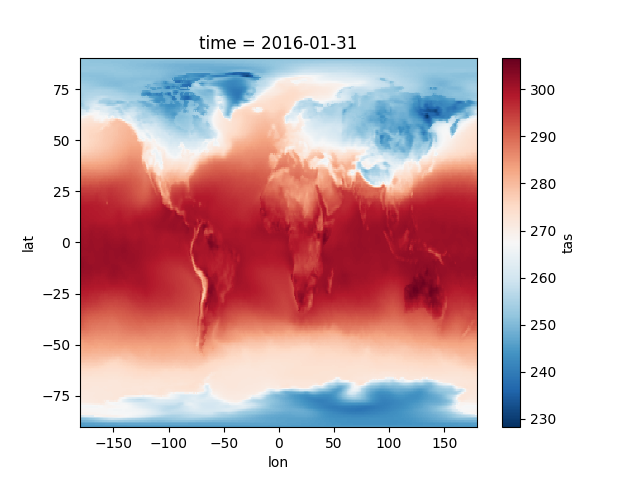
>>> tas_2016 = dataset.tas.sel(time='2016-01')
>>> tas_2016.shape
(1, 241, 480)
>>> print(tas_2016)
<xarray.DataArray 'tas' (time: 1, lat: 241, lon: 480)>
dask.array<getitem, shape=(1, 241, 480) ...
Coordinates:
* lat (lat) float32 -90.0 -89.25 ...
* lon (lon) float64 -180.0 -179.2 ...
* time (time) datetime64[ns] 2016-01-31
Attributes:
standard_name: air_temperature
long_name: 2 metre temperature
units: K
>>> tas_2016.plot(cmap='RdBu')Xarray DataSet and DataArray have all the methods and attributes of numpy and a lot more methods to perform operations on data.
Select a time
It depends only on lat and lon map
>>> tas_rimini = dataset.tas.sel(lat=44.05755, lon=12.56528, method='nearest')
>>> print(tas_rimini)
<xarray.DataArray 'tas' (time: 452)>
dask.array<getitem, shape=(452,), dtype=float32, chunksize=(452,)>
Coordinates:
    lat      float32 44.25
    lon      float64 12.75
  * time     (time) datetime64[ns] 1979-01-31 1979-02-28 1979-03-31 ...
Attributes:
    standard_name:  air_temperature
    long_name:      2 metre temperature
    units:          K

>>> tas_rimini.plot()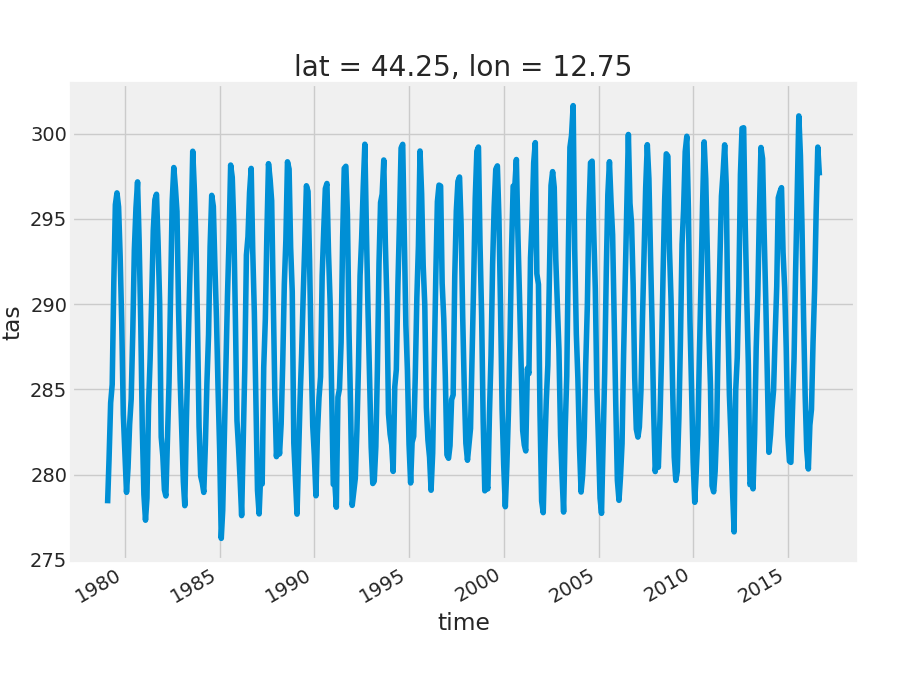
Location selection
- It depends only on time
- time-series
Computing climatology (annual cycle)
>>> climatology = tas_rimini.groupby('time.month').mean('time')
>>> print(climatology)

<xarray.DataArray 'tas' (month: 12)>
dask.array<stack, shape=(12,), dtype=float32, chunksize=(1,)>
Coordinates:
    lat      float32 44.25
    lon      float64 12.75
  * month    (month) int64 1 2 3 4 5 6 7 8 9 10 11 12

>>> climatology.plot()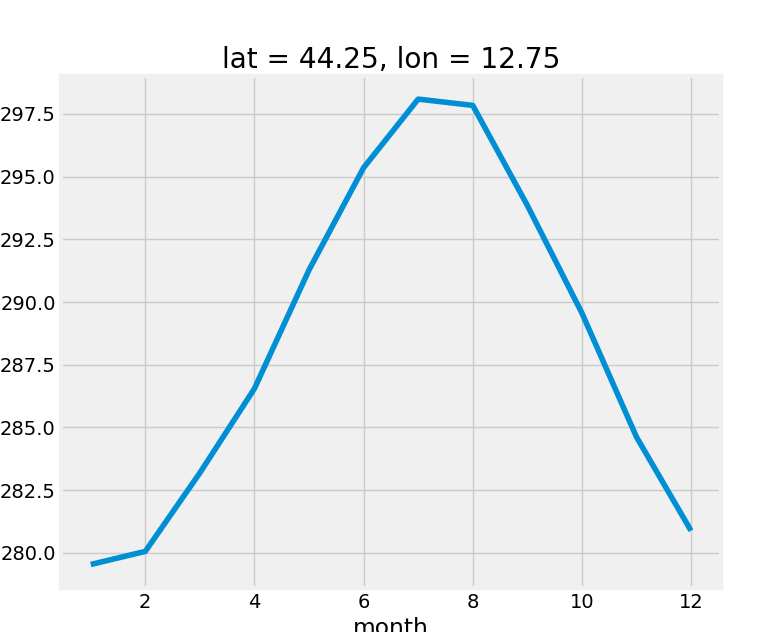
- Starting from a time-series you can group data by month and perform a mean
- A new coordinate is created: "month"
- Time-series
Xarray integration with Dask is crucial to handle large data as climate data
Dask divides arrays into many small pieces, called chunks, each of which is presumed to be small enough to fit into memory.
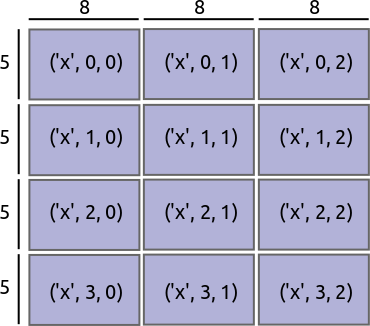
Operations on dask arrays are lazy. Operations queue up a series of tasks mapped over blocks, and no computation is performed until you actually ask values to be computed

Open dataset with chunks:
>>> from dask.dot import dot_graph
>>> dataset = xr.open_dataset('dataset.nc', chunks={'lat':200, 'lon':200})  # a chunk every 200 lat and lon
>>> tas_rimini = dataset.tas.sel(lat=44.05755, lon=12.56528, method='nearest')
>>> climatology = tas_rimini.groupby('time.month').mean('time')
>>> dot_graph(climatology.data.dask)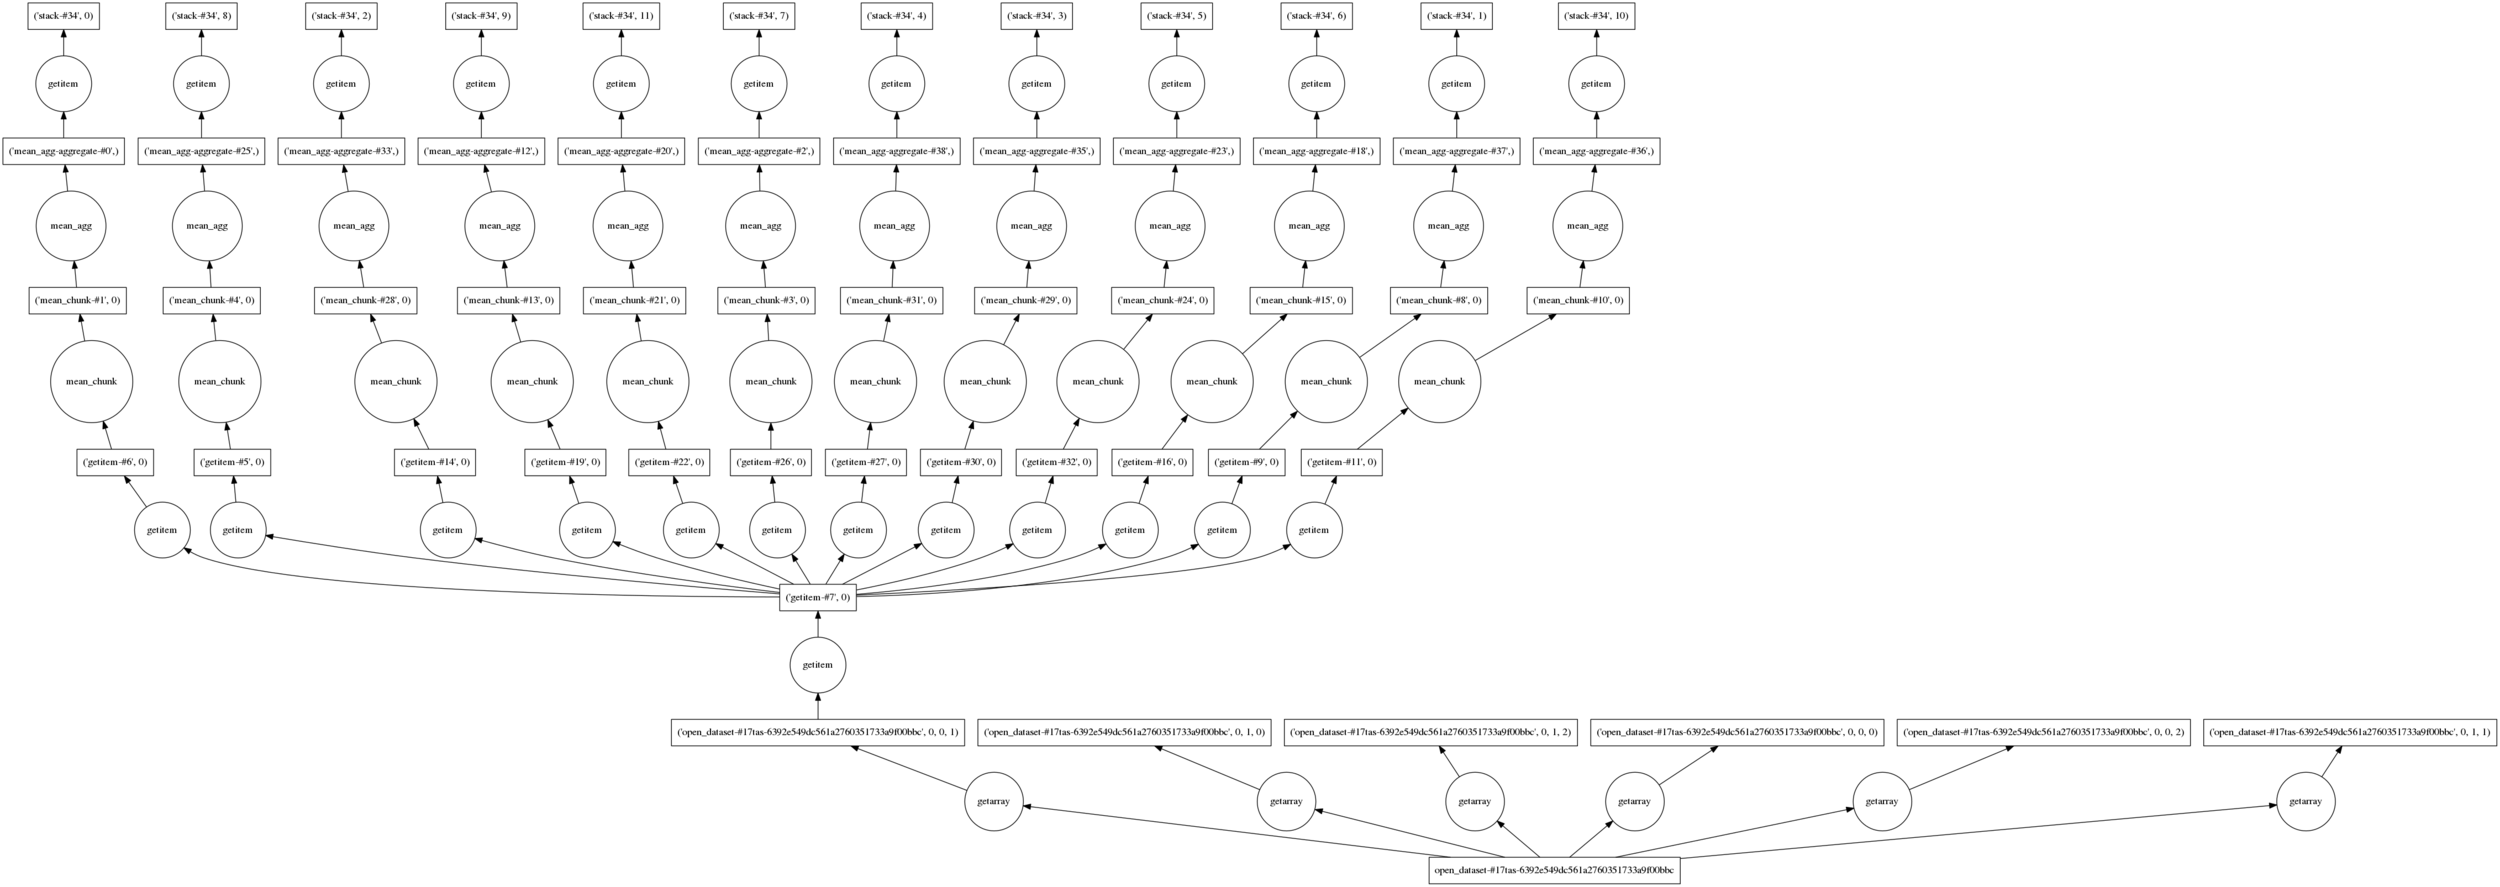
NETCDF
Chunks
Copernicus programme
- Copernicus is the world's largest earth observation programme, directed by European Commission in partnership with ESA.
- It aims at achieving a global and continuous Earth observation capacity.
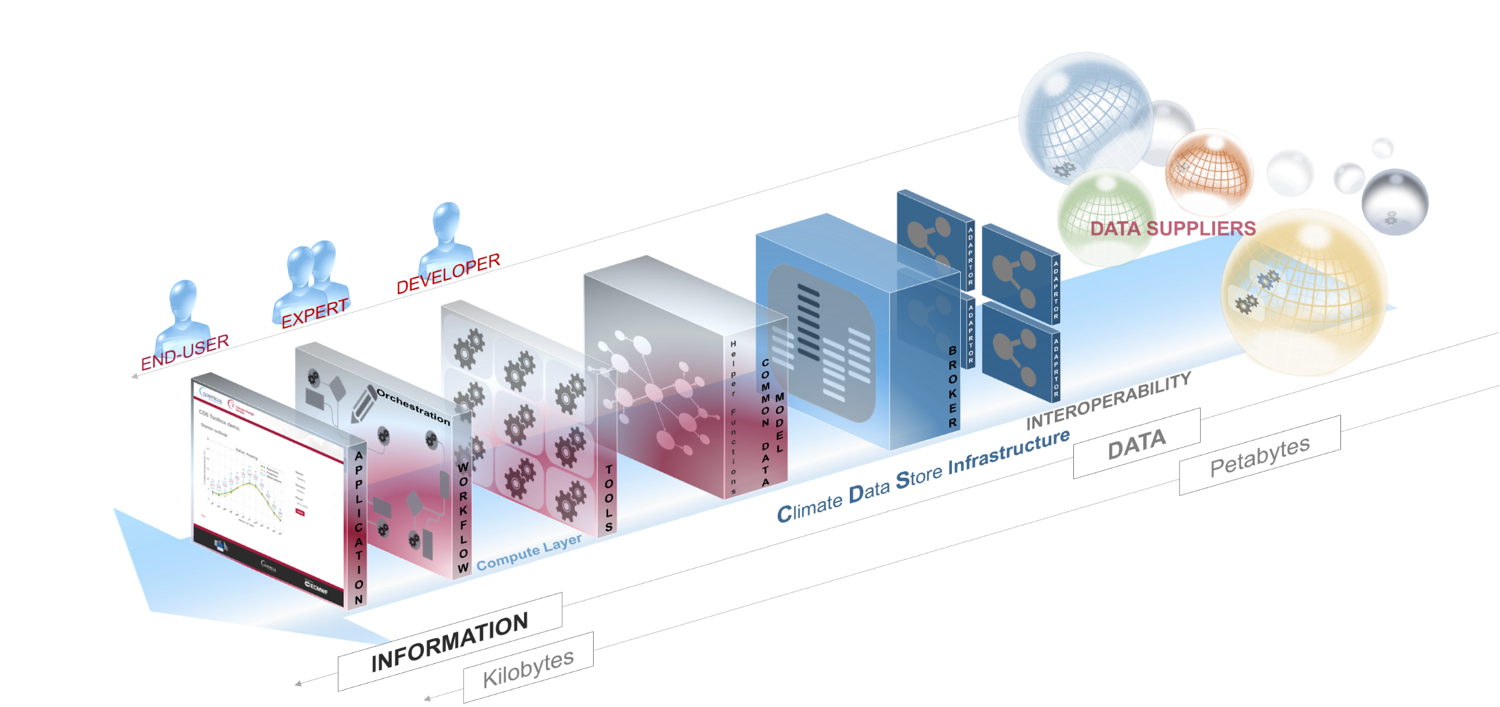
- The Climate Data Store will be at the center of the Copernicus Climate Change Service (C3S) and it will provide climate information on past, present and future in terms of Essential climate variables (ECV) and derived climatic indicators.
Climate Data Store
- CDS will be a distributed system, and it will simplify access to climate data through a unified web interface.
- It will contain observations, reanalysis, climate projections and seasonal forecasts.
- It will provide a Software Platform (Toolbox) that will allow to develop applications to the users using all the informations in the CDS.
- Services are designed to meet the needs of several types of users like policy makers, experts and scientists.
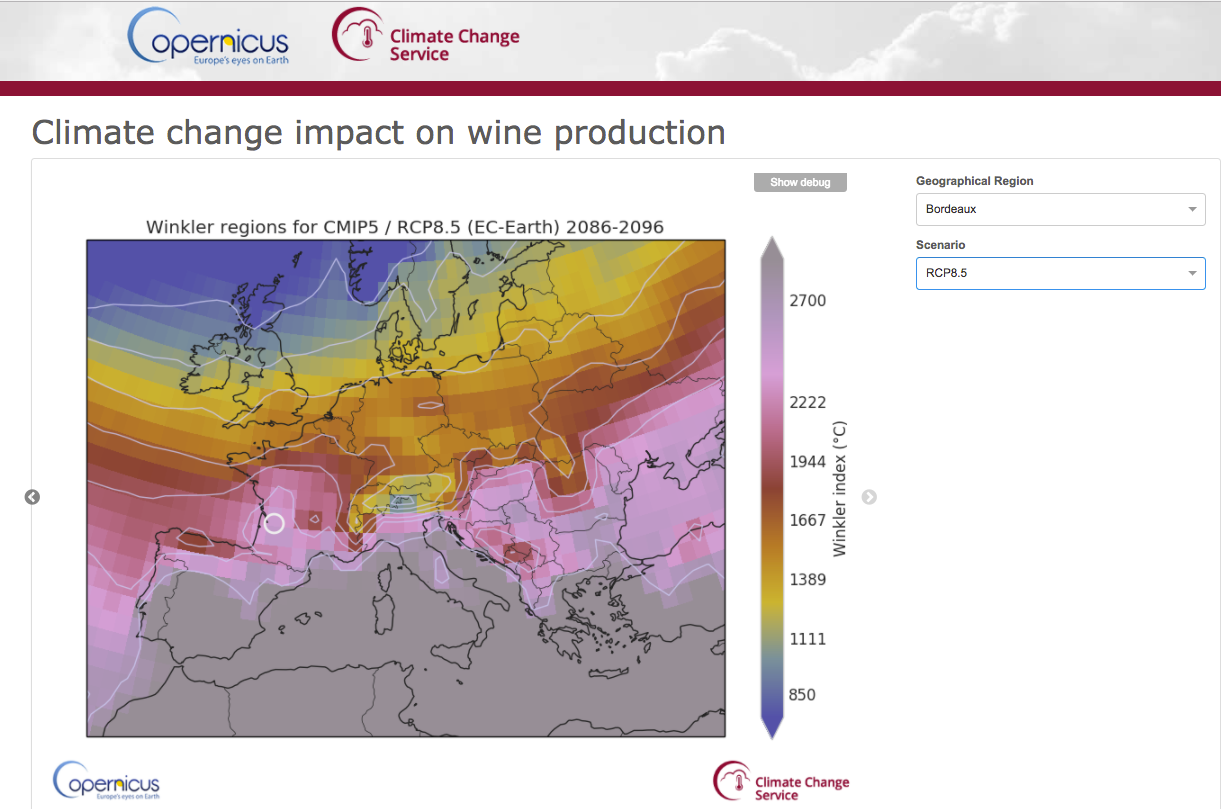
CDS Toolbox
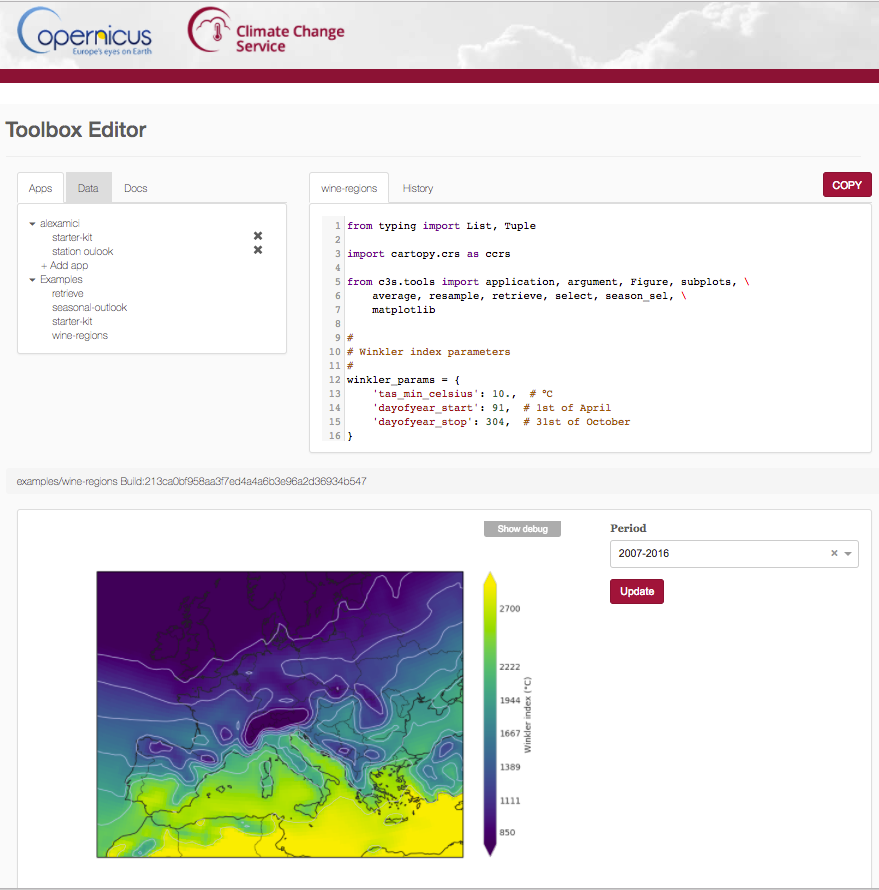
Resources from CDS
Python editor with xarray and custom climate tools
Application preview for End Users
Expert interface
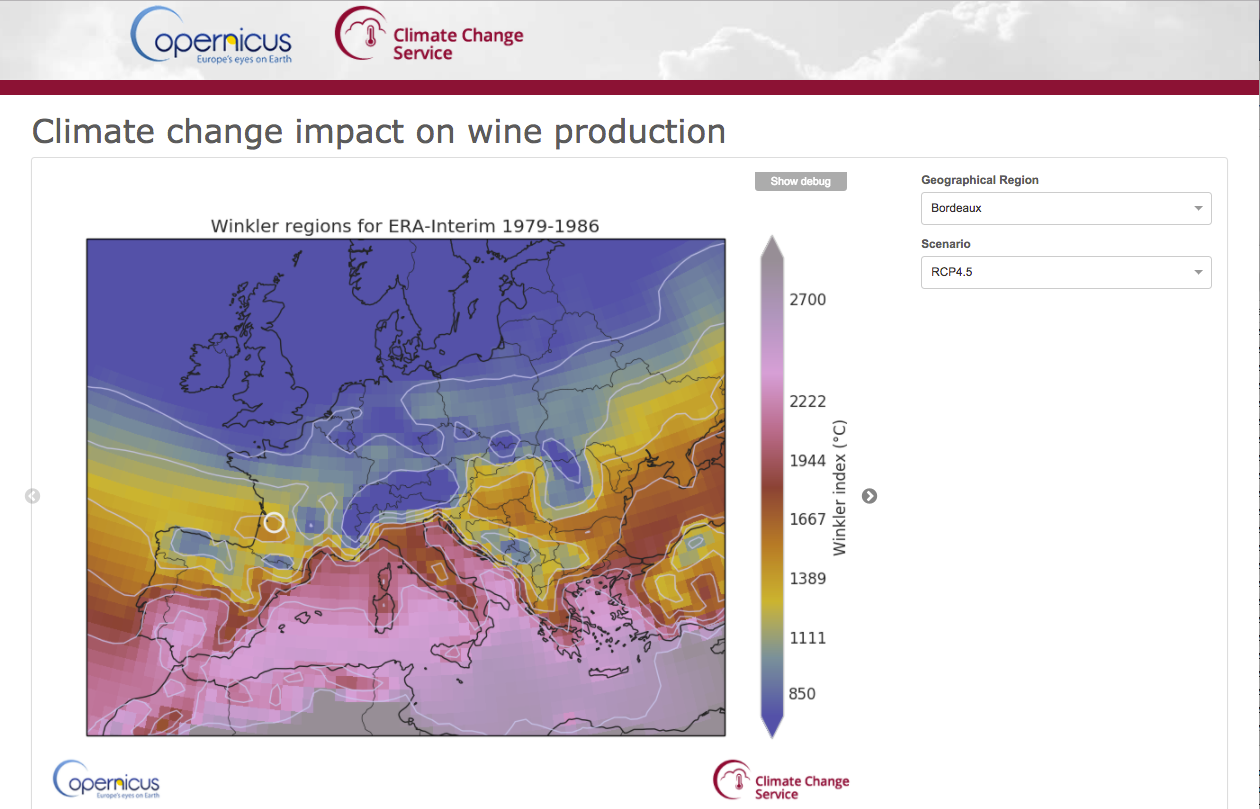
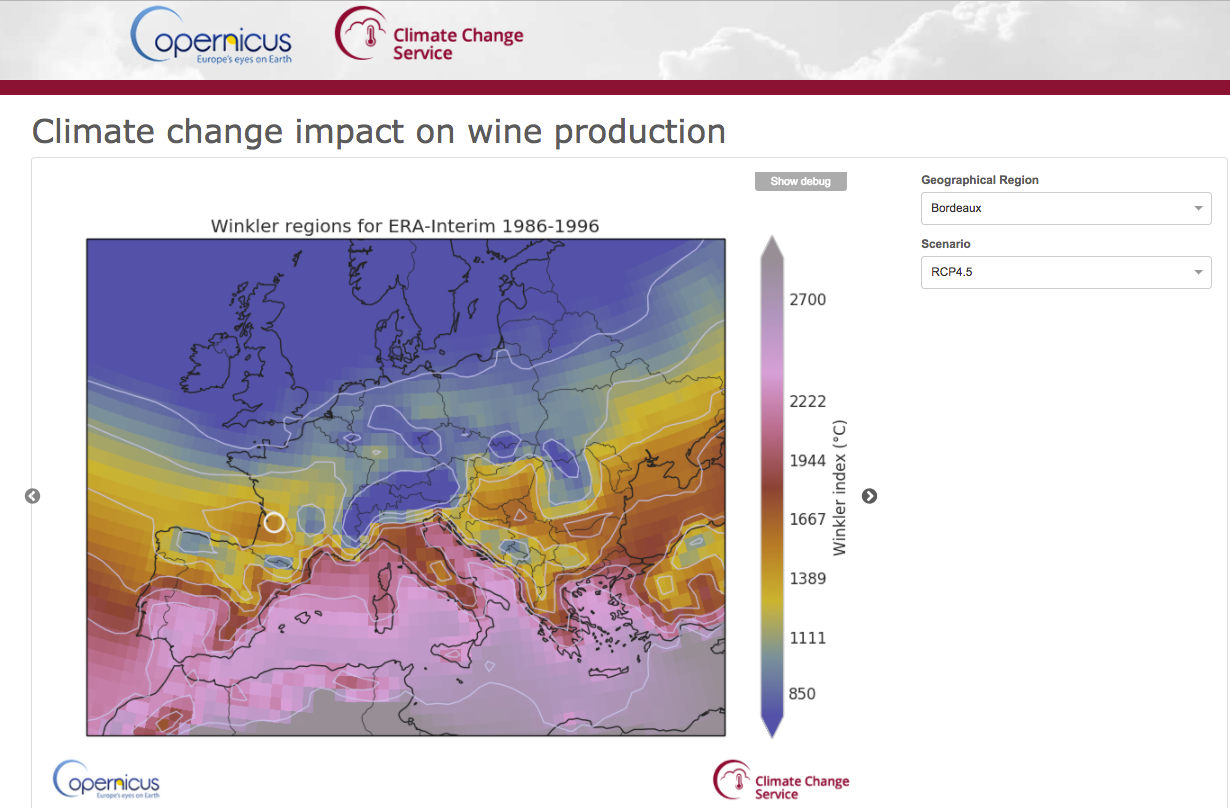
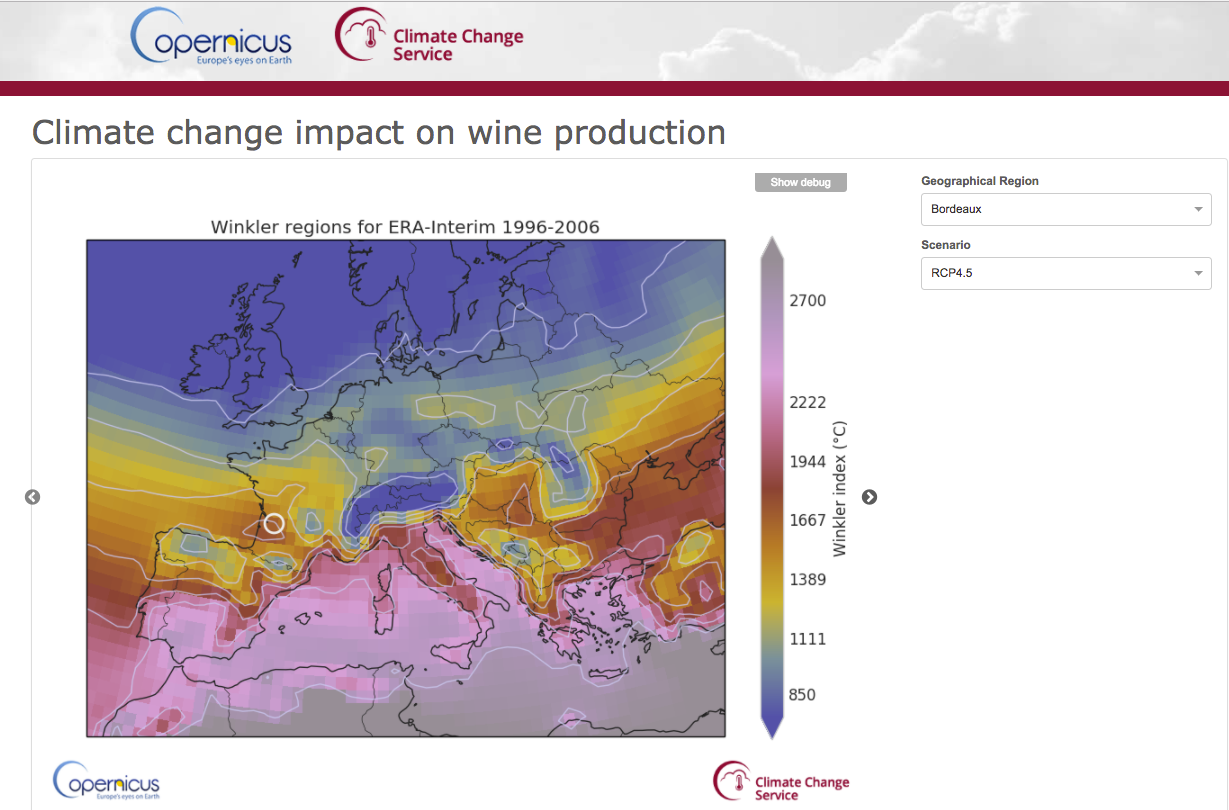
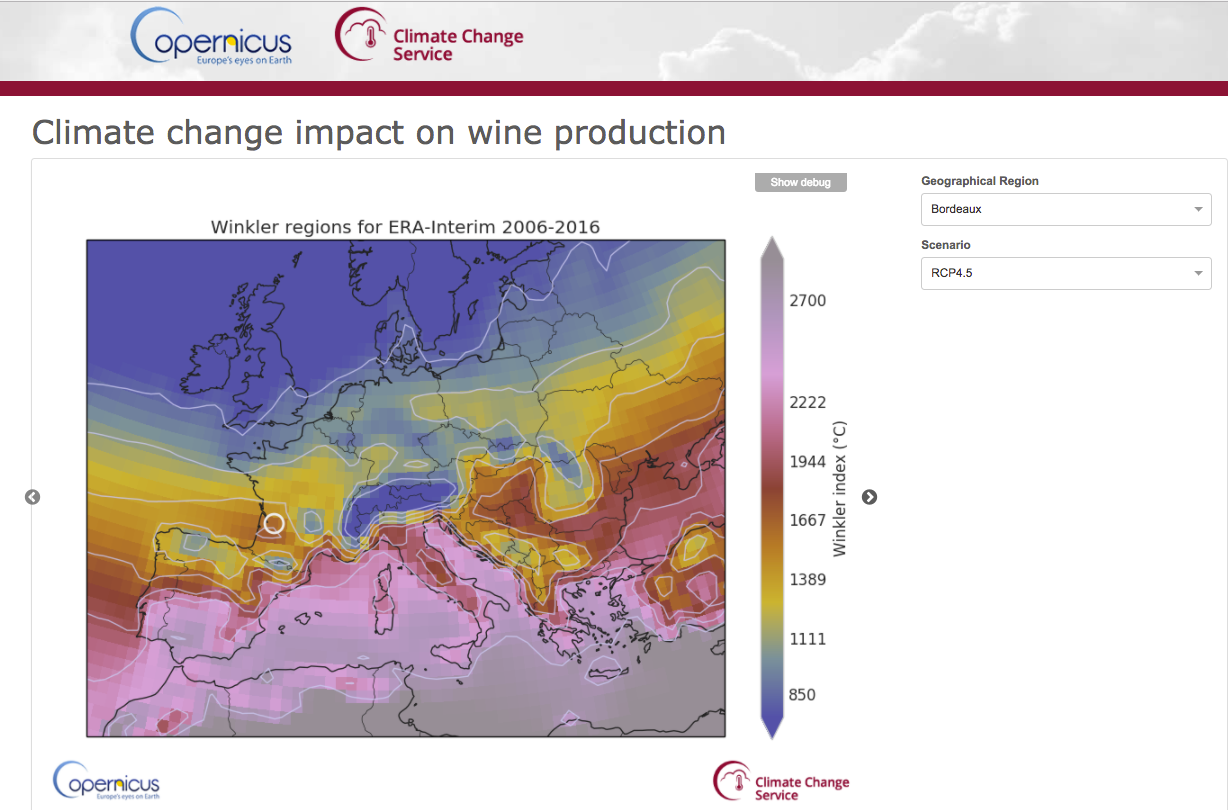
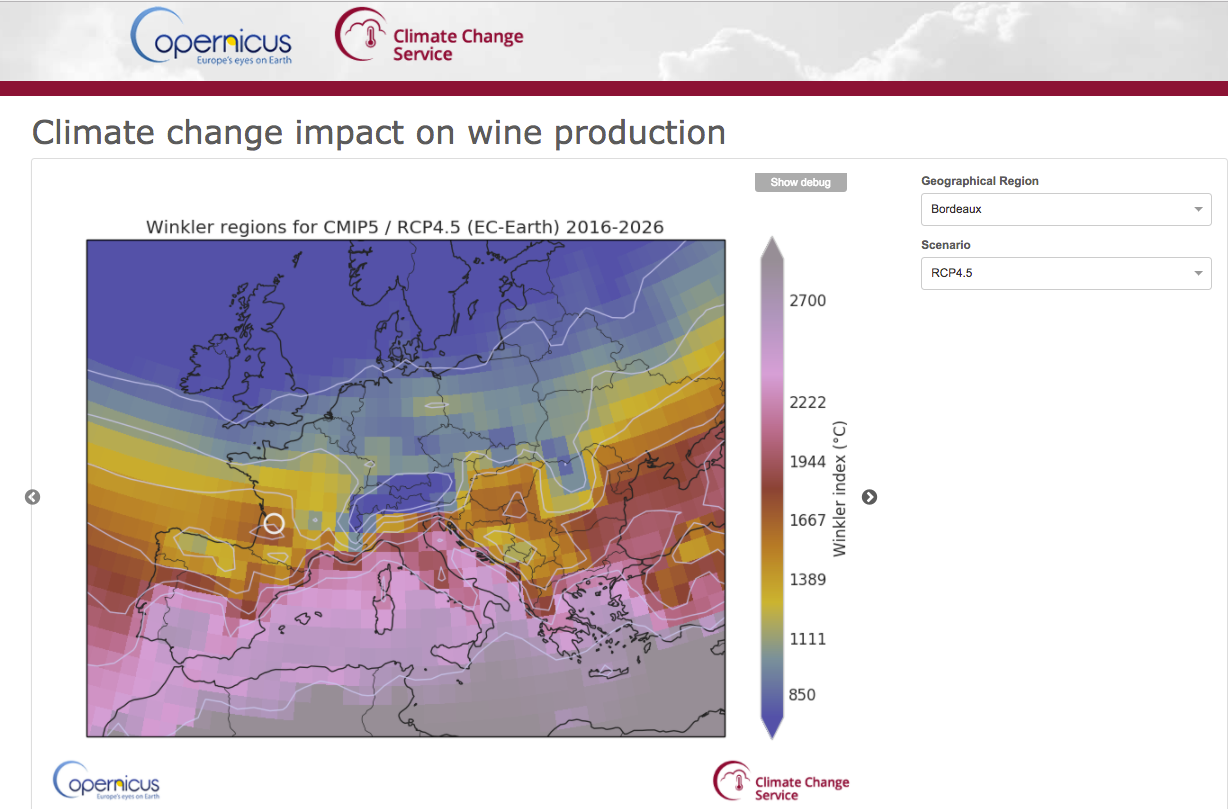
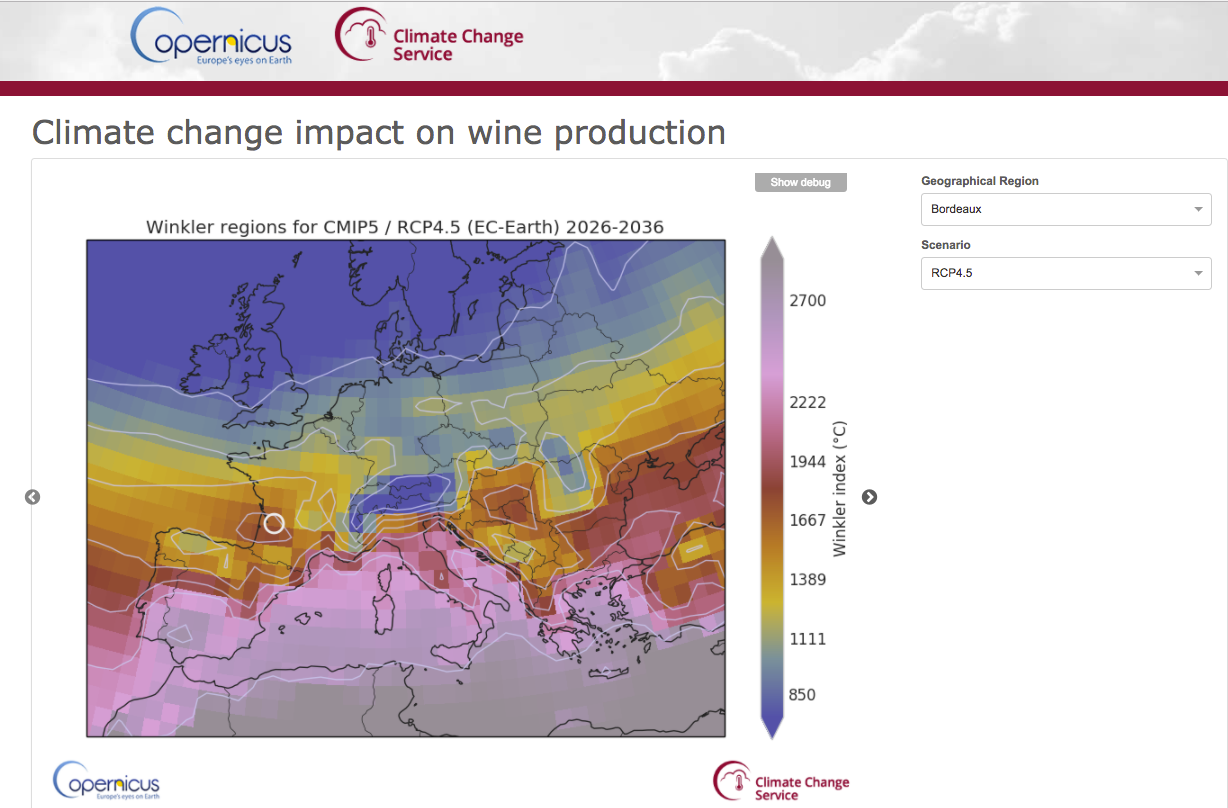
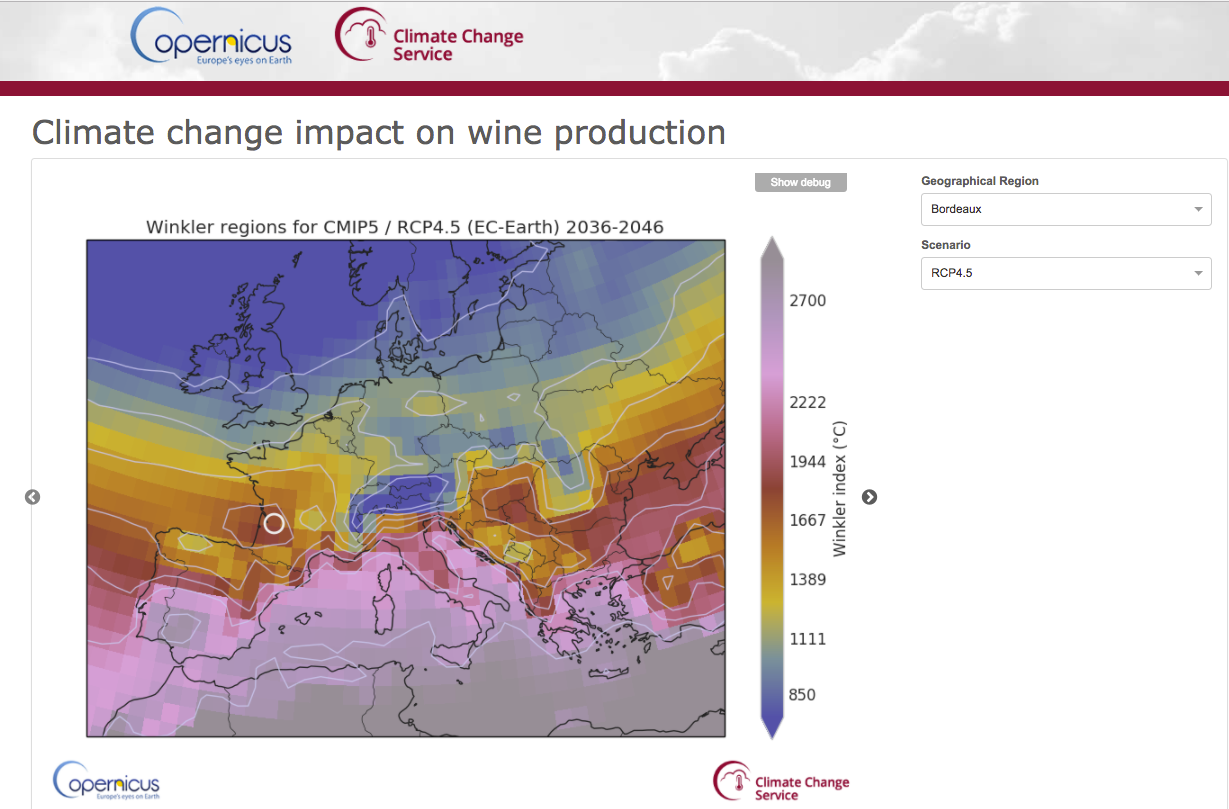
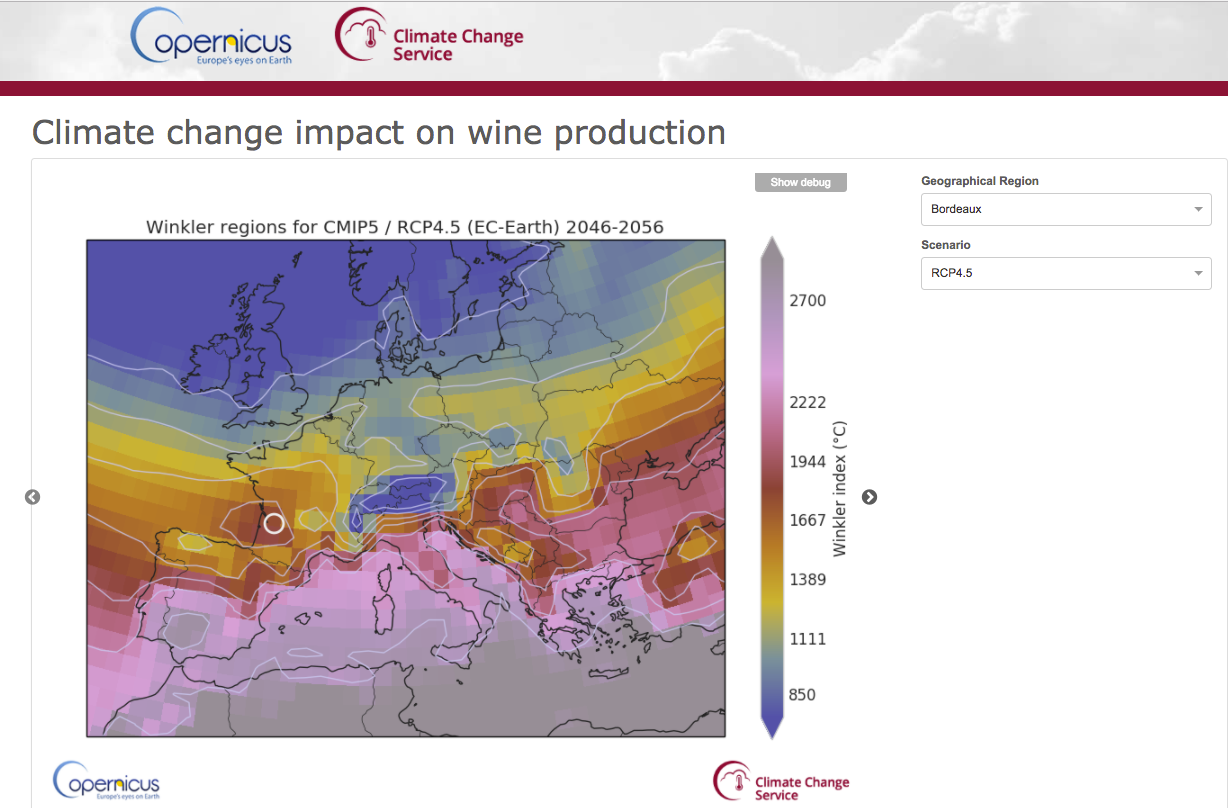
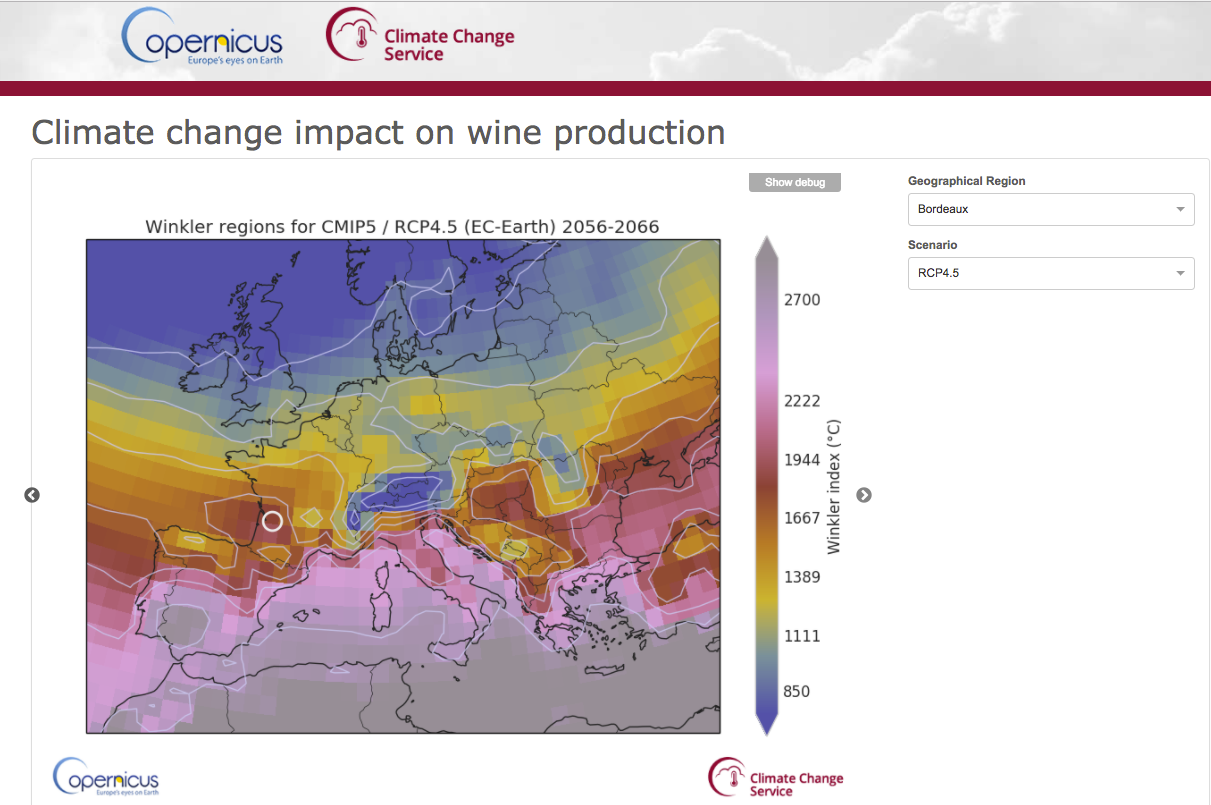
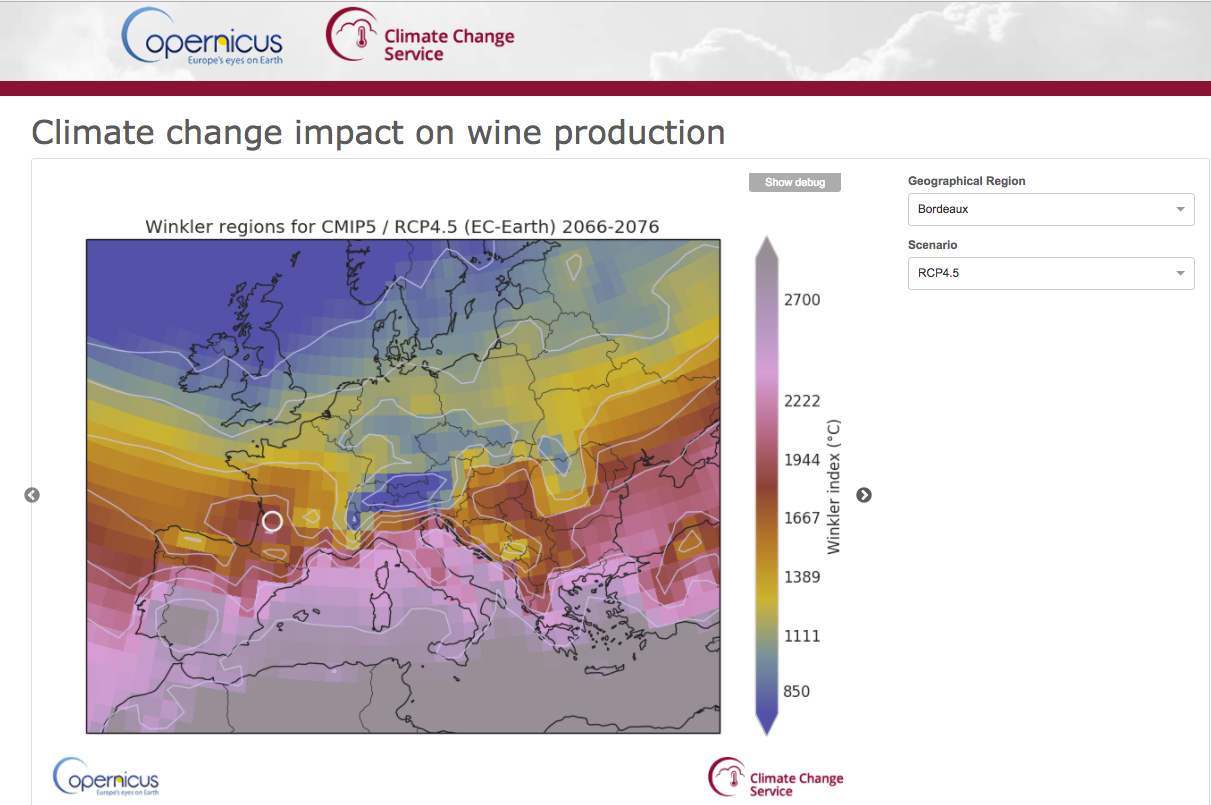
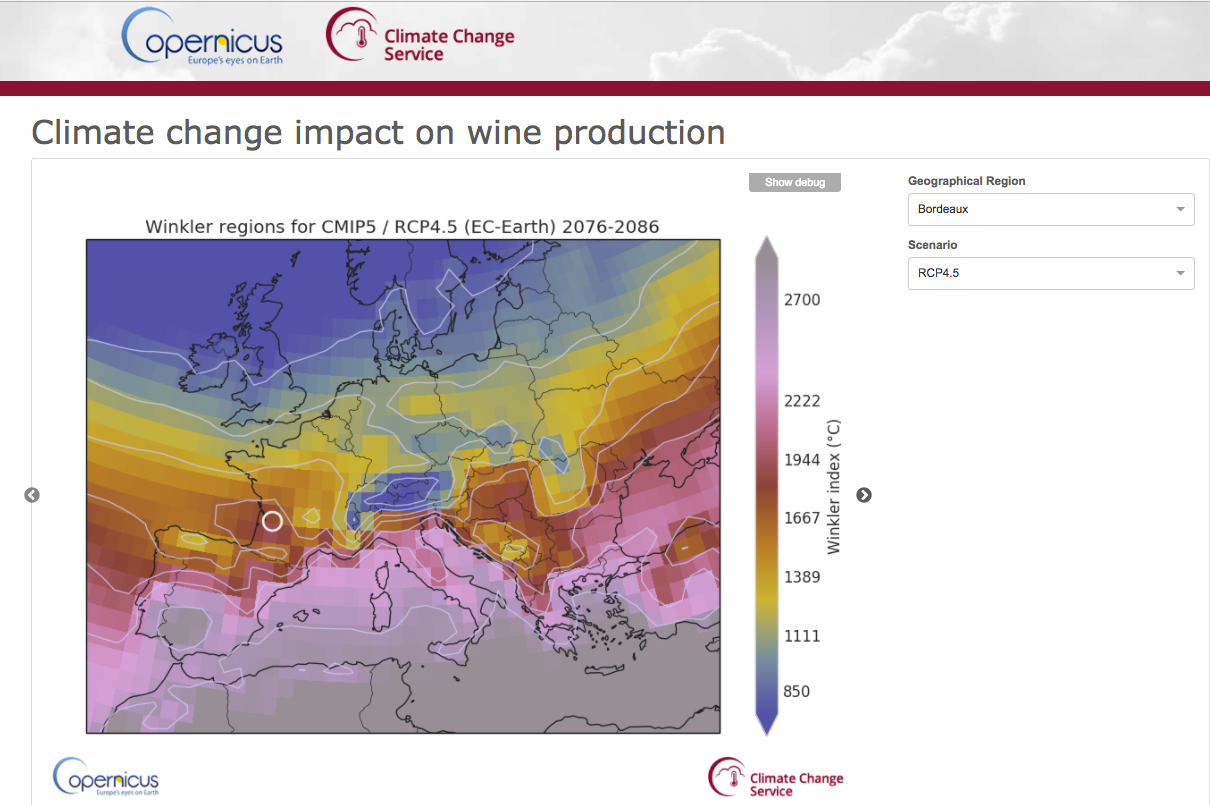
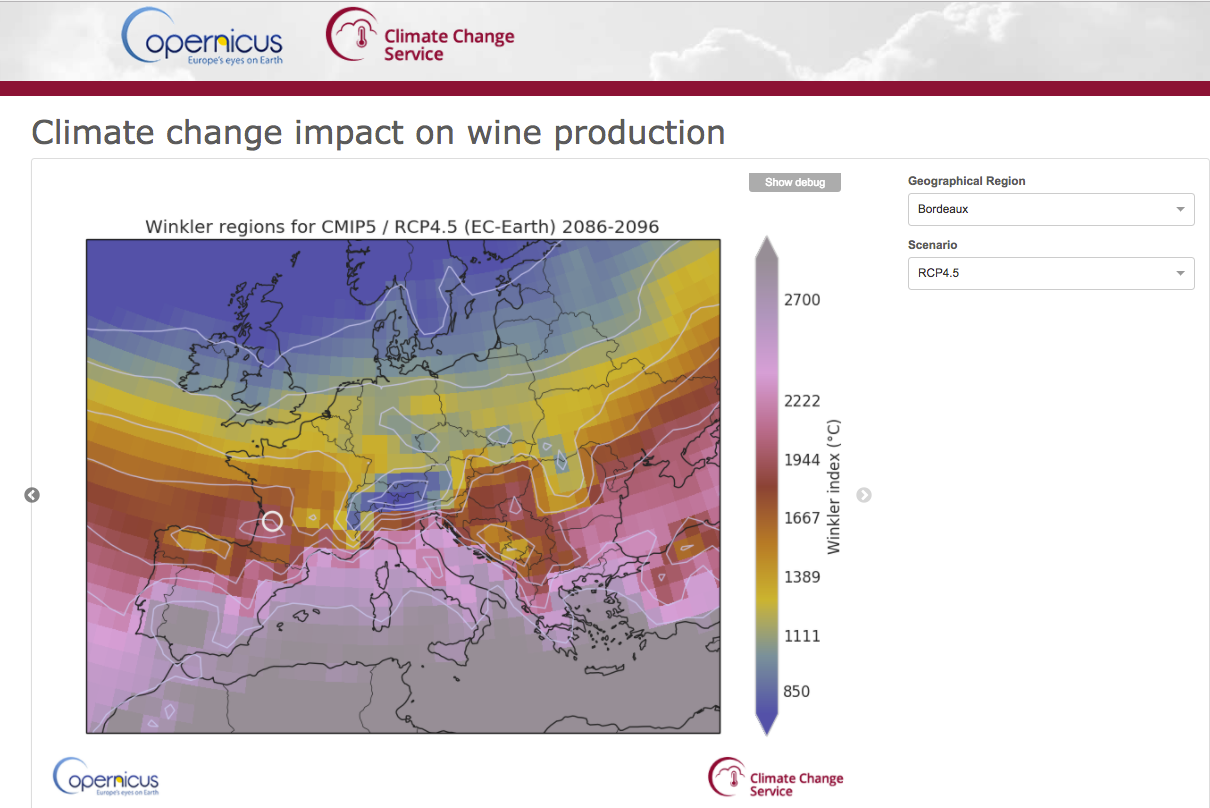
End-User Application
Thank you!
Francesco Nazzaro <f.nazzaro@bopen.eu> - @fnazzaro89
B-Open, Rome - http://bopen.eu (now hiring!)
12th of July, 2017
Facing the challenge of climate change with Xarray and Dask - Europython 2017
By Francesco Nazzaro
Facing the challenge of climate change with Xarray and Dask - Europython 2017
In the last years climate change has become one of the most important topic. For any period longer than a few days science is not able to provide comparable forecasts, but still a lot of useful information about future climate conditions can be gained on time scale of a few months to even several years. Climate forecast and climate projections data are quite complex to analyse and represent. The Python science ecosystem proves extremely effective as a platform to retrieve, analyse, process and present this type of data. The backbone of the platform is the n-dimensional array library xarray that provides the perfect mix between pandas data structures and dask performance and parallelization. Reliable climate forecasts and climate projections are now available from the Copernicus Climate Change Service, operated by ECMWF, that will become the central hub for European effort in study and mitigate climate change impacts. The service also provides access to an open cloud platform, the CDS Toolbox, that is based on the Python 3 xarray/dask/pandas stack. In this talk I will present how to retrieve, analyse, process and display climate data in a generic use case with xarray and with the Copernicus CDS Toolbox.
