ELK Based Realtime Log Searching & Stats Service
About US
Service:
Log Searching, Stats and Data visualization as a Service.
Team:
凌霄( @craftsman凌霄 )
高英举( @Gary的影响力 )


About Our Users
规模:每天32亿条日志,2TB
Why ELK?
Long Long Ago:
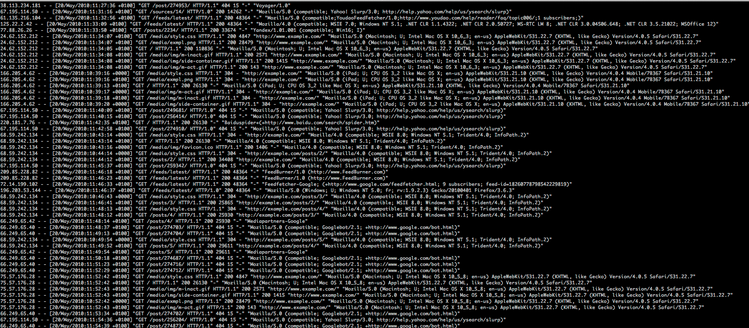
- 多种日志:Apache, Nginx, Mysql, Hadoop, App
- 海量日志: KB -> MB -> GB -> TB
- 散落的日志:node_A/path_x, node_B/path_y, node_B/path_z, node_B/path_m
- 运维困难:cat, tail, grep, sort, shell, python
- 非实时: 小时/天级别
Why ELK?
In the Future:
- 多种日志 vs All in One
- 海量日志 vs All in One
- 散落的日志 vs All in One
- 运维困难 vs Flexible and Robust Searching, Stats, Visualization
- 非实时 vs Near Realtime
Why ELK?
Use Cases : Searching
- Specific Value : url,uid, http status code, timestamp, request header, error msg,
- Range :[400 TO 416], 15 minutes ago to Now, Last 3 days,
- Fuzzy : video*, vid?o,
- Fulltext : Pages, Blogs, Posts, Comments,
- Chinese: 优衣库, 莆田系医院,
Use Cases : Stats
- 最近5分钟5XX的数量
- 最近30分钟某个服务器上404的数量
- 用户访问最多的url TOP N
- 网站用户的地区,ISP分布
- 最近1天各个ISP的服务质量趋势图
- 今天Android, Iphone的用户请求占比是多少?
- 用户在用哪些版本的微博手机客户端,哪个版本错误最多?
- 85%, 95%, 99%的用户访问延迟各是多少?
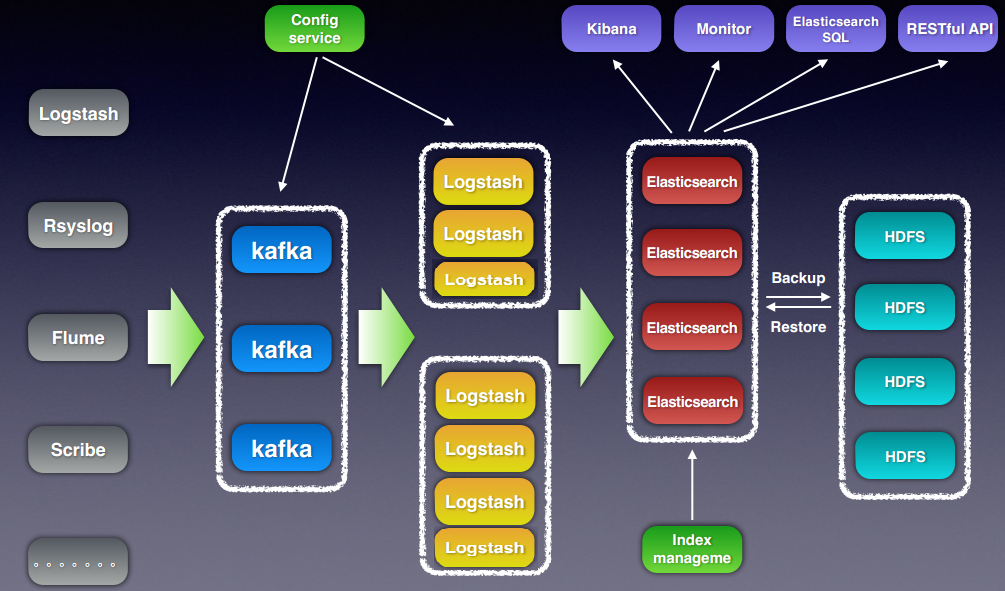
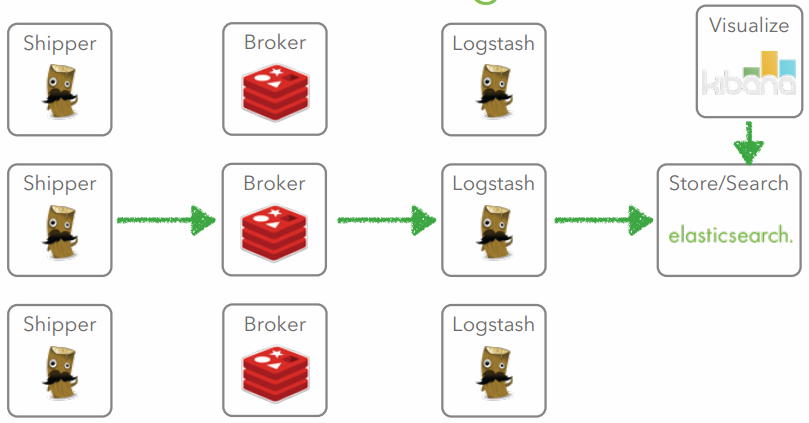
Service Architecture
ELK Intro
Brief Intro
- Scheme-free, REST & JSON based document store
- Distributed and horizontally scalable
- Search, analyze in real-time.
- based on Lucene
- Open Source: Apache License 2.0/ Java
Zero Configuration- Many Plugins in Community
Brief Intro
- Collect various data
- Parse and enrich data
- Output to a variety of endpoint
- Plugins: Inputs, Filters, Outputs
- Easy, Flexible Configuration
- Open Source: Apache License 2.0/ (J)Ruby
see more: http://logstash.net/
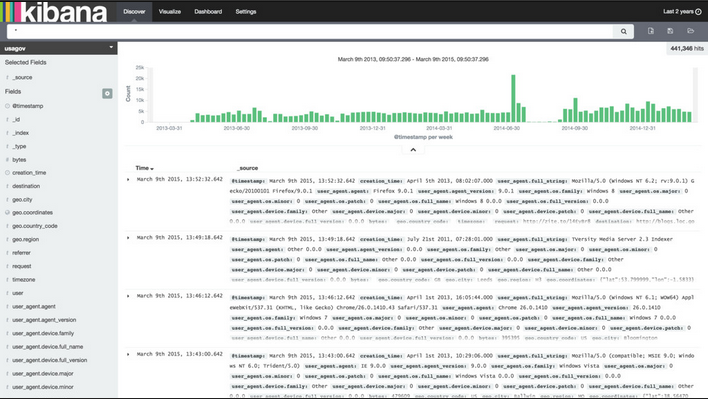
Brief Intro
Kibana 3
- Use Elasticsearch Facets
- Visualize data
- interactive
- Flexible and powerful
- Dashboards,Panels
- Execute queries and show results
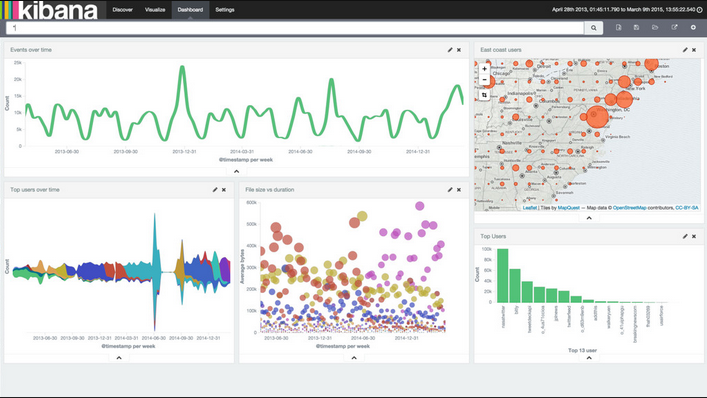
Kibana 4
- Reinvent Kibana
- Use Elasticsearch Aggregations
- More Flexible and More powerful
- Discover, Visualize, Dashboard
- Share Visualizations
Come to Work Together
Architecture
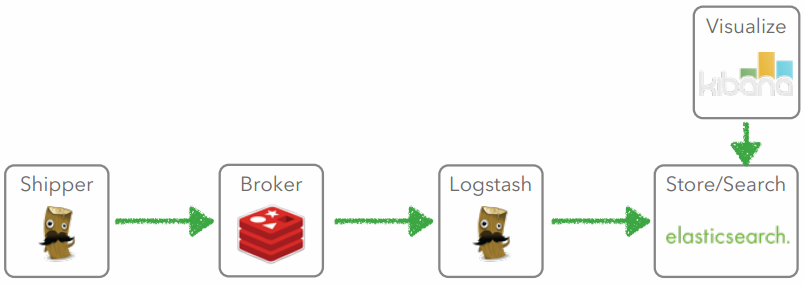
Distributed Log Analysis
Case 1

Indexer
Shipper
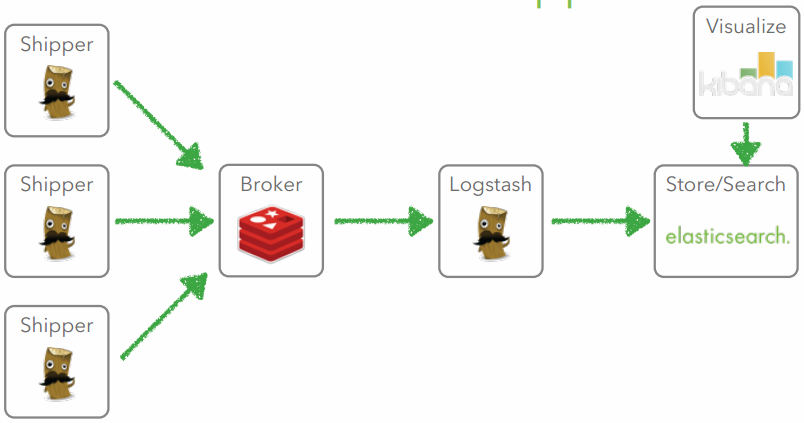
Case 2
Indexer
Buffer
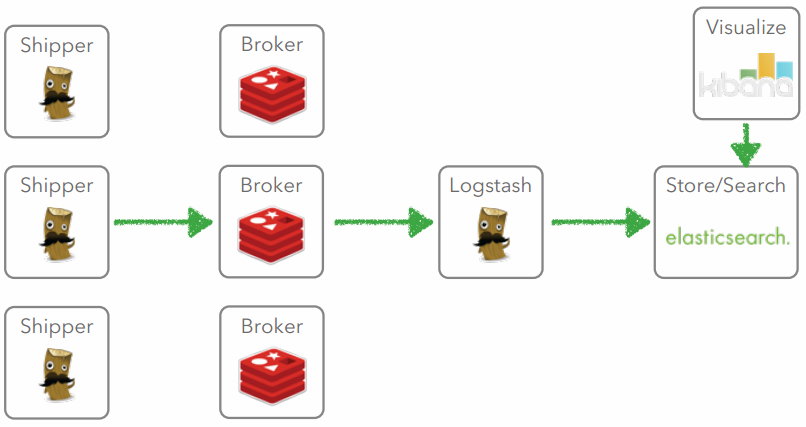
Case 3
Case 4
Case 5
Case 6
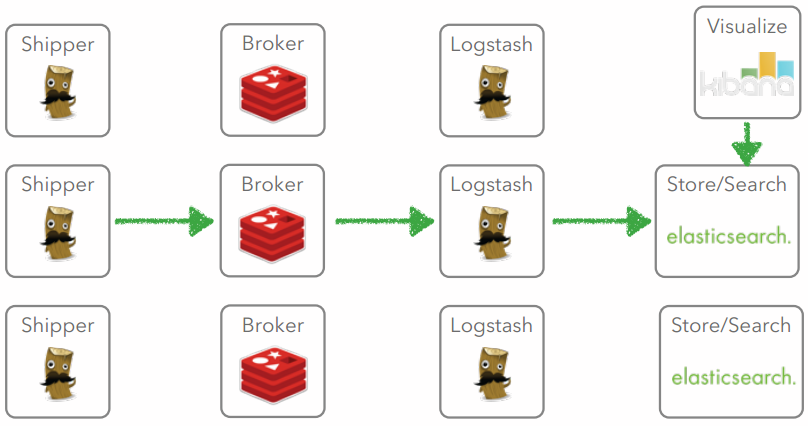
Scale ELK is Easy !!
Getting Started is Simple
Install ES 1.7.0
1. wget https://download.elastic.co/elasticsearch/elasticsearch/elasticsearch-1.7.0.noarch.rpm
2. rpm -ivh elasticsearch-1.7.0.noarch.rpm
3. service elasticsearch start
4. curl -X GET http://localhost:9200/
Install Kibana 3.1.0
1. cd to your web server's ( e.g. nginx) www root
2. wget https://download.elasticsearch.org/kibana/kibana/kibana-3.1.0.tar.gz -O kibana-3.1.0.tar.gz
3. tar zxvf kibana-3.1.0.tar.gz
4.configure elasticsearch host in config.js
5. open your web browser with url http://your_server/kibana-3.1.0
Install Logstash 1.5.3
1. wget https://download.elastic.co/logstash/logstash/logstash-1.5.3.tar.gz
2. tar zxvf logstash-1.5.3.tar.gz
3. cd logstash-1.5.3 && bin/logstash agent -f logstash_test.conf
# logstash_test.conf : a simple configuration example of logstash
input {
    stdin {}
}

filter {
    grok {
        match => [ "message", "%{NUMBER:http_status} %{WORD:method}" ]
    }
    if [ http_status ] =~ /^[4-5]\d\d/ {
        drop {}
    }
}

output {
    stdout { codec => rubydebug }
}
Getting Started More Quickly and Easily Using Docker
see:
http://dspgit.cluster.sina.com.cn/dip_elk/elk_user_docs/blob/master/tutorials/setup_elk_using_sce.md
The Question is :
Is This Enough ?
Why US ( DIP ELK ) ?
Why US (DIP ELK) ?
- Do more and Do Better
- 提升服务质量
- 增强易用性
- 提供新功能
- 我们经历过的坑和坎儿
- 未来努力方向
在ELK的基础上为用户提供更好的服务
Better ELK,More Than ELK
Do More and Do Better
- 提升服务质量
- 增强易用性
- 提供新功能
提升服务质量
- Elasticsearch 优化
- Logstash 优化
- ES Index管理系统
- 数据备份
- 监控报警
Elasticsearch优化
- System Level
- swap优化
- max open files
- Jdk1.8
- App Level
- ES_HEAP_SIZE
- 调整shard, replica数
- String默认not_analyzed
- 使用doc_values
- 定制index template
- 调整indexing, merge, refresh,allocation,security等相关参数
Logstash 优化
- 使用supervisord管理logstash
- 调大 filter worker number(-w)
- Logstash Conf:
- Batch Input : redis, kafka
- Batch Output: elasticsearch
- 尽量不用非官方插件和logstash-filter-ruby
Logstash Conf example
input { ... }
filter {
    if [ip] {
        geoip2 {
            source => "ip"
            target => "#ip"
        }
    }
    if [ua] {
        # <device_type>__weibo__<weibo_version>__<os_type>_<os_version>
        # iPhone7,1__weibo__5.1.3__iphone__os8.1.3
        # iPad3,4__weibo__4.5.0__iphone__os7.0.4
        # Xiaomi-MI 2A__weibo__4.3.0__android__android4.1.1
        # samsung-GT-N7100__weibo__4.3.5__android__android4.3
        # OPPO-R850__weibo__4.3.0__android__android4.2.2
        grok {
            match => ["ua", "%{DATA:agent_device_type}__weibo__%{DATA:agent_weibo_version}__%{DATA:agent_os_type}__%{DATA:agent_os_version}$"]
        }
    }
}
output {
    elasticsearch {
        index => "weibo-client-video-%{+YYYY.MM.dd}"
        host => [ "1002.es.dip.sina.com.cn:9200" ]
        protocol => "http"
        workers => 2
        flush_size => 20000
    }
}
Es Index管理系统
- 定期Create Index
- 定期Optimize Index
- 定期Close Index
- 定期Delete Index
- 定期Snapshot Index to Hdfs
监控报警
- System Level 使用公司内部的Sinawatch服务
- 磁盘满,坏
- 宕机
- Load, Mem
- App Level(Logstash, Kibana, Kafka, Celery) 自己开发+用开源产品
- Es:JVM Heap Usage, node number, bulk reject rate
- Logstash,Kibana: service status
- Kafka: topic consumer offset lag
- Celery: Flower
增强易用性
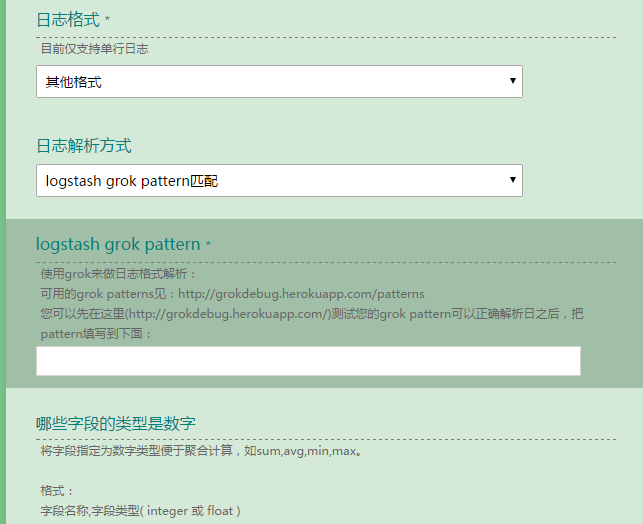
我们面临的易用性难题:
- IP解析成地区、ISP信息不准,完全没有参考意义
- 用户日志接入流程复杂,沟通困难。
- 部分数据可视化需求得不到满足,Kibana配置难度大
如何增强易用性:
新浪IP库+ logstash-filter-geoip2
用户日志接入自动化+Es Index管理自动化
官方Kibana 3 -> 官方Kibana 4
logstash-filter-geoip2
现状:
- IP解析成地区、ISP信息不准,完全没有参考意义
- Logstash 社区中没有直接可用的方案
- 现成的新浪IP库
方案:
- 研究maxmind公司的Geoip2 IP库的生成方法
- 通过开发利用新浪IP库生成Geoip2 IP库
- 结合maxmind提供的开源Geoip2 API开发一个logstash-filter-geoip2插件
logstash-filter-geoip2
我们遇到的困难:
- 开发横跨 Ruby/Python/Perl
- 公司服务器搭建较新版Ruby, Perl环境困难
- 1.4.5.0 ~ 1.4.7.0 如何转换成 net/mask的形式
logstash-filter-geoip2
start ip ~ end ip 如何转换成 net/mask的形式
1.4.5.1 ~ 1.4.5.255 TO 1.4.5.0/24
1.4.5.1 ~ 1.4.7.255 TO 1,4.5.0/24, 1.4.6.0/24
1.4.0000 0101.1
1.4.0000 0111.255
logstash-filter-geoip2
start ip ~ end ip 如何转换成 net/mask的形式:
Binary bit -> BTree:
- Height : 32 (IPv4)
- Node/Leaf: 0 OR 1
- Left Child: 0
- Right Child: 1
- IP def: From Root to Leaf
- If IP_A < IP_B, IP_A is on the left of IP_B
http://dspgit.cluster.sina.com.cn/dip_elk/maxminddb_geoip2/blob/master/iprange2networks.py
logstash-filter-geoip2
start ip ~ end ip 如何转换成 net/mask的形式
59.43.44.148 ~ 59.43.45.107 ?中国 北京 电信
59.43.44.148/30,
59.43.44.152/29,
59.43.44.160/27,
59.43.44.192/26,
59.43.45.0/26,
59.43.45.64/27,
59.43.45.96/29,
59.43.45.104/30
logstash-filter-geoip2
我们的成果:
- 使Logstash能够以更简单容易的方式利用上公司的IP库。
- 新IP库的IP解析准确率与公司IP库保持一致。
- IP库解析平均速度为6600+个/秒,效率较之前提高了2.3倍。
- 提供了能将公司的IP库转换maxmindDB格式的IP库的工具。
- 在原公司IP库提供PHP API的基础上,我们还可以通过C/Java/Perl/PHP/Python/Apache/Go/Lua/Ruby/Scala等API来使用公司的IP库。
logstash-filter-geoip2
Open Source
logstash-filter-geoip2已开源并与logstash官方插件logstash-filter-geoip合并。现在是logstash-5.0.0 builtin plugin。
官方博文:Logstash Lines: GeoIP filter enhancements
https://www.elastic.co/blog/logstash-lines-2016-05-02
简化用户接入 v1.0
提供新功能
- 中文分词功能
提供新功能
Es standard analyzer中文分词:
”美国打伊拉克“—>"美",”国“,”打“,”伊“,”拉“,”克“
ik analyzer 中文分词:
”美国打伊拉克“—>”美国“,”打“,”伊拉克“
未来努力方向
- 日志接入全自动化:即点即用
- 完整的用户服务web系统(Portal)
- 用户数据层面的报警
- 服务性能优化
- 数据安全/用户隔离
- 结合spark/hadoop体系
- 应用docker化(logstash,kibana)
- ELK on Mesos
总结
- Elasticsearch总结
- Kibana总结
- 大数据处理架构总结
- 大数据产品总结
Elasticsearch 总结
- 处理大数据量(十亿级别以上)并且需求复杂(多次group by,求百分比)的query时CPU资源消耗大(导致query不能并发,集群不可用)、时延长(分钟以上)
- query的执行没有资源限制
- query一旦执行,无法被kill掉
Kibana 总结
- 开源社区里最好的数据可视化产品
- 在数据可视化配置上仍然不够直观,简单
大数据处理架构总结
- 限流:在接入数据环节限流,防止数据爆发和不必要的资源消耗
- 自动化数据异常监控:无数据,趋势异常(波峰、波谷、数量级)
- 智能化:用机器学习判断数据趋势异常
- 自动化不是银弹,与业务紧密结合的部分很难自动化
大数据产品总结
- 三分技术,七分数据,得数据者的天下
- 服务高价值密度(数据分析的价值/成本)的数据
Thanks !
References
1.http://www.elasticsearch.org
2.http://logstash.net
3.https://speakerdeck.com/elasticsearch/scale-12x-introduction-to-elasticsearch-logstash-and-kibana
4.http://garyelephant.me/article/details/23750563
5.https://speakerdeck.com/elastic/whats-cookin-in-kibana-4
6.http://www.docker.com
ELK Based Realtime Log Searching & Stats Service
By Gary Gao
ELK Based Realtime Log Searching & Stats Service
Introduction of distributed Log Collect & Analysis System built by Elasticsearch + Logstash + Kibana


