
Giordano Pezzola
Computer Science Engineer
Analyzing delays and power consumptions of mobile web browsers and proposing techniques to reduce both of them.
giordano.pezzola@gmail.com
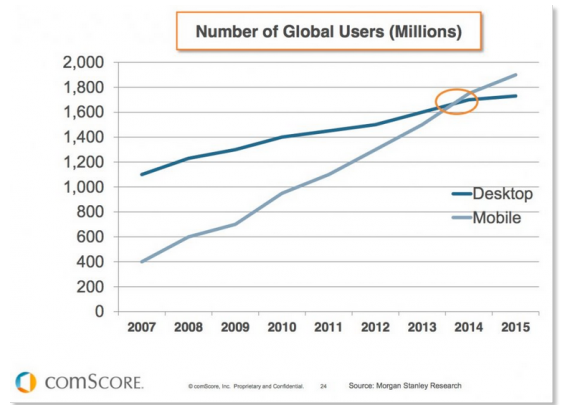
According to recent statistics from smartinsights.com mobile is overtaking fixed internet access.
Q: how to cope with high # of mobile browsers?
A: we provide a mobile version of our page!
Steps we will follow
Android Developer Phone 2 unlocked device designed for advanced developers. ARM CPU, 288MB RAM, 802.11 b/g WiFi, 3G network. Can't boot without battery inside.
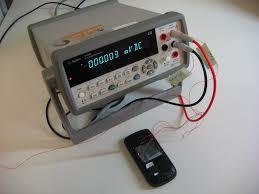
High-precision digital multimeter Agilent 34410A
Sampling rate 1kHz
SCPI interface (tests automation)
Multimeter hooked up to phone's battery that measures the phone's energy consumption as the phone loads and renders web pages.
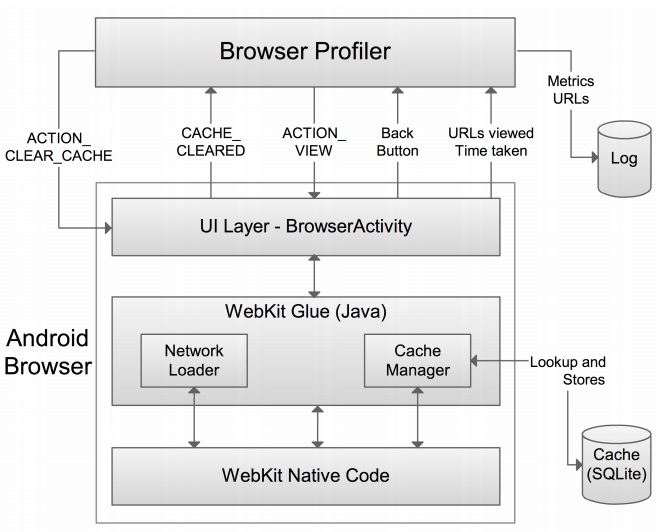
Two components:
The Profiler takes as input URL P and the number of iterations n.
User taps a button to start profiling.
Profiler asks the browser to load the web page P in NO CACHE MODE.
Profiler forces the browser to clear its cache by sending ACTION_CLEAR_CACHE intent.
Browser answers the profiler with an CACHE_CLEARED intent.
Profiler asks the browser to load the web page sending the built-in ACTION_VIEW intent.
After the page has been loaded the user presses back button so the Profiler Activity returns to foreground (active).
Steps from 3 to 7 are repeated n times.This represents loading n times the page in NO CACHE MODE
Now the cache contains all the elements in the webpage. Profiler asks the browser to load the page again n times (repeat steps 6 and 7 for n times without clearing the cache). This represents loading n times the page in CACHE MODE
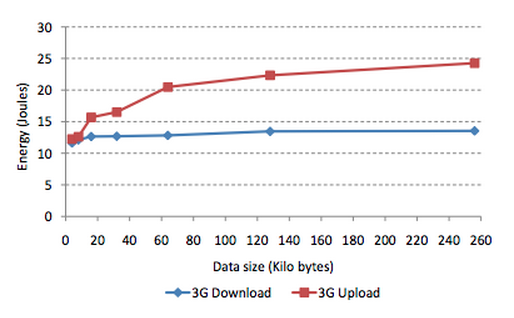
Up and download both require and initial setup that absorbs 12 joules.
Varying the payload sizes:
Download energy remains almost constant.
Upload energy increases with the increase of transferred data.
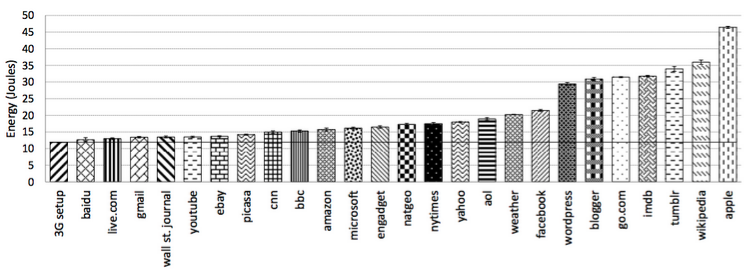
Energy consumed visiting top websites. First column from the left shows energy consumed for the setup of a 3G connection.
N.B. Apple, Tumblr, blogger and WordPress do not have a mobile website, this negatively affects performances.
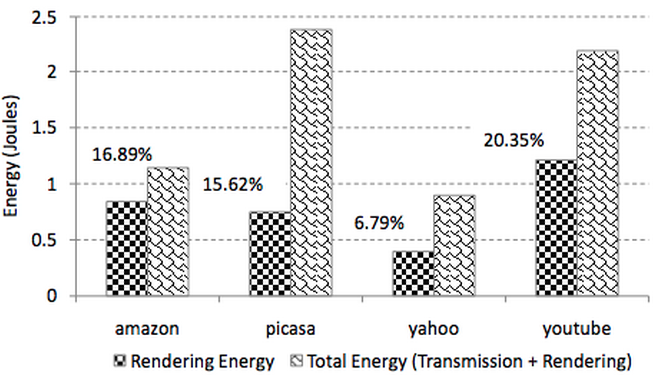
Websites with a lot of text, very little JavaScript and no large images consume little energy to render (for example baidu or aol). Amazon contains a product image that absorbs more energy. Websites like Yahoo or Youtube that contains a lot of images, JavaScript and CSS have a significant increase on required energy to render.
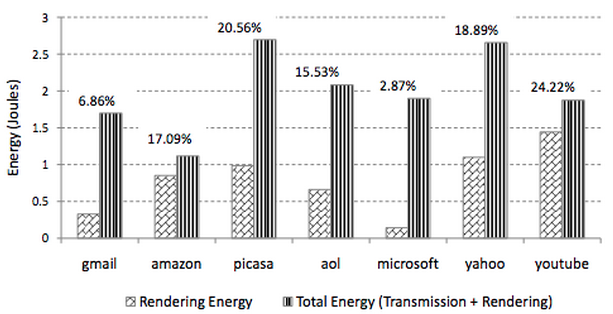
Energy consumed by images. Left bars energy used for rendering cached images, right bars total energy spent on images. The percentage numbers refer to the total energy needed to render images as a fraction of the energy for rendering the entire page.
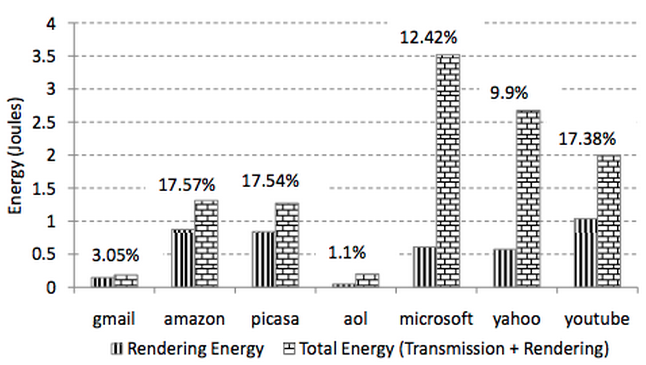
Youtube makes an heave usage of JavaScript which causes significant energy consumption. N.B: Only cachable web pages are shown.
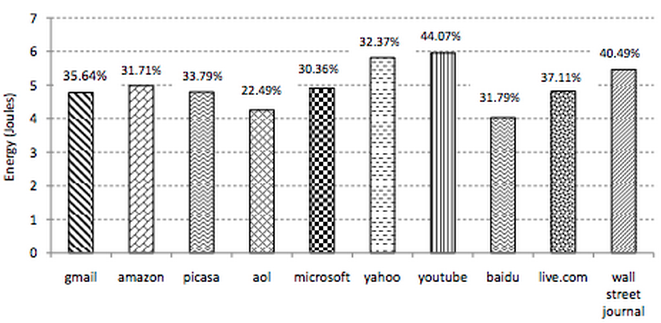
The rendering cost of CSS depends on the number of items styled using CSS. Amazon has a high CSS rendering cost (17.57%) since about 104 items use CSS. Gmail has few CSS effects so it saves a lot of energy. AOL and Picasa both contain large images, the difference between them is that Picasa uses CSS to (inefficiently) position images, instead AOL uses HTML tables. Microsoft and Yahoo use big CSS files and this causes a very high transmission energy cost to download them.
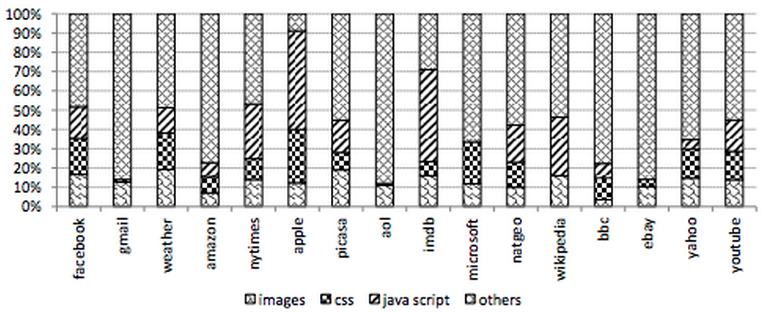
General trend is that CSS and JavaScript are the most energy consuming components in the transmission and rendering of a website. Website with lot of CSS and JavaScript code will not take advantage of wireless evolution technology since they waste a lot of energy on rendering.
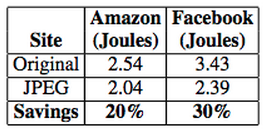
Using these guidelines allows to reduce power consumption up to 30%
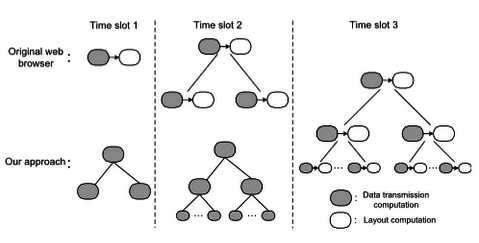
In a way that the browser can first run computations that will generate new data transmissions an retrieve this data; than the 3G radio can be switched to IDLE and all the layout computation can be executed. This approach best suits to web pages requiring a long processing time.
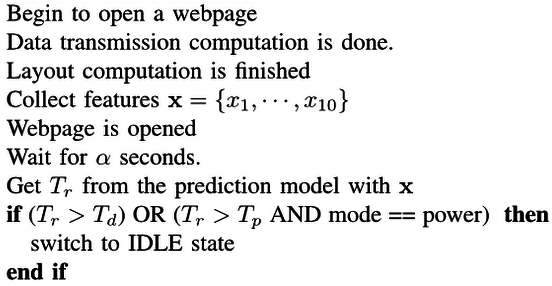
Consists in estimating user reading time of a webpage after it is downloaded and in using this value to compare it with a threshold deciding to switch the radio to IDLE mode. This allows to save energy, to reduce delays and to increase network capacity as network resources are released earlier.
30% energy savings, 17% shorter loading time, 19.6% network capacity increase
Possible solution: Reorganizing computation concluding all data transmissions before layout computations.
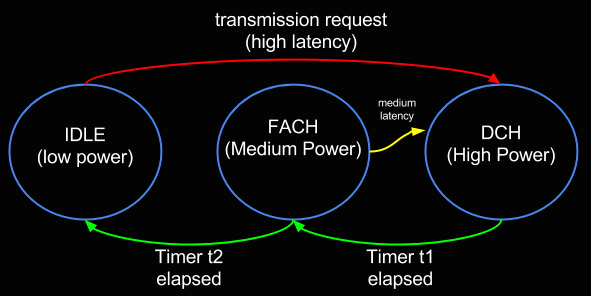
Switching from DCH to idle immediately after data transmission doesn't work, if the next transmission occurs in a short time we would waste more time and power in reestablishing the connection than what we saved.
Data transmissions are spread along the whole webpage loading time.
FACT 1:
FACT 2:
Possible solution: Predicting the reading time of a webpage and switch to IDLE if it is bigger than a threshold.
Timer T2 which controls FACH state is 15 seconds.
Users spend on average more than 20 seconds reading downloaded web pages.
FACT 1:
FACT 2:
Given FACT 2 remaining in FACH state only wastes power.
FACT 3:
Prevision based on a machine learning approach, the model is trained offline for each user and then deployed inside the prediction program embedded in the browser.
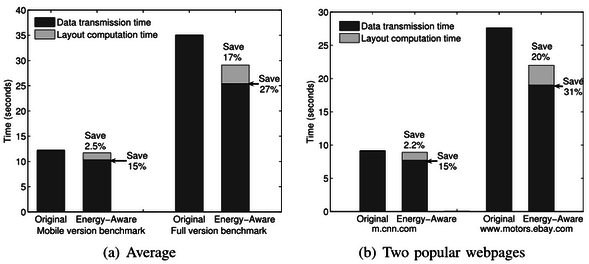
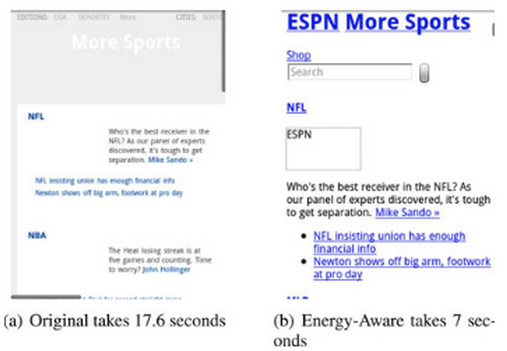
reorganizing computation sequence allows to reduce data transmission time by 15% (mobile version) and 27% (full version). Avoiding intermediate displays allows to reduce loading time by 15% (mobile version) and 31% (full version).
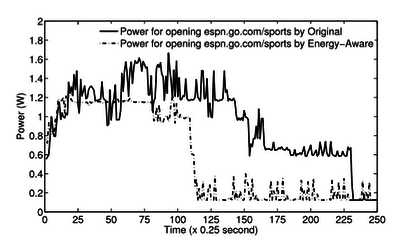
transmission time reduction from 130s to 100s. After 100s switch to IDLE. Standard keeps FACH status from 150 to 230s consuming 0.6 W more power. Switching to IDLE during reading time showed an average 30% power reduction.
visiting espn.com/sports page the modified browser shows the display 10.6 seconds earlier than the original web browser, showing the same content as the original browser but with a worst layout. The final screen is reached 5.9 seconds faster than the original browser and the final result is the same.
Using 10 users 1-week web access history. Each data trace records the web page reading time and key features. Rt of 47% webpages is > Tp (9 s) so switching to idle can save power but may cause delays. Rt of 32% webpages is > Td (20 s) so switching to idle can save power without delays . Tr of 30% of web pages < 2 seconds so we excluded from data traces.
Test & Training set
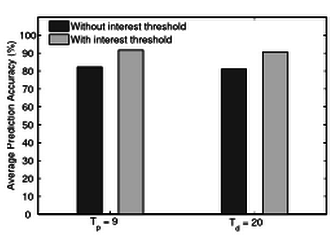
Prediction accuracy is defined as the percentage of correct predictions. A prediction is correct if predicted time and real value are both larger or smaller than a value Td (20 s) or Tp (9 s).
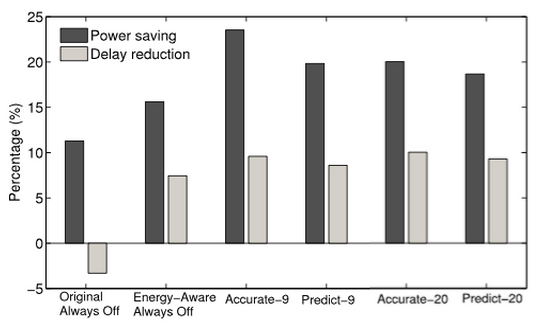
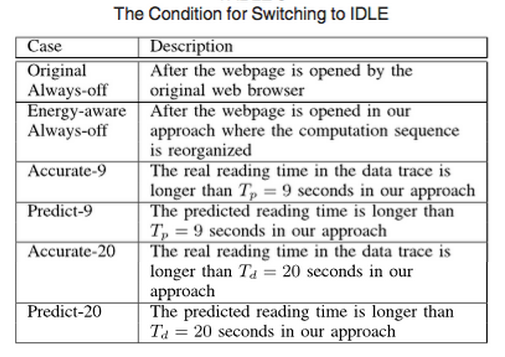
Accurate-20/9 are the real reading times used to obtain an upper bound.
The algorithm is very effective and precise. about 25% power and 10% delay savings.
Smartphone limited computational power and energy constitute a bottleneck
FACT:
SOLUTION: shifting away the load from the smartphone using a proxy.
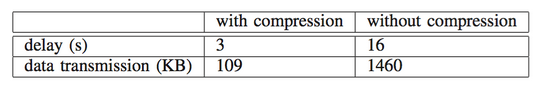
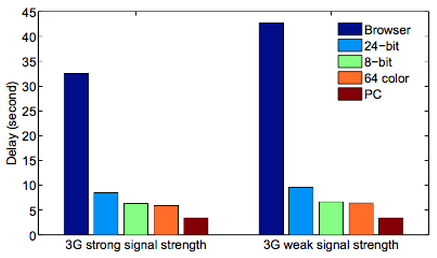
80% delay reduction if compared to original browser. compressing images with zlib reduces transmission delay significantly.
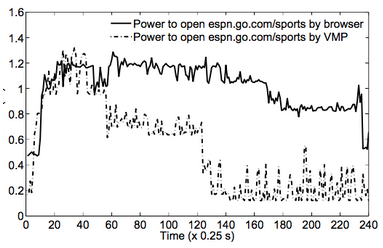
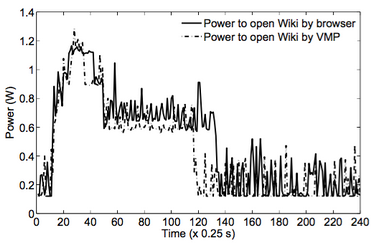
Avoiding to repeatedly download data and executing cpu calculations VMP approach obtains about 45% power savings.
By Giordano Pezzola
Survey on the analysis of mobile browsers energy consumption and presentation of possible solutions to maximize energy savings and reducing delays.