Visual Text Analysis
Domain: Reviews / (Medical) Reports
Rose Plots
User-directed Sentiment Analysis: Visualizing the Affective Content of Documents
Data used?
- for case Study
- Amazon reviews ( 5 diffrent products )
- Documents, sentences / phrase
- Diffrent formats ( .doc, .xml, ... )
- designed for a varietz of genres ( IN-SPIRE Approach)
Analysis Technique
- Lexical Approach
- compare doc. with a affect lexicon
- lexicon derived from General Inquirer (GI)
- semi-supervised bootstrapping (expand dictionaries)
Visualization Technique
- Multiple Views (inspired by IN-SPIRE)
- Galaxy View
- Two diffrent types of Rose Plots
- large petals encode high affect score
- included box plot into petal
- petals are group (two affect categories)
- unit circle shows deviation of expected value
- Histogram beneath each Ros Plot (number of doc.)
- Correlation Tool ( show distribution of products)
Problems
- no good overview visualization
- no aid to maintain mental map
- not scalable


UTOPIAN
User-Driven Topic Modeling based on Interactive NMF
Data used?
- Case Study
- academic papers (InfoVis VAST)
- Product reviews ( Tv show, Cars)
- newsgroup data ( 20News, well clustered)
- Input for t-SNE
- High Dimensional Vectors
Application Pipeline
SS-NMF
t-SNE
Visualization/
Rendering
- two diffrent threads for t-SNE & SS-NMF
- allows real-time interaction of visualization
Analysis Technique
- Nonnegative Matrix Factorization (NMF)
- advantages
- consistency over multilpe runs
- emipirical convergence
- advantages
- t-SNE (modified)
- reveal implicit groupings
Visualization Technique
- node-link diagram
- Continous visualization
- real time interaction with Algorithm Output
- simulation like behavior

Opinion Seer
Interactive Visualisation of Hotel Customer Feedback
Data Used?
- hotel cutomer review data ( TripAdvisor )
- Hotel Profile
- Customer Profile
- Review data
Analysis Technique
- Feature Based Opinion Mining
- Free Text vs. Ratings
- New Concept of Uncertainty
- reviews have additional value to positive / negative
- Opinion Combination
- based on Subjective Logic
Visualization Technique
- Multiple Visualizations
- Opinion Wheel
- Opinion circle (Radial Visualization)
- Opinion Triangle (Triangular Scatterplot )
- Tag clouds
- organized in a table
- Opinion Wheel


FacetAtlas
Multifaceted Visualization for Rich Text Corpora
Data used?
- Medical Reports (Google Health)
- Article Structure (Paragraphs containing facets)
Analysis Technique
- new entity- relational data model introduced
- data needs to be transformed into model
- extract multifaced entities (name entity recognition)
- construct similarity graph (consine / topic-level similarity)
- create new search indices (lucene)
Visualization Approach
Overall Visuall design
- visualize global and local patterns
- integrate search into visualisation (visual query)
- simply visualize multifacet relationships
Visualization Technique
- Density Map + Multifacet Graph
- visual encoding of data model
- visually simplify data exploration (edge bundling / highlighting)
- interactions to examine data from diffrent perspectives

Time Density Plots
Feature-Based Visual Sentiment Analysis of Text Document Streams
Data Used?
- Two diffrent Types of Data
- missing limited topic coverage
- Web Surveys (50,000 Surveys)
- all possible complaints ( purchase, delivery, product )
- comment on features in detailed way
- Cutomer Web survey
- Rss News Items (16,000 items)
- real-time distribution, repostings
- no specific feature to indentify
- explore spread of Opinion and reasons
- 50 Presidential Election feeds
- Web Surveys (50,000 Surveys)
Analysis Technique
- no domain-dependant sentiment word list
- rely on very general sentiment words
- Linguistic Preprocessing
- Feature Extraction
- Sentiment Word Detection
- Sentiment-to-Feature Mapping (Hybrid approach)
- manually defined syntactic reference patterns
- paired with typed-dependency parsers
- modified distance-based mapping
- awareness of uncertainty (not precise vs. guide user)
Visualization Technique
-
Pixel Map Calendars - ( scatterplot )
- display overall data distribution
- one pixel represents one document
- pixel ploted in bins - color encodes overall sentiment
- axes of bin can have different time unit


- Time Density Plots
- Sequential Sentiment Track - ( rectangular bars )
- preserve temporal order
- whitespace reduction - no overplotting
- certainty encode in bar height
- Time Density Track - ( Area Graph )
- height of curved determinated by distance of two time stamps
- high curves indicates max. Level of Interesst
- Sequential Sentiment Track - ( rectangular bars )
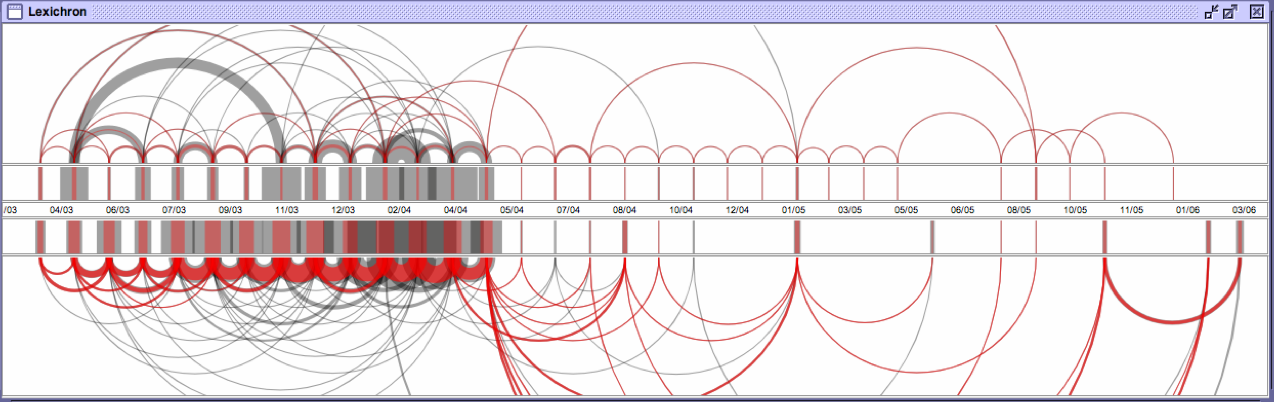
Lexichron
Visual Analysis of Conflicting Opinions
Data Used?
- Amazon Customer Reviews (3.168 Reviews)
- Only 4-5 stars ond 1-2 stars ratings
- about size of Scientific Abstract
- Diffuse Opinions in diffrent Reviews
- based on Da Vinci Code book review
Analysis Technique
- Linguistic Variation (TermWatch, Term Variation graph)
- TermWatch - Clustering (CPCL implemented with SLME)
- Predictive Text Analysis (Decision Trees - SVM )
Visualization Technique
-
Term Variation Graph
- display cluster overview & detail
- time series data ploted in graph


- unfolded View of one cluster (pink Background)

- Time series Data ploted in Graph
- timestamps ploted on edge (year-month)


- Positive Term alongside Negative Terms
- monthwise separation
-
Coordinated View - ( multiple Visualizations, Improvise )
-
Lexichron - Arc Diagram
- top half positive reviews - bottom half negative review
- arcs connect months with common Terms
- arc thickness encodes # of common Terms
- Bar thickness encodes # of Term per Month
- Graph View
- multicolumn Tables
-
Lexichron - Arc Diagram

Pixel Sentiment Geo Map
Visual sentiment analysis of customer feedback streams using geo-temporal term associations
Data Used?
- Broad Number of Application
- Theme park attraction, product surveys, hotel reservations, IT services, movies...
- Web Surveys
- Historic Data (after cutomer Purchase)
- Tested with 52,189 Reviews (96,987 sentences)
- Tweets
- Real-time (reaction to Movie)
- limited to 140 charachters
- tend to have heavy use of abbriviations
- open-ended Data Sources (text streams)
Analysis Technique
- Feature-based Sentiment Analysis (use own algorithm)
- Term Association with Hypothesis Tests (Likelihood Ratio Test)
- Focus on geo-spatial information ( geo-based Term Association )
- Covers almost whole spectrum of frequencies ( Likelihood Ratio Test)
Visualization Technique
- Geo Maps
- Pixel Sentiment Geo Map
- Key Term Geo Maps
- Pixel-cell Based Sentiment Calendar
- similar approach as in Pixel Map Calendars
- row encodes diffrent feature
- organized monthly-year
- Self-organizing Term Association Map ( SOM )
- Pixel Sentiment Geo Maps
- overlapping and data density
- clustering and use of glyphs
- disapperance of original data
- Pixel Placment Algorithm (Bresham - Midpoint)
- avoid random patterns place by priority (sentiment)
- radial layout of pixel placement


- Pixel Placment Algorithm
- Radial Layout


-
Self-organizing Term Association Map ( SOM )
- enriched version of Word Cloud with semantic context
- grouped into associations
- color encodes sentiment
- saturation encodes strength of sentiment
Key Term Geo Map
Visual sentiment analysis of customer feedback streams using geo-temporal term associations
Visualization Technique
- Key Term Geo Maps
- Key Term Geo Map
- Key Term Distribution Map


-
Key Term Geo Map
- diffrent levels of detail
- map key terms to zip code areas - ( not always possible )
- change mapping between text & geo hierachy
- Color, Size encoded accordingly ( respect overlaping )


-
Key Term Distribution Map
- separate by sentiment ( negative vs. positive )
- plot heat map on geo map ( Gaussian bluring func. )
- overplot two heat maps
- overlaped results
- merge colors


Visual Text Analysis
By Giuliano Castiglia