


Daniel Haehn PRO
Hi, I am a biomedical imaging and visualization researcher who investigates how computational methods can accelerate biological and medical research.
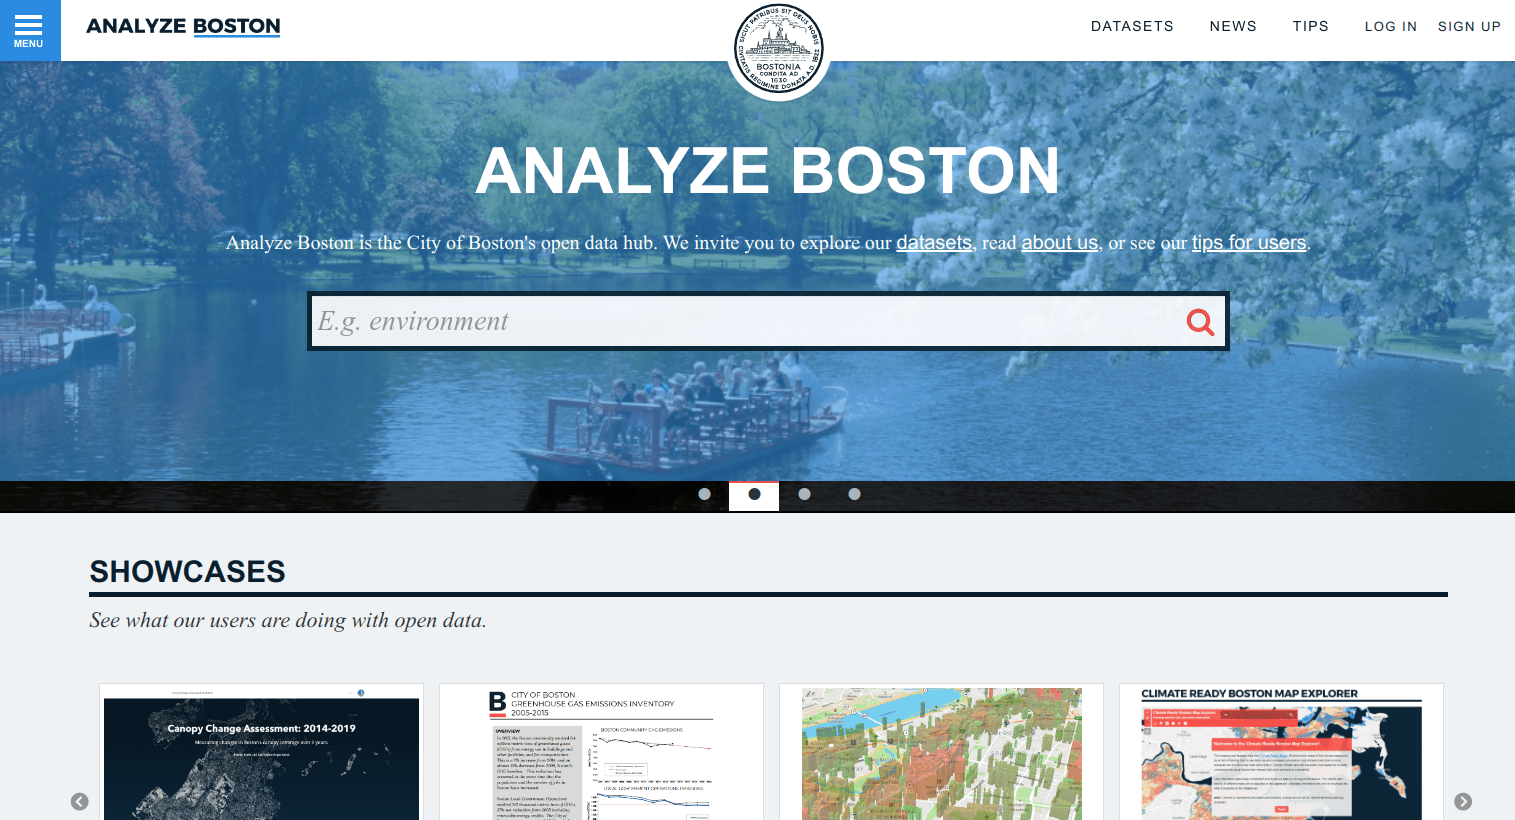
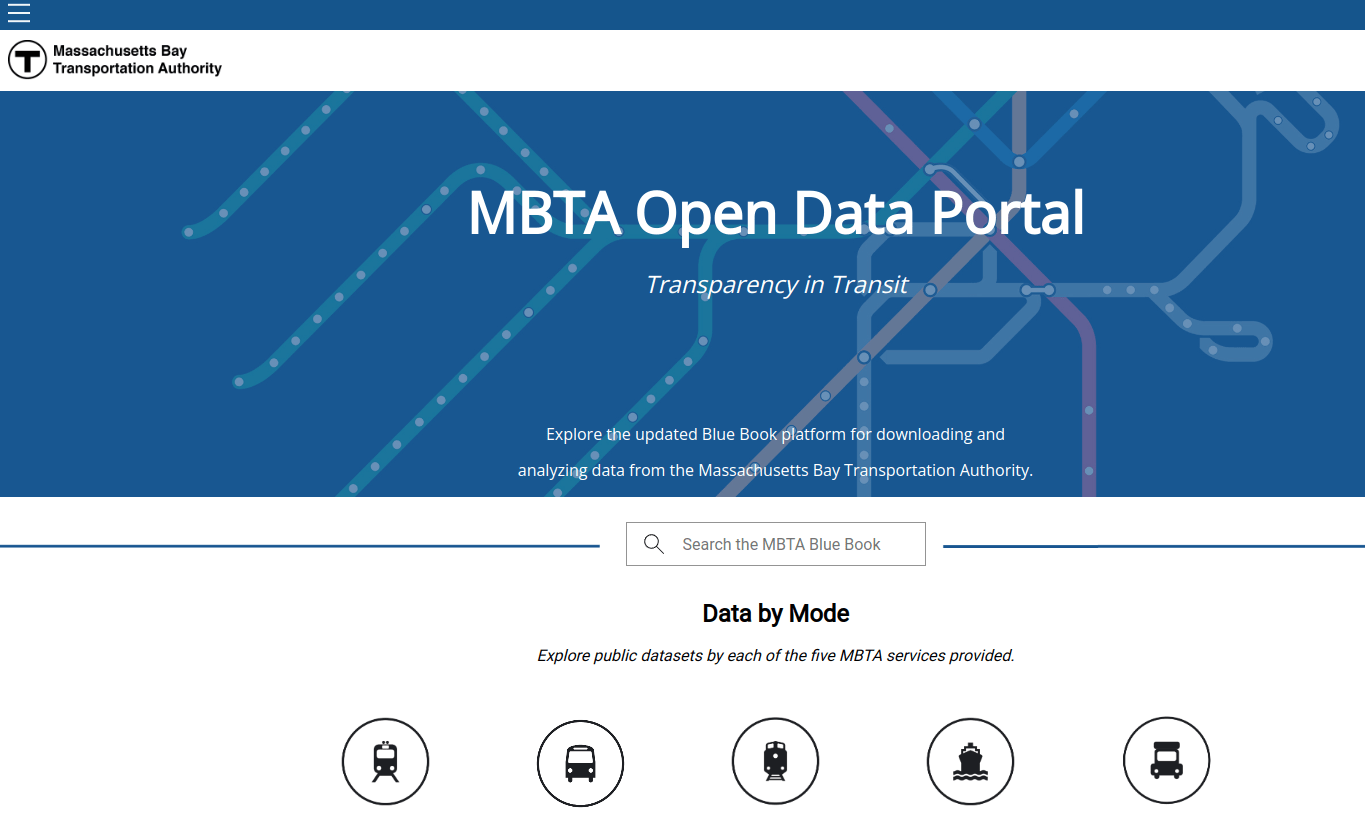
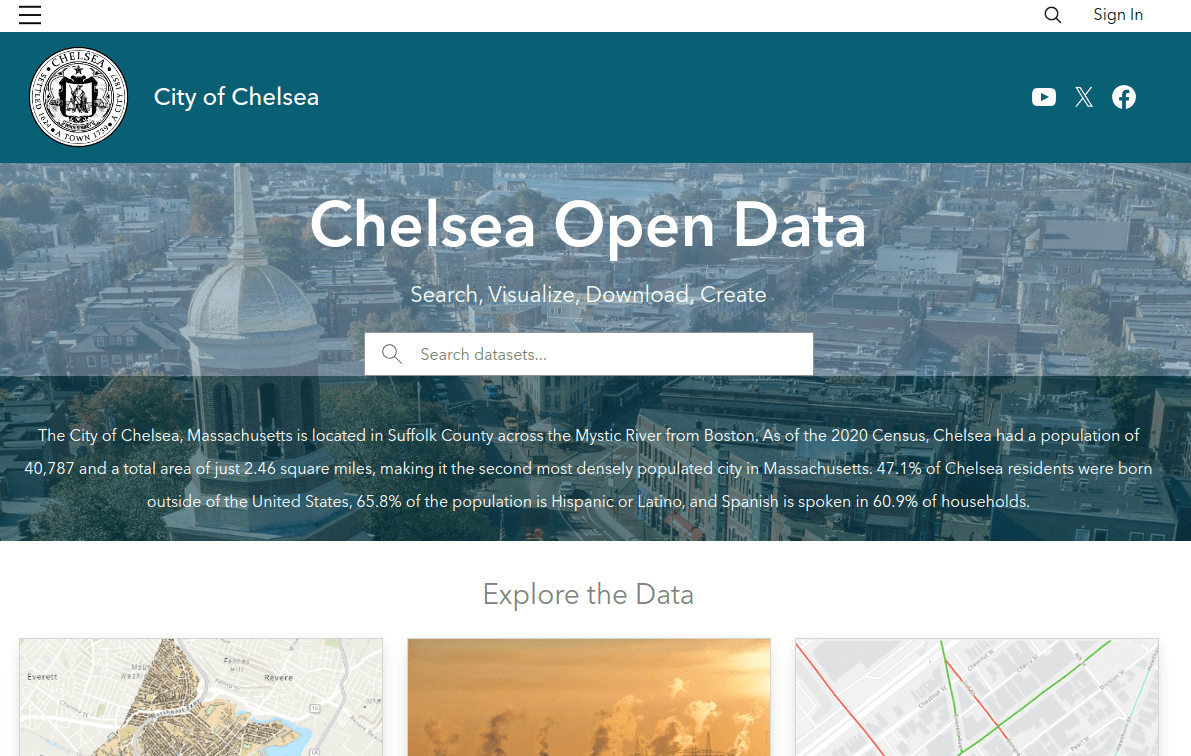
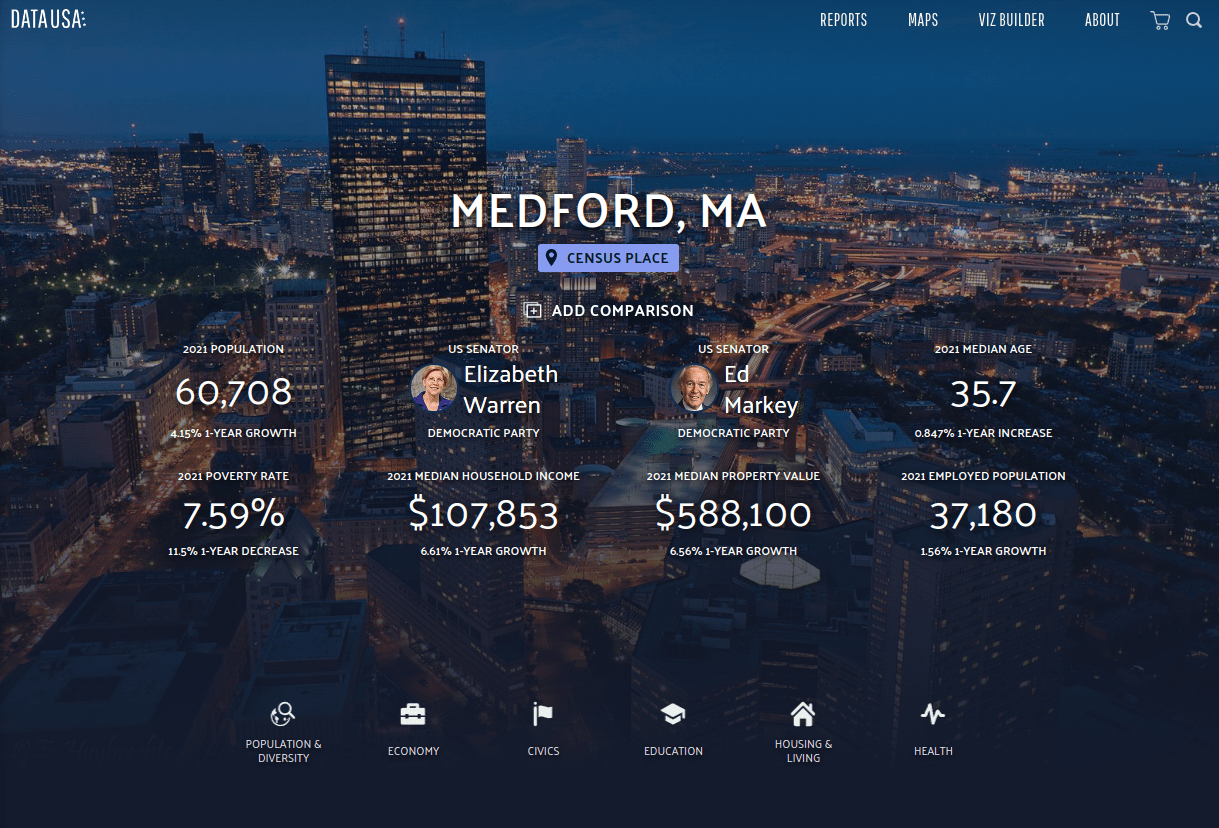
local / regional data
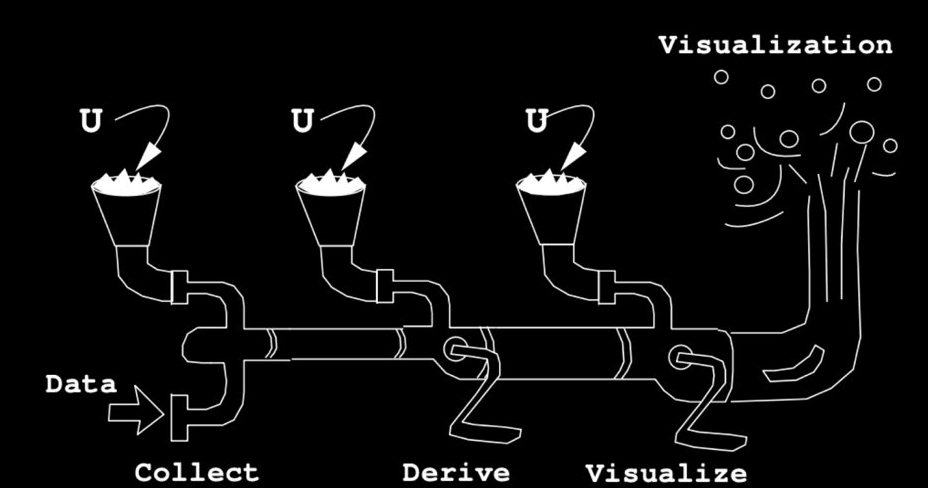
visualize
to tell a story!
Due 5/6 1159p!
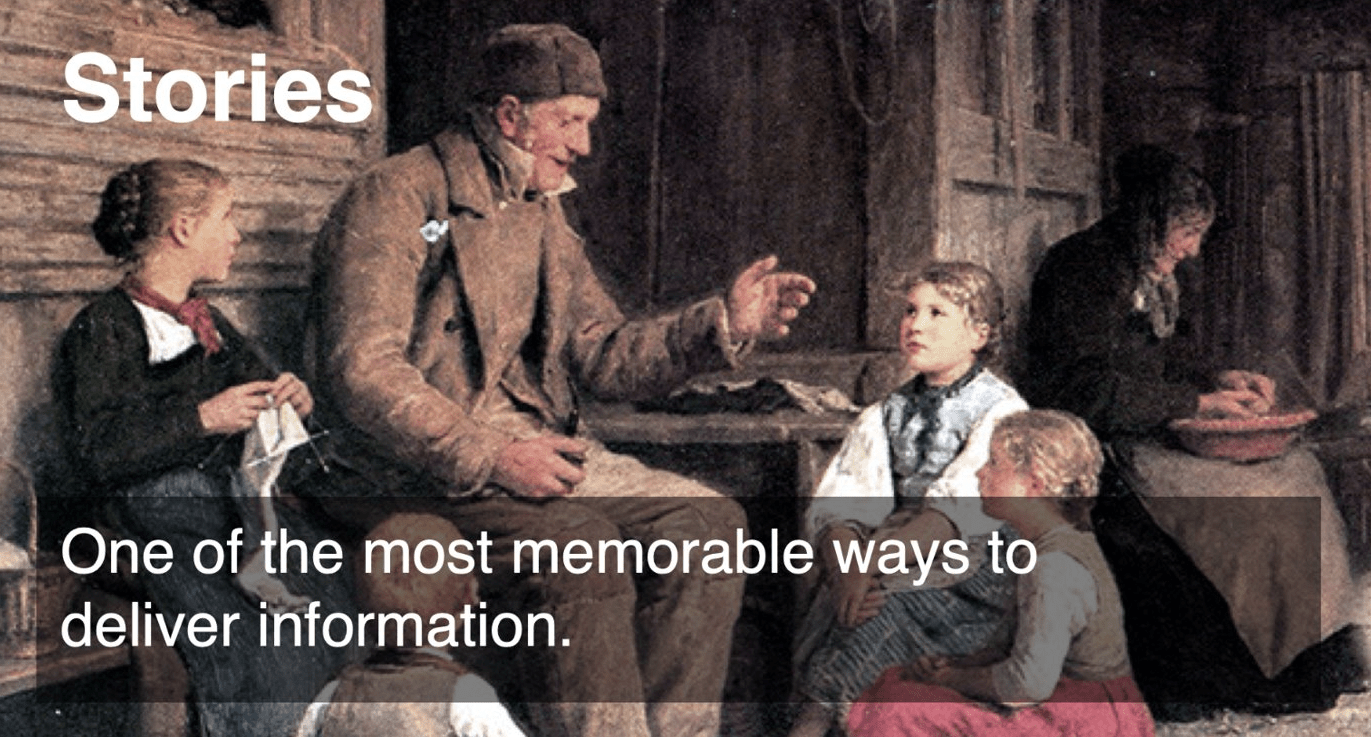
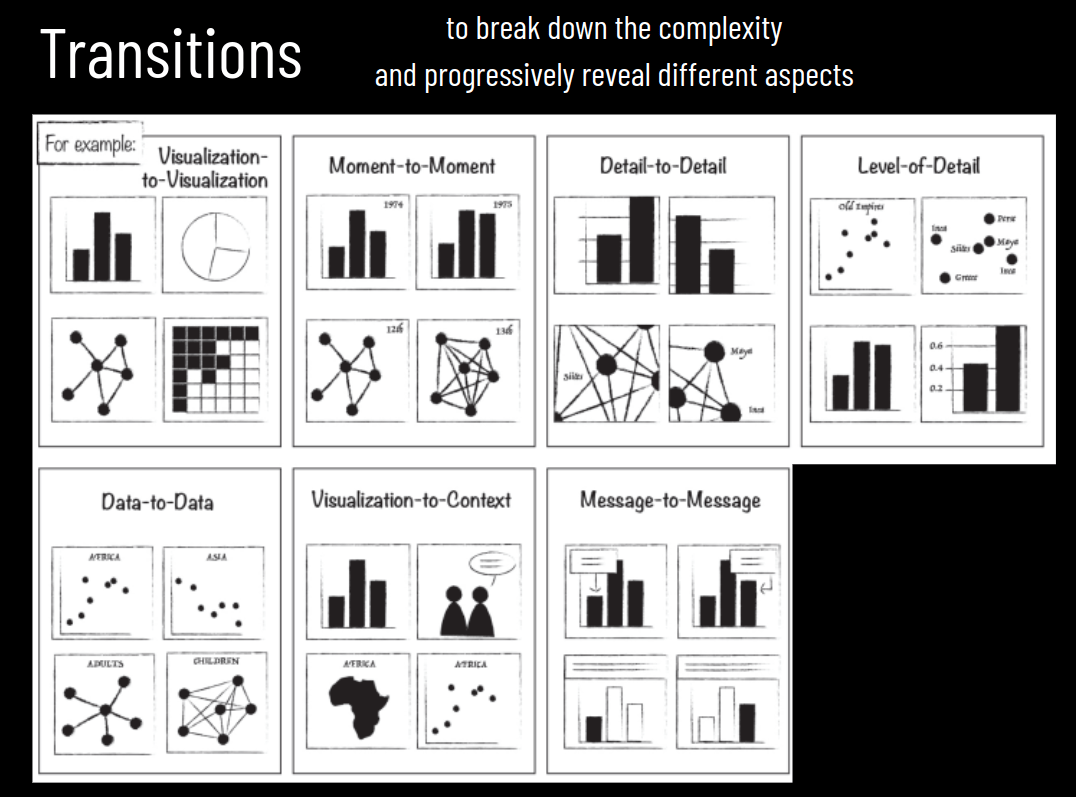
Stories are everywhere!
Make an impact!
Thank you!
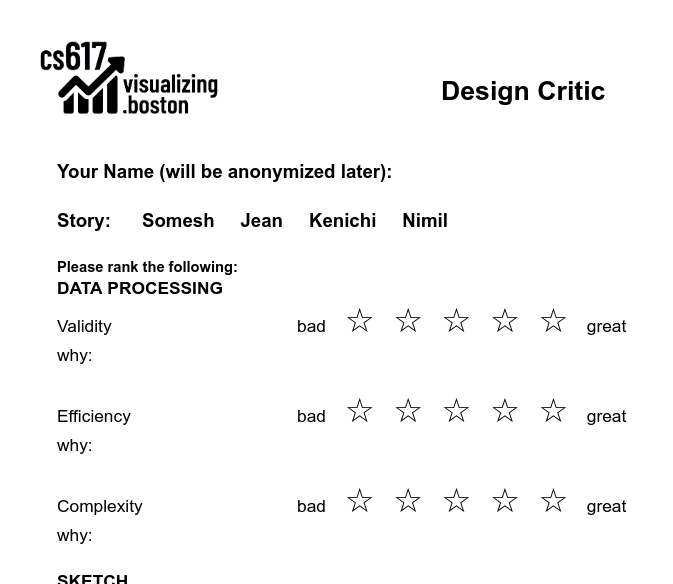
Somesh
Jean
Kenichi
Nimil
Links on Discord!
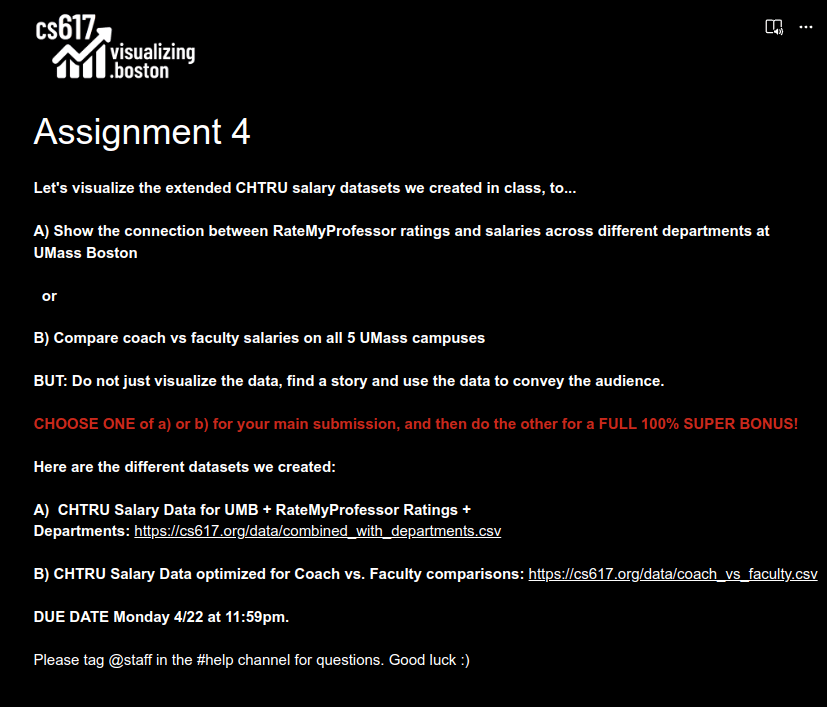
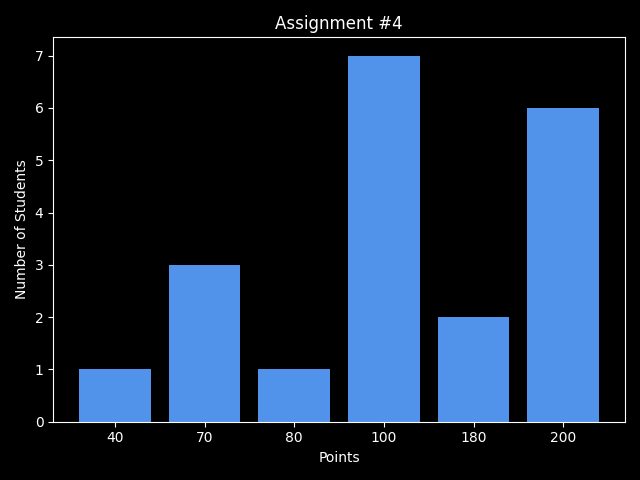
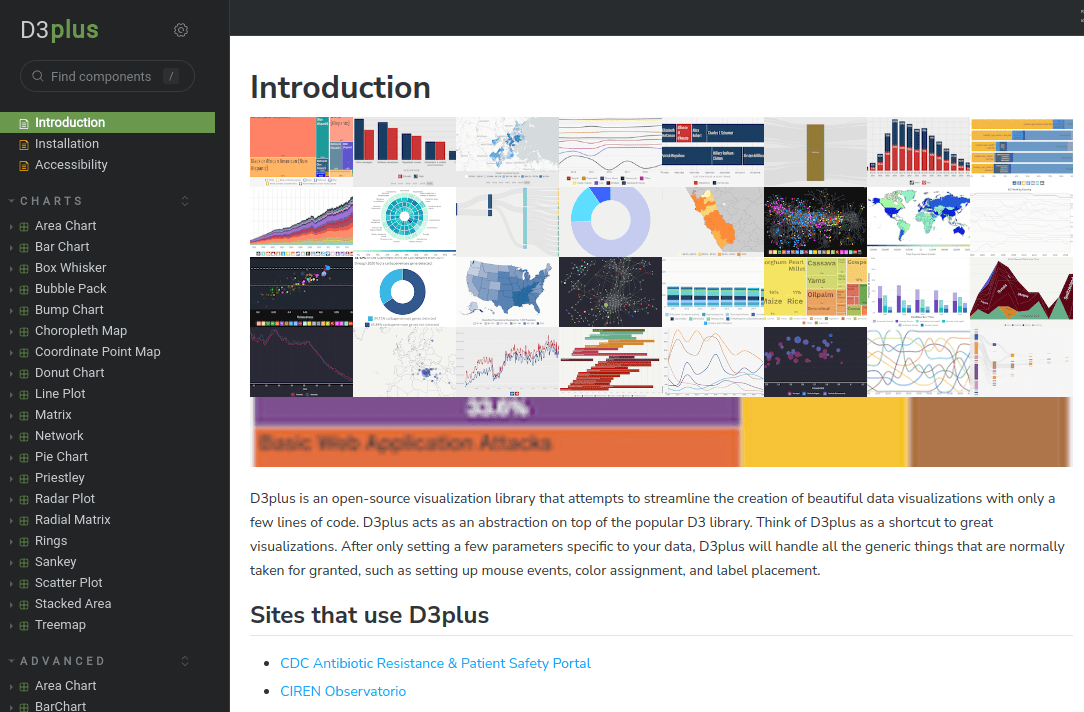
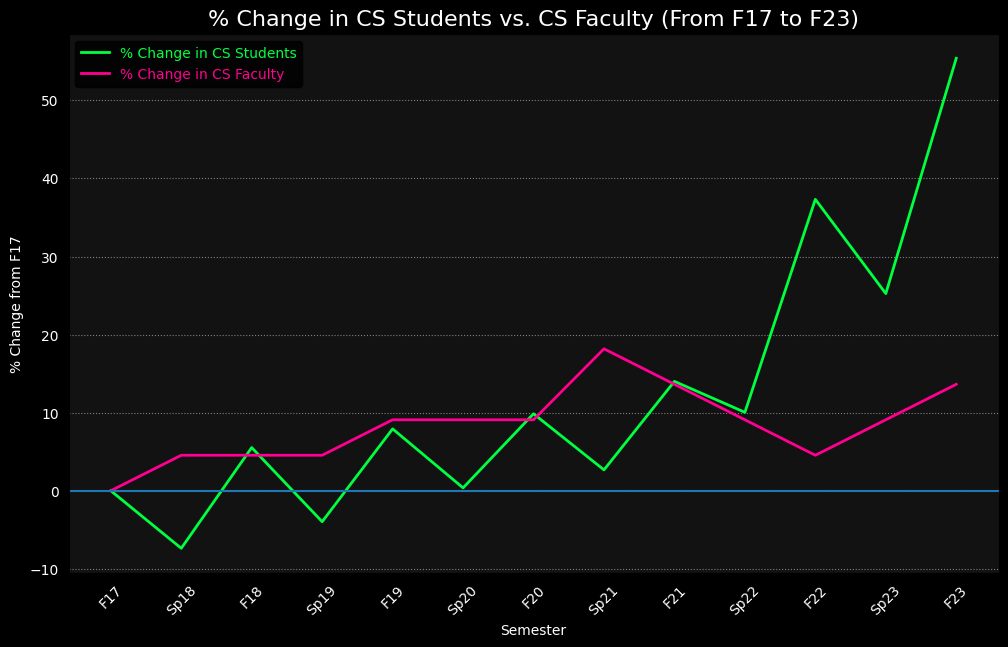
Homework
Use d3plus to create the indexed chart!
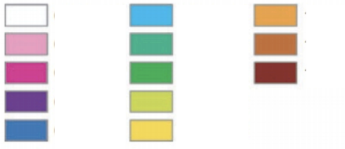
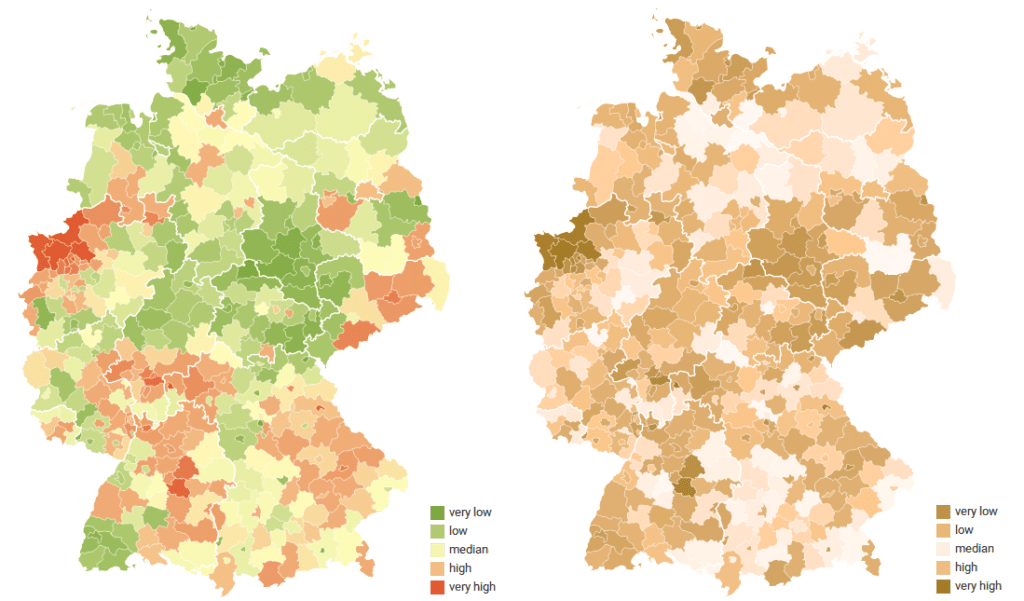
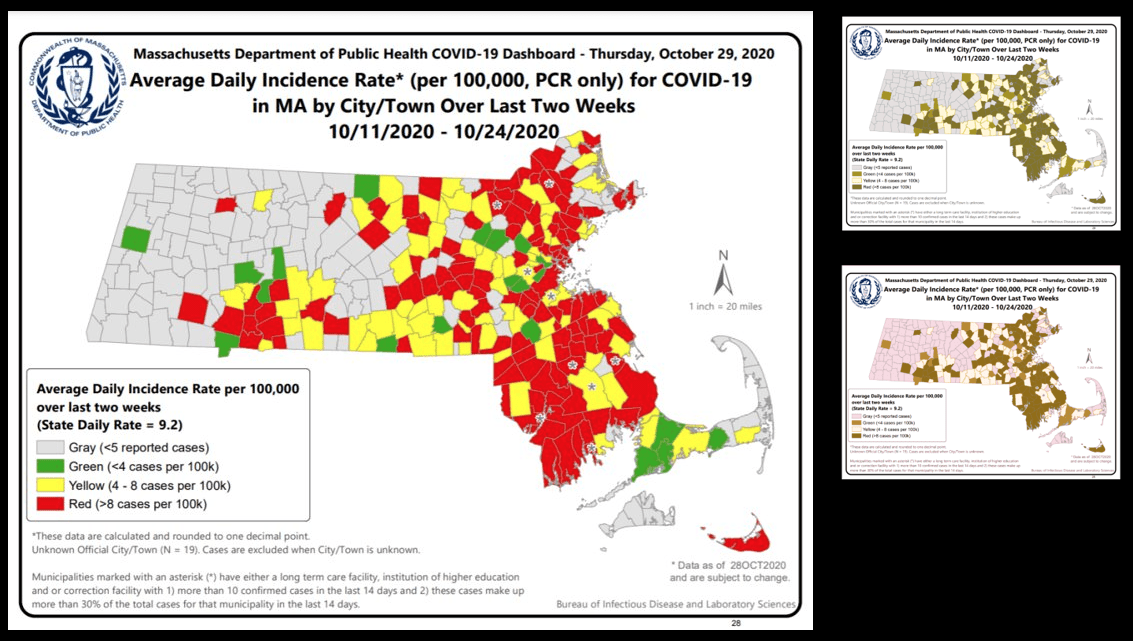
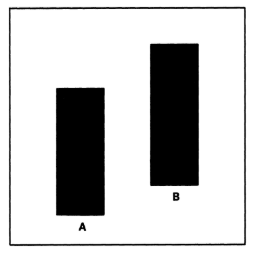
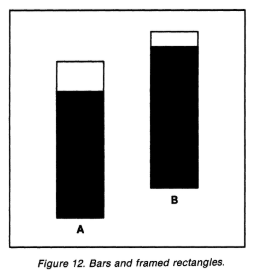
Can you tell which color represents higher or lower values?
for red-green blind people
Cleveland and McGill 1984
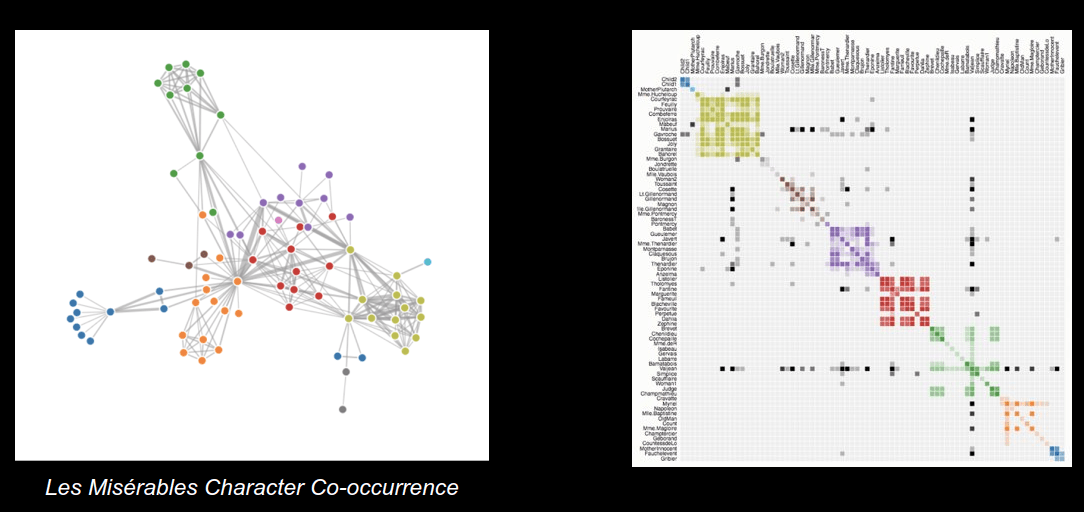
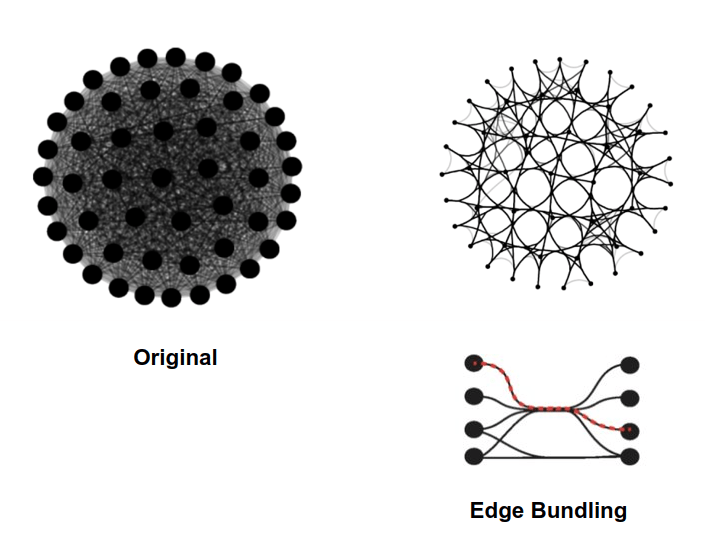
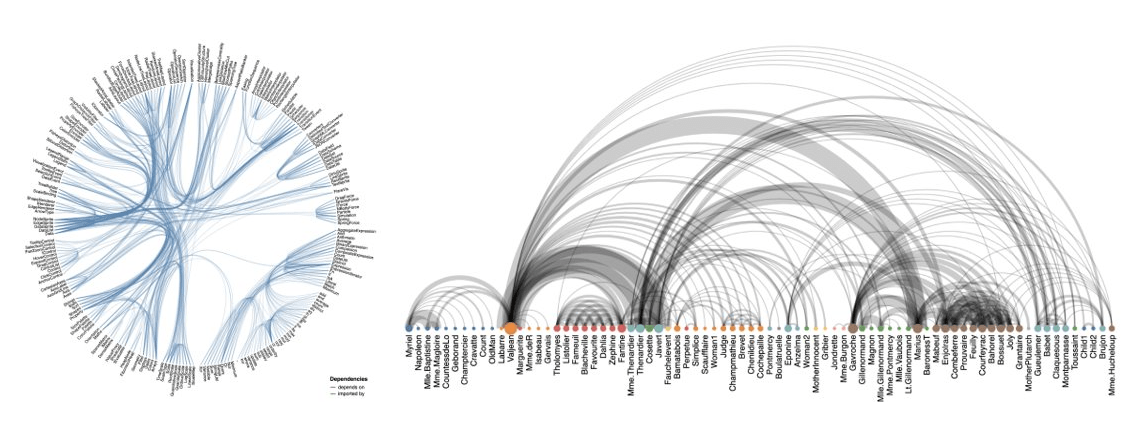
Node-Link Diagram
Matrix Diagram
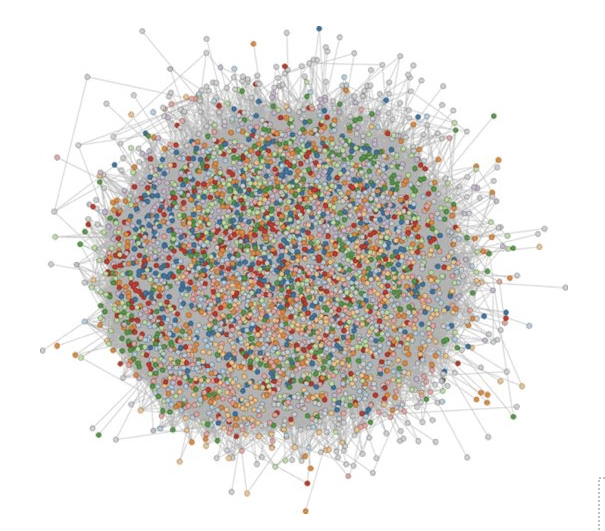
Hairball Problem
Connectivity
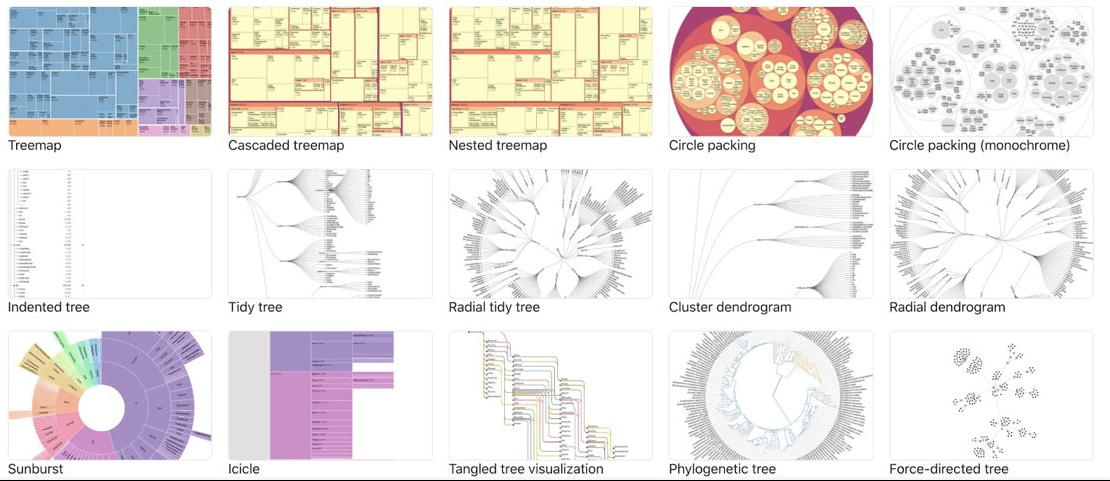
Hierarchical Data
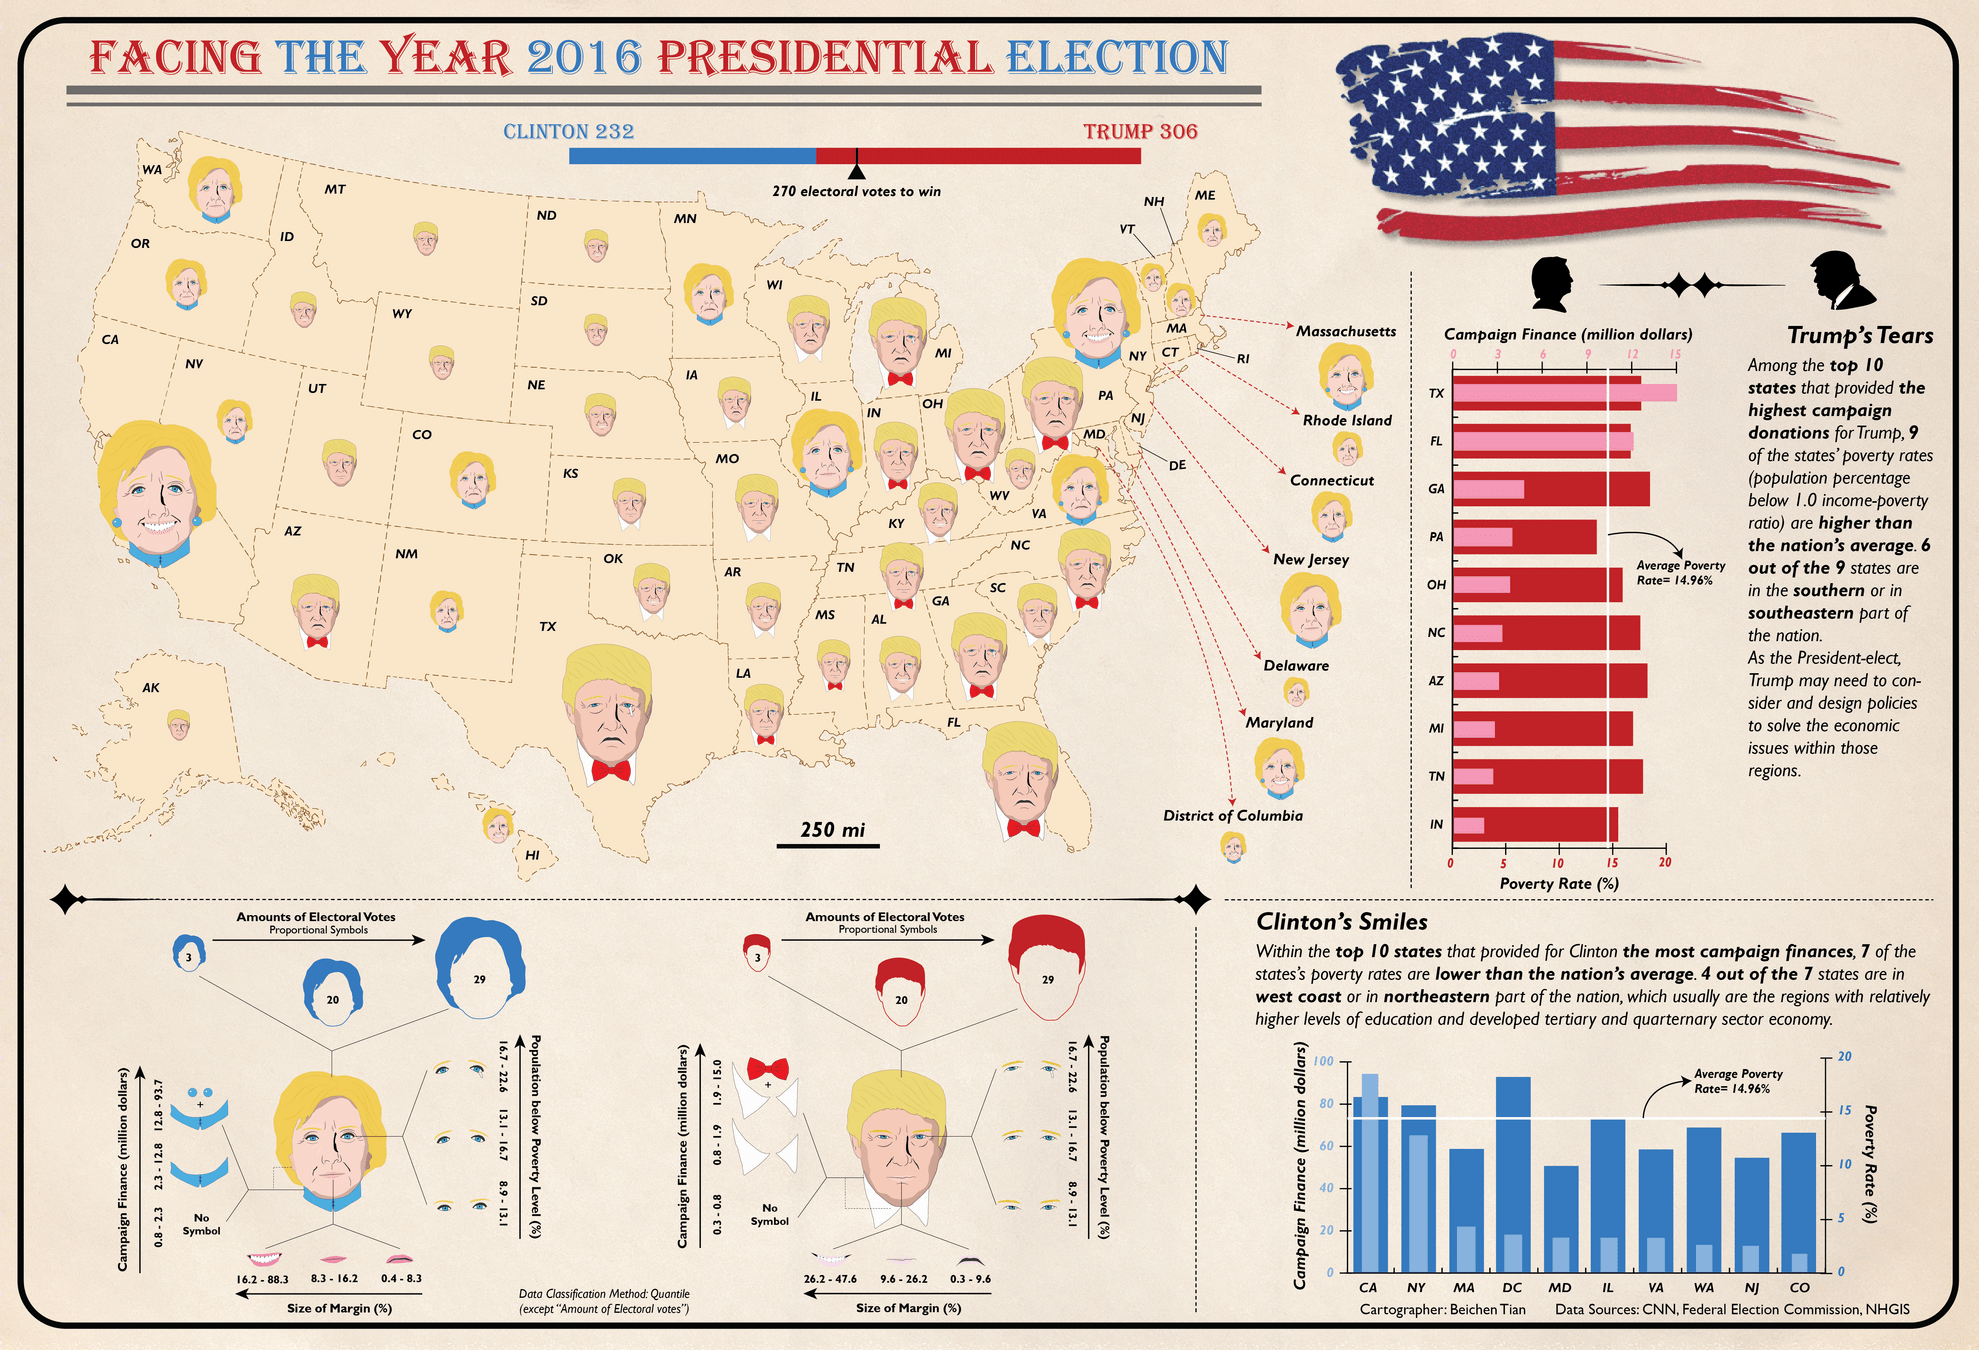
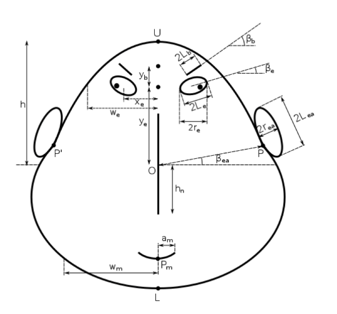
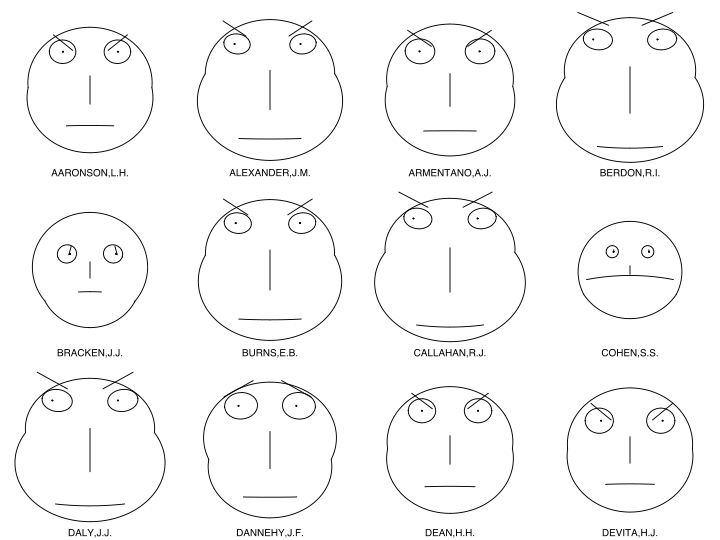
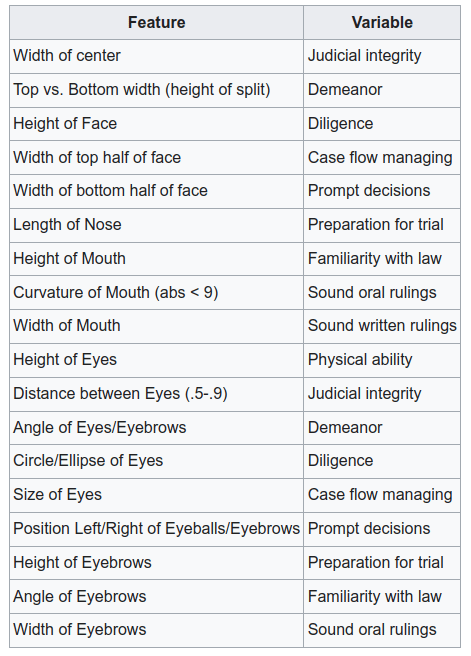
Chernoff Faces
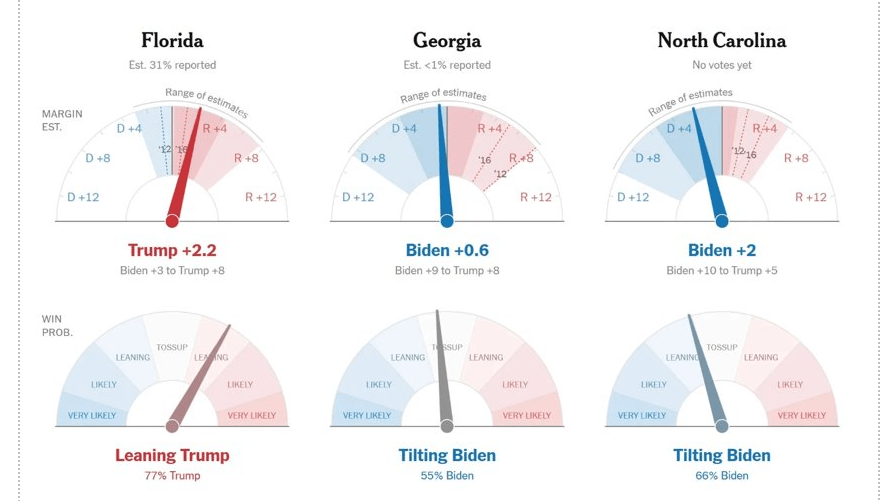
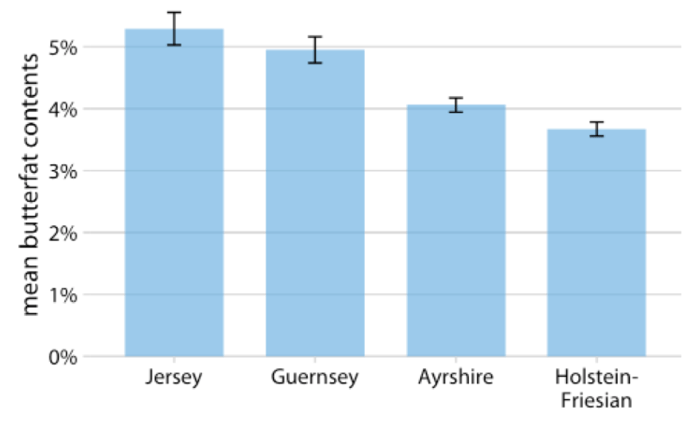
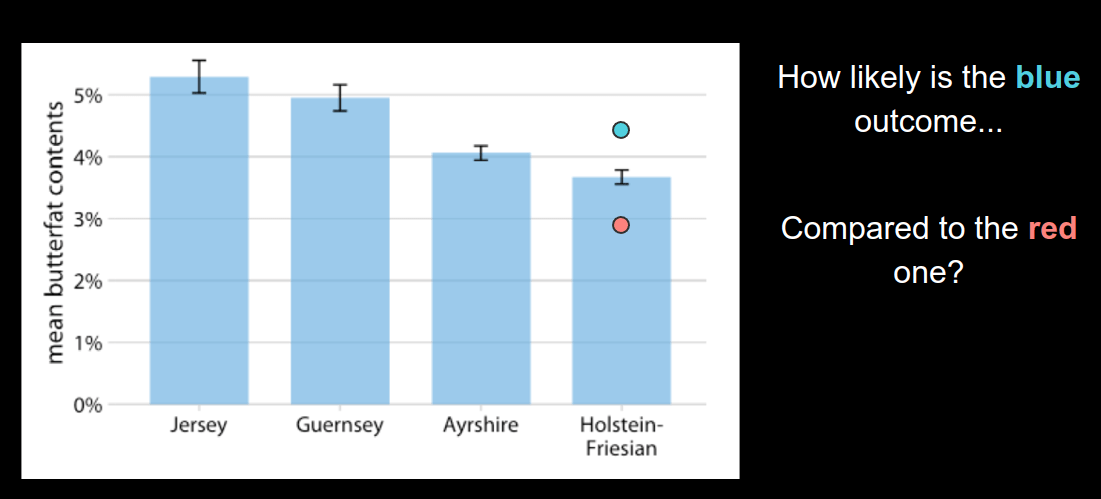
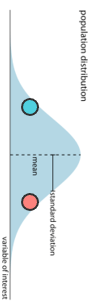
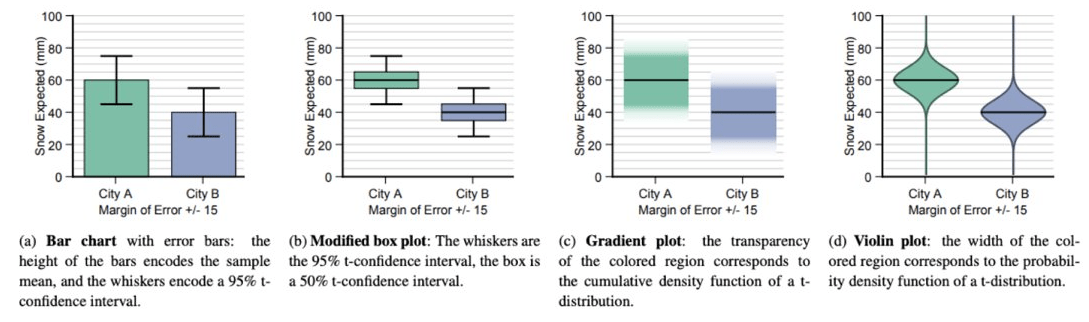
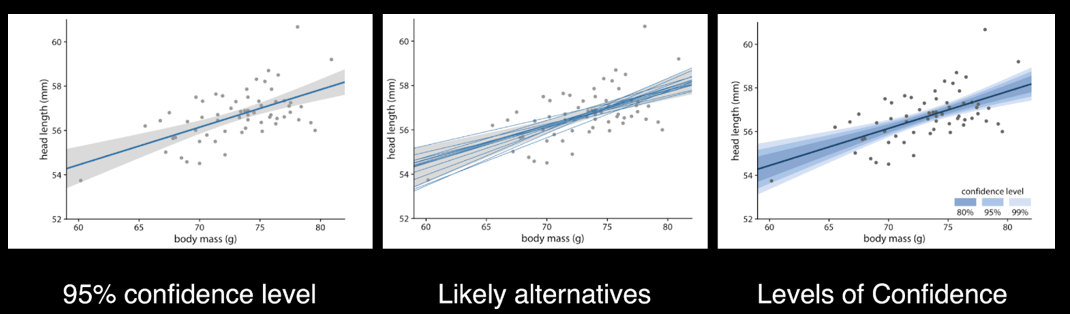
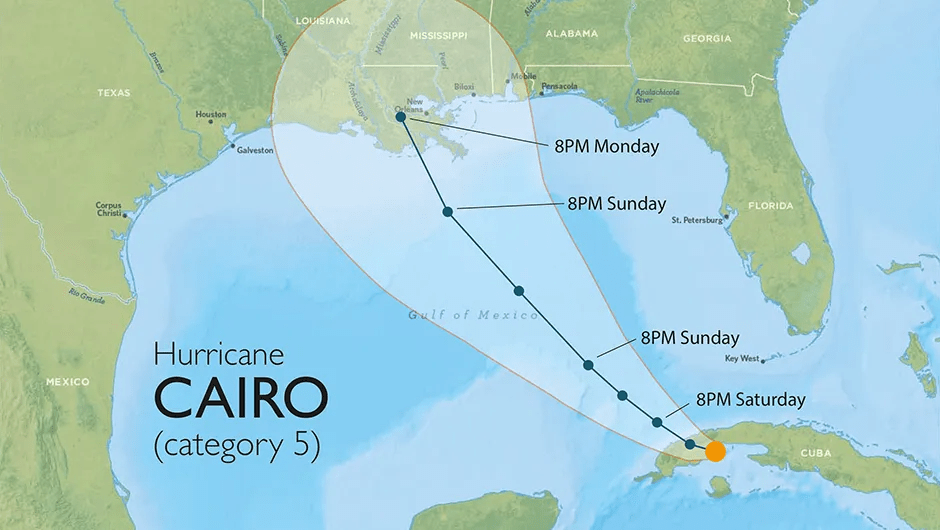
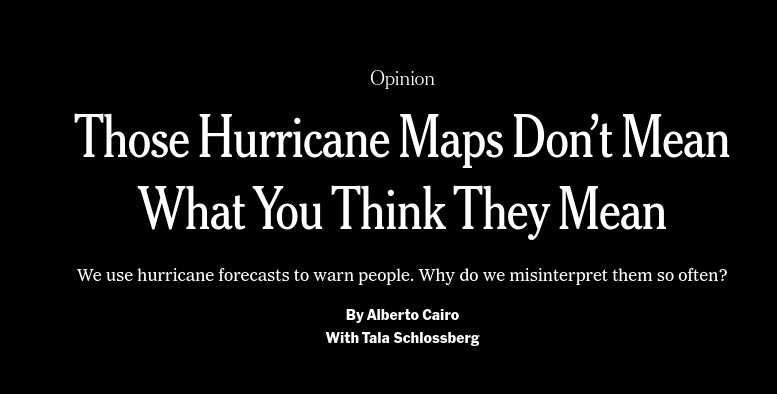
Uncertainty
Homework
By Daniel Haehn
Slides for CS617 VISUALIZING.BOSTON - See https://cs617.orghttps://cs617.org


