Using SVG with React
@hugozap
Working with SVG (Workflows)
Front End Activities
- Model Component State
- Create UI.
- How does the state influences UI?
- Iterate on UX based on feedback
- Effects / Colors ...
SVG Activities
- Creates asset (Sketch / Illustrator)
- Optimize asset (Clean markup)
- Iterate on asset based on feedback
Loop
SVG usage types
SVG Based UI
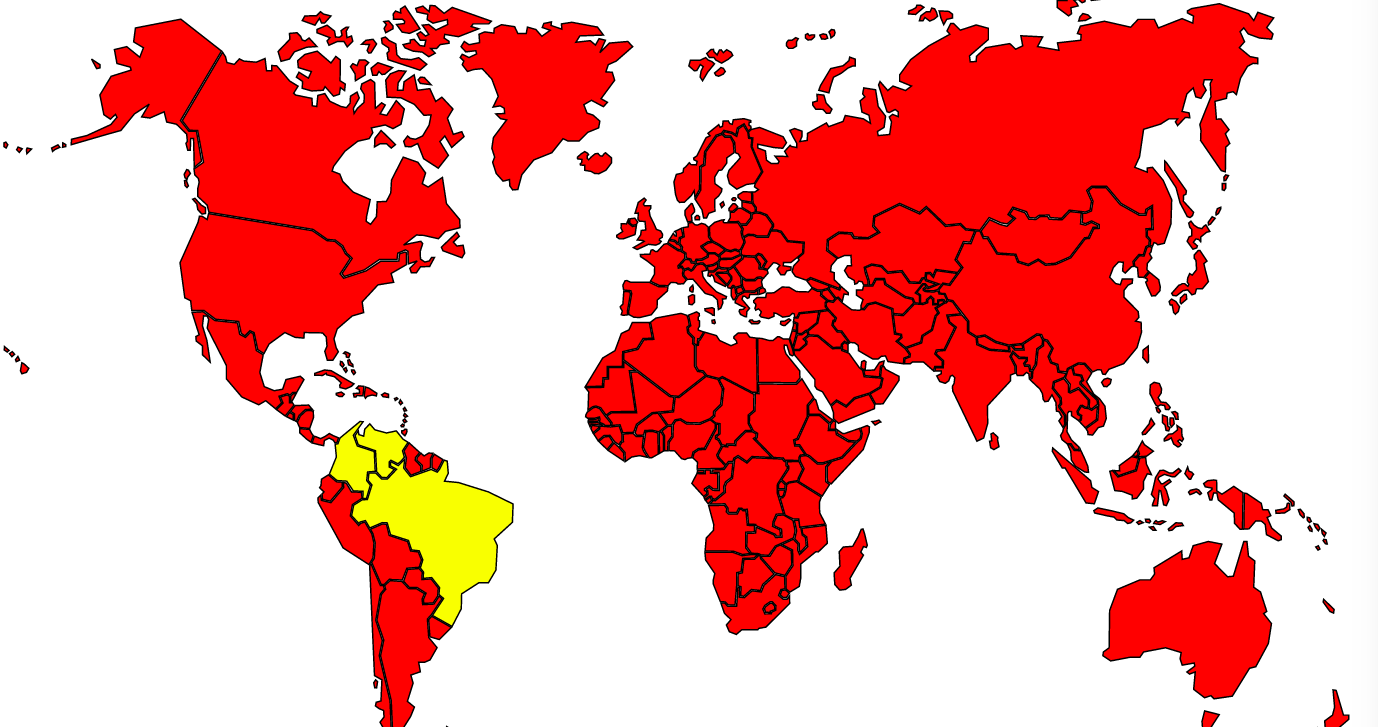
- Fixed SVG, manipulate attributes ( E.g Maps )
- One static SVG drives the experience
- Creative UI's
Data Driven UI
- Data Visualizations
- Several records
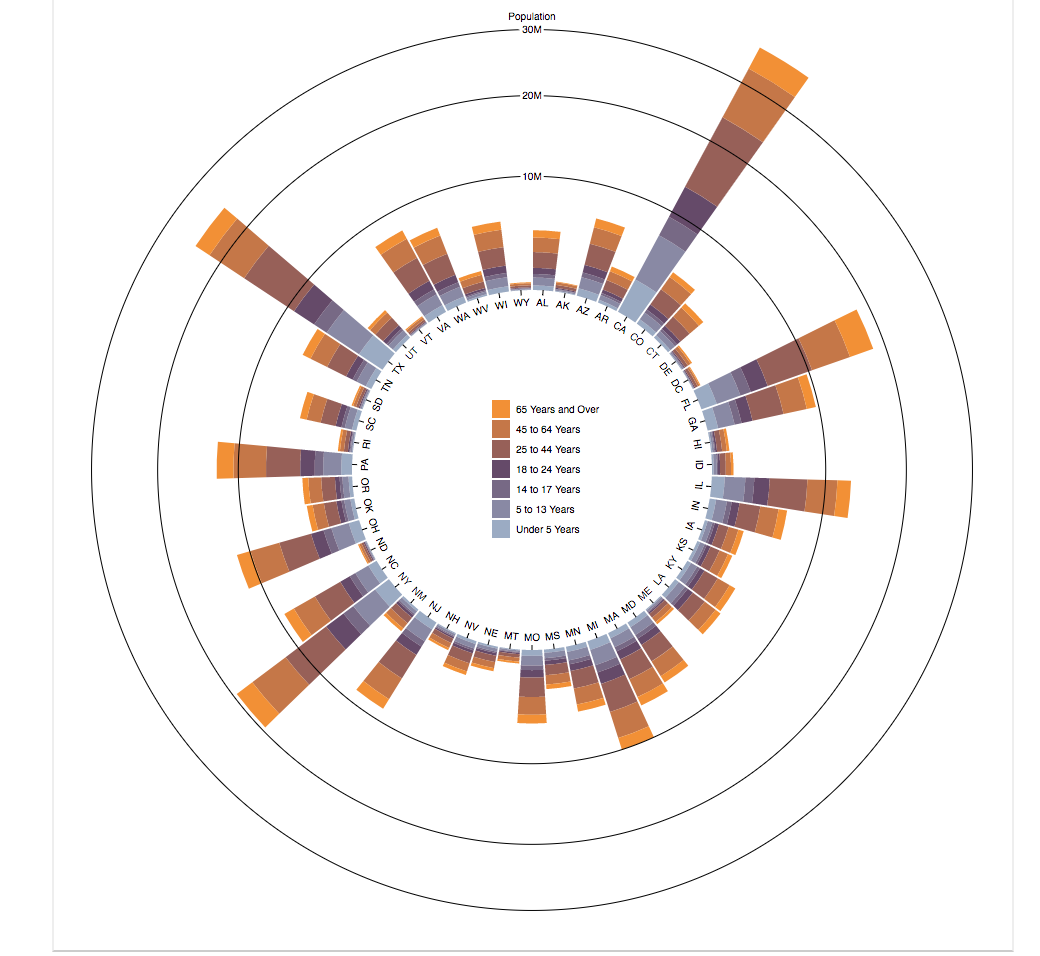
- Charts
Chart Component libraries
- High level.
- Abstract SVG handling.
- Declarative.
- No total control over result.
d3.js based visualizations
- More control
- Lots of utilities to create visualizations
- Chained api
- Mixed declarative/procedural style
- Create React components to wrap d3 logic.


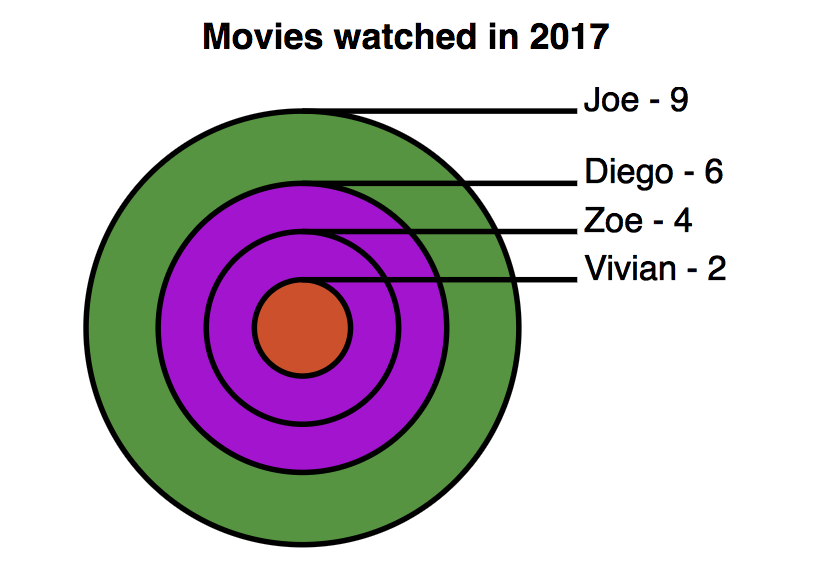
Data driven UI's. Example using d3
Text
const moviesData = [
  { name: 'Vivian', moviesWatched: 2 },
  { name: 'Zoe', moviesWatched: 4 },
  { name: 'Diego', moviesWatched: 6 },
  { name: 'Joe', moviesWatched: 9 },
]

const App = () => (
  <div style={styles}>
    <h1> Custom visualization  </h1>
    <h2> Movies watched in 2017 </h2>
    <MoviesWatched data={moviesData} />
  </div>
);

render(<App />, document.getElementById('root'));
Data driven UI's. Example using d3
Text
https://codesandbox.io/s/lrywlv9klm
import React, { Component } from 'react';
import PropTypes from 'prop-types';
import * as d3 from 'd3';


class MoviesWatchedChart extends Component {

  static props = {
    data: PropTypes.array.isRequired
  }

  renderChart() {
    ... d3 code, setup scales.
    this.drawCircles(container, scale, colorScale);
    this.drawLabels(container, scale, colorScale);
  }

  drawCircles(container, scale, colorScale) {
    ... d3 code
  }

  drawLabels(container, scale) {
    ... d3 code
  }
  componentDidMount() {
    this.renderChart()
  }

  componentDidUpdate() {
    this.renderChart()
  }


  render() {
    return <svg width="100%" viewBox="-350 -350 1000 680"></svg>
  }
}

export default MoviesWatchedChart;
Wrapping d3 in a React Component
Text
renderChart() {
    //Create scales to map from domain values to both pixels and colors
    var scale = d3.scaleLinear()
      .domain([0, 10])
      .range([0, 350])

    var colorScale = d3.scaleQuantize()
      .domain([1, 10])
      .range(['#bf5d39', '#934acc','#668e43'])

    var container = d3.select('svg')
      .selectAll('g')
      .data(this.props.data)
      .enter() //virtual set of new items
        .append('g')

    this.drawCircle(container, scale, colorScale);
    this.drawLabel(container, scale, colorScale);


  }
d3 basics for data driven svg:
- Scale utilities: Map domain data to pixels, colors.
- Bind data to virtual selectors ( enter, exit ).
- set attributes on SVG elements.
Feels like jQuery ( in a good way. Very convenient, lots of examples )
SVG based layout

Convert svg to jsx
Copy the SVG Code, paste it and adjust it (class -> className, etc.)
| PROS | CONS |
|---|---|
| + Declarative style | - Can't iterate on SVG file. - Re-adjust every time the file is modified |
| + One way data flow | - JSX gets complex |
Tools like svg-to-react-cli help to transform a SVG file into a React Component.
Inject SVG using library
| PROS | CONS |
|---|---|
| + Dynamically Load SVG | - Non Declarative. ( Manipulation needs to be done manually ) |
| + Work on SVG file separately. | - Can't use with libraries like react-move. |
| + Clean JSX | |
import SVG  from 'react-inlinesvg';

<SVG
    src="/path/to/myfile.svg"
    preload={<Loader />}
    onLoad={(src) => {
        myOnLoadHandler(src);
    }}
>
Load external SVG and manipulate it with react-samy-svg
import React from "react";
import { Samy, SvgProxy } from "react-samy-svg";

const Sample = () => (
    <Samy path="SVG_PATH_HERE">
      <SvgProxy selector=".country" fill="white" stroke="black" />
      <SvgProxy selector="#bg" fill="white" />
      <SvgProxy selector="#br" fill="red" />
    </Samy>
);

export default Sample;

SVG preparation
Text
https://codesandbox.io/s/m54790l888
Using React animation tools.

Different approaches to work with SVG from React.
By hugo zapata
Different approaches to work with SVG from React.
- 939


