node devops
- Production Infrastructure
- Monitoring and Alerts
- Production Issues
Caveat: I am not an ops expert... I'm just a dev who knows enough about ops to get things running without too much hassle. This is all knowledge from seat-of-the-pants learning experiences.
Production Infrastructure
Spectrum of options (with lots of overlap):
- Platform as a Service Cloud (eg, nodejitsu)
- Infrastructure as a Service (eg, Joyent, AWS)
- VPS (eg, Linode)
- Dedicated off-site servers (eg, Peak 10)
- Dedicated on-site servers (eg, your IT staff)
Platform as a service
heroku, nodejitsu
- Setup: easy
- Continuous integration: easy
-
Time spent in devops: low
- Portability: average
-
Control: low
-
Cost premium: high
Good for startups, small teams, small companies, very lean and agile tech companies with limited devops budgets. Leverages proprietary deployment systems and abstract infrastructure ideas ("dynos," "drones").
infrastructure as a service
Joyent, AWS
- Setup: easy
- Continuous integration: medium
-
Time spent in devops: medium
- Portability: average
-
Control: medium
- Cost premium: medium
Good for companies without lots of internal IT resources, servers, etc. Leverages machine images / profiles and configuration tools like Chef and Puppet alongside services like block storage, CDN, and abstract databases.
vps
Linode, lots of others
- Setup: medium
- Continuous integration: medium
-
Time spent in devops: medium
- Portability: high
-
Control: high
- Cost premium: low
Similar to infrastructure-as-a-service, but with fewer "out of the box" configurations and a bare-bones approach. Leverages custom images, build scripts, and tools like Chef and Puppet.
dedicated servers
Internal, external
- Setup: high
- Continuous integration: medium
-
Time spent in devops: high
- Portability: high
-
Control: high
- Cost premium: low
Traditional infrastructure; best for large teams with realistic IT budgets and dedicated operations personel. Leverages custom build scripts and images, build tools like Chef and Puppet, as well as general OS and ops expertise.
monitoring, alerts, analysis
- built-in v8 debugger and profiler
- webkit web inspector
- NodeFly
- Nodetime
- DTrace (+ Joyent + SmartOS)
- GraphDat
v8 debugger and profiler
Debugger - tricky to use (command-line)
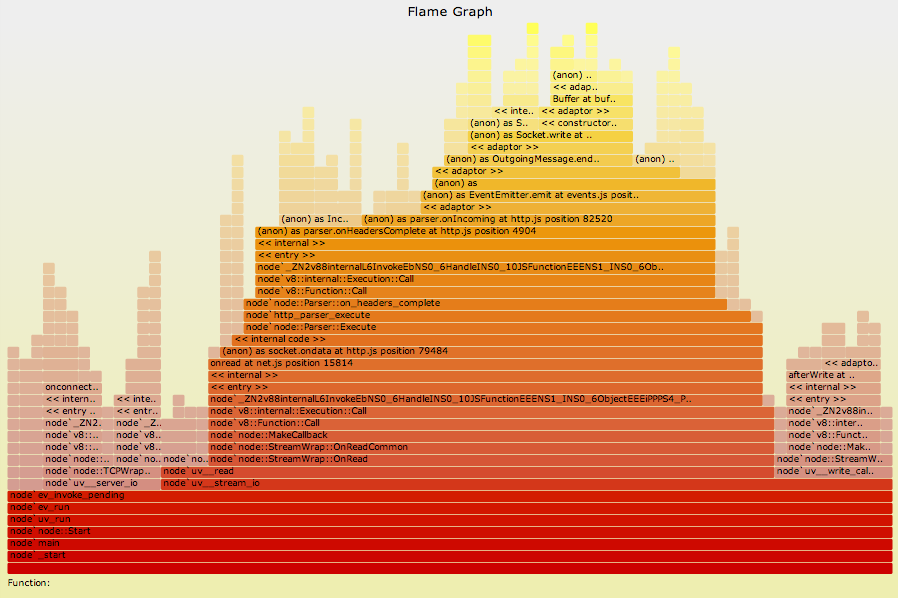
Profiler - awesome (sample output just like web inspector profiler)
Use --debug and --prof options when starting your app.
webkit web inspector
Use npm modules to connect node's v8 process to the GUI web inspector.
https://github.com/dannycoates/node-inspector
nodefly and nodetime
Web services:
nodefly.com
nodetime.com
graphdat.com
dtrace
Requires SmartOS, best with Joyent:
performance
All about measurement and then 'clouding' - being able to run multiple, clustered, stateless processes that you can scale up and down with ease.
- Follow 12factor.net guidelines
- Focus on a painless deployment process so it's easy to provision new servers.
After that, just measure the app's performance with a known set of inputs (client requests) and a set number of processes - then multiply.
performance caveats
Consider the network and network I/O.
For example, having your redis session server on the same LAN as your node cluster can be advantageous. Having them in different countries would be terrible.
node devops
By hunterloftis