Your Place in History
Joe Carrano
Maps, Virtual Reality, and Digital Public History
Emerging Technologies Discussion Group
August 5, 2015
@joecar25
In recent years, multiple cultural institutions started initiatives to map collections and historical data
Some notable examples:


Spoiler: I am not a GIS or programming expert!
Many of these projects rely on advanced knowledge of GIS systems and programming languages
Goal: create a similar map project for my Digital Public History course
Obstacles: vastly less time, resources, and knowledge
Step 1: choose a collection to map
(this is where virtual reality comes in)
Virtual reality may seem futuristic...
But it's been around for over 150 years
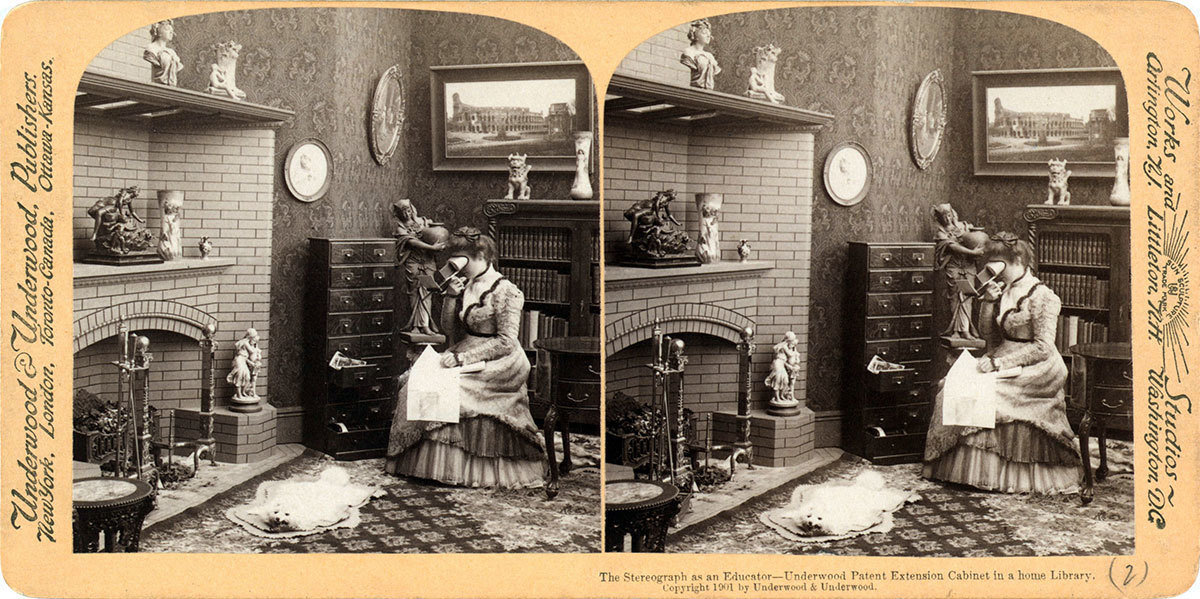
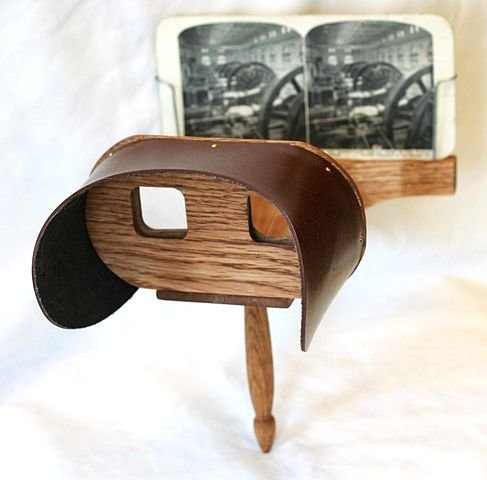
Stereographs or stereocopic views were hugely popular in the late 19th to early 20th century
- Two nearly identical images
- Isolates one image per eye, allowing our brains to meld the images and create the optical illusion of spatial depth
- Collections in many institutions and many digitized
- How do you produce the effect online and without a stereoscope?
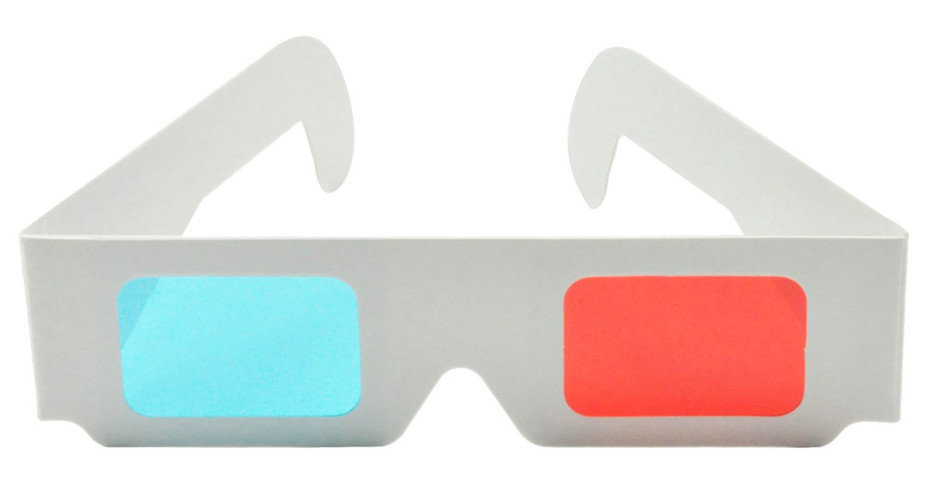
Option 1: Replicate the effect with a different type of viewer
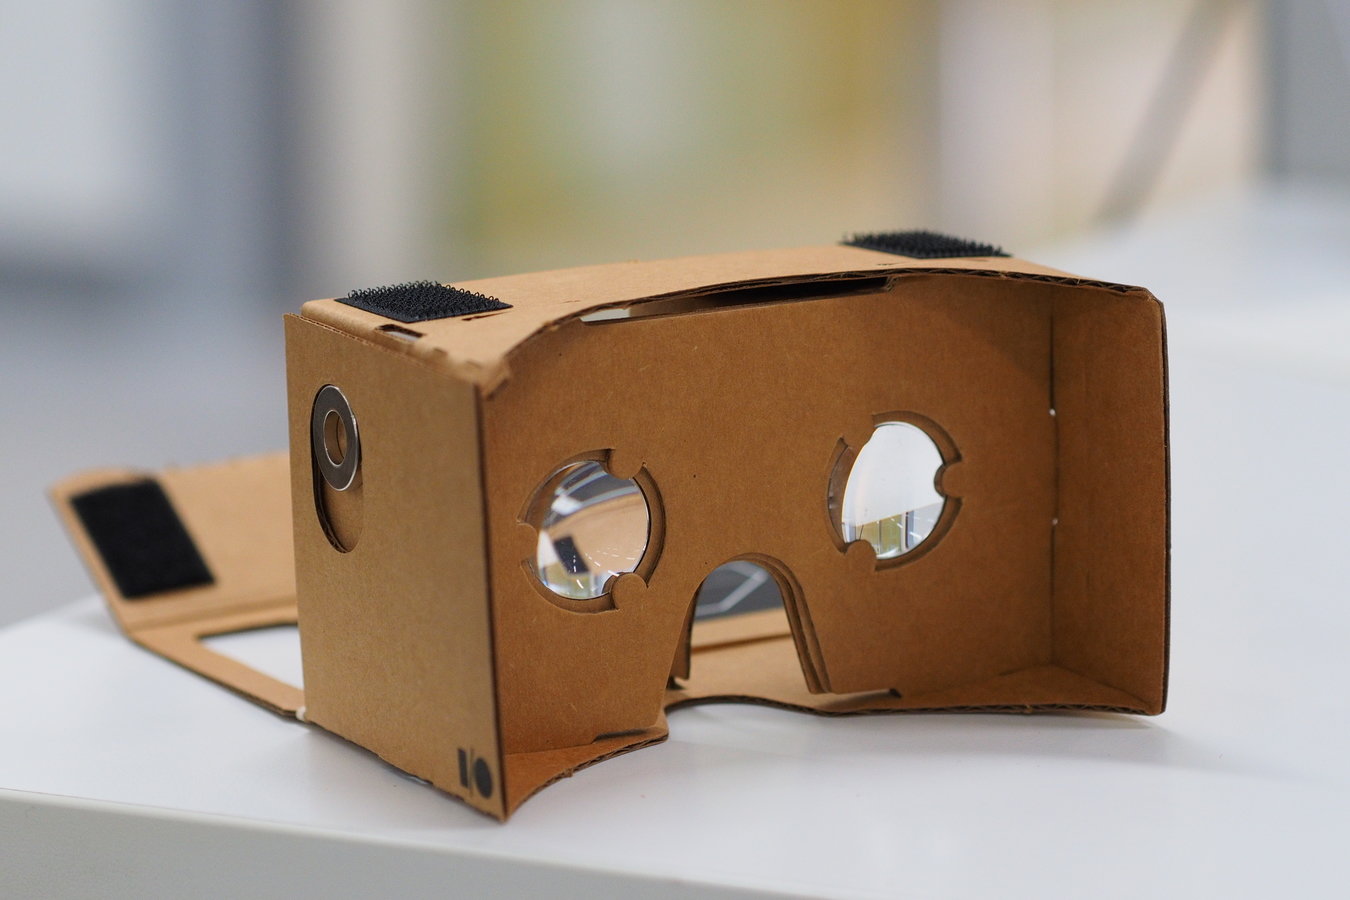
Google Cardboard
Anaglyph
Option 2: Turn these static digital images into animated GIFs

NYPL Labs created a tool to do just that called the Stereogranimator
Step 2: Promotion

Step 3: Find a way to map them
Needed: a tool that was free, easy to use, web based, not extremely technical, and most importantly could display animated images


The Result:

Questions?
Link to slides: slides.com/jcarrano/dighist-maps
Your Place in History: Maps, Virtual Reality, and Digital Public History
By jcarrano
