Visualizing and Understanding CNNs
J. Horacsek
M. Zeiler and R. Fergus
The Problem
In general, neural networks are hard to decipher.
- What do the weights "mean"?
- More specifically, what are the different layers of a network doing?
- How do different architectures work? What's the difference between them?
- How do we know that parameters are good?
Can we "look" into networks to inspect their behaviour?
The Problem
We can easily visualize the first convolutional layer. The first conv layer is often a collection of N x N (by 3) kernels.
Higher layers are trickier, they're often made up of a collection (say 64) M x M filters.

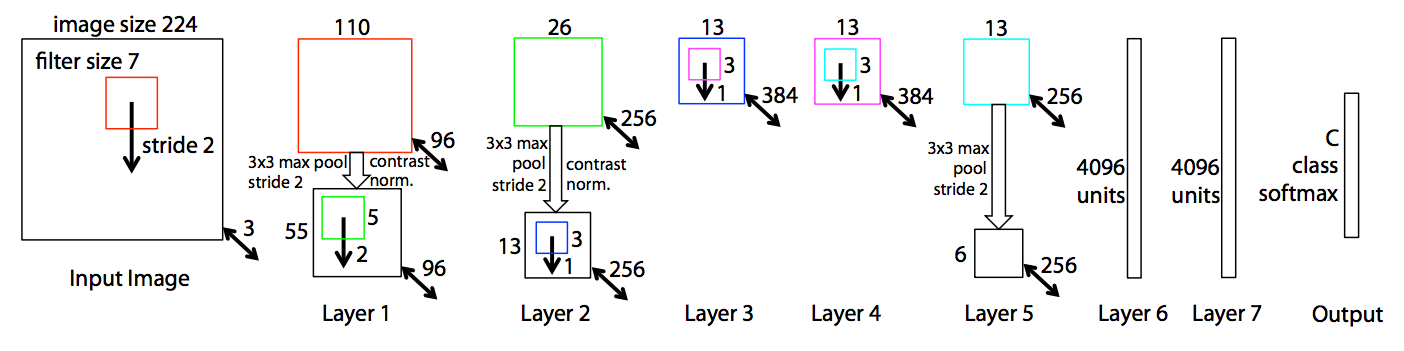
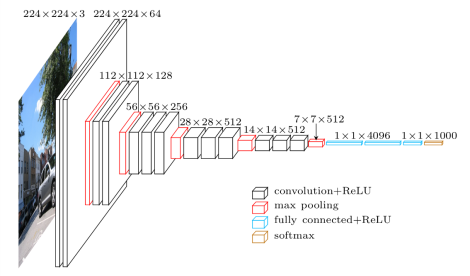
Convolutional Neural Networks: VGG16
Convolutional Neural Networks
The model used in the paper is different than VGG16
Visualizing Convolutional Neural Networks
What does the network see?
We can easily push data through the network and inspect the activations at each layer.
This isn't super helpful...
Visualizing Convolutional Neural Networks
Visualize filters in the first layer. This is fairly easy to do since they're all just 3 x 3 x 3 filters.

Deeper layers need something more sophisticated
Visualizing Convolutional Neural Networks
Go down to a specific layer, choose a feature map, take max activation
Visualizing Convolutional Neural Networks
Visualizing Convolutional Neural Networks
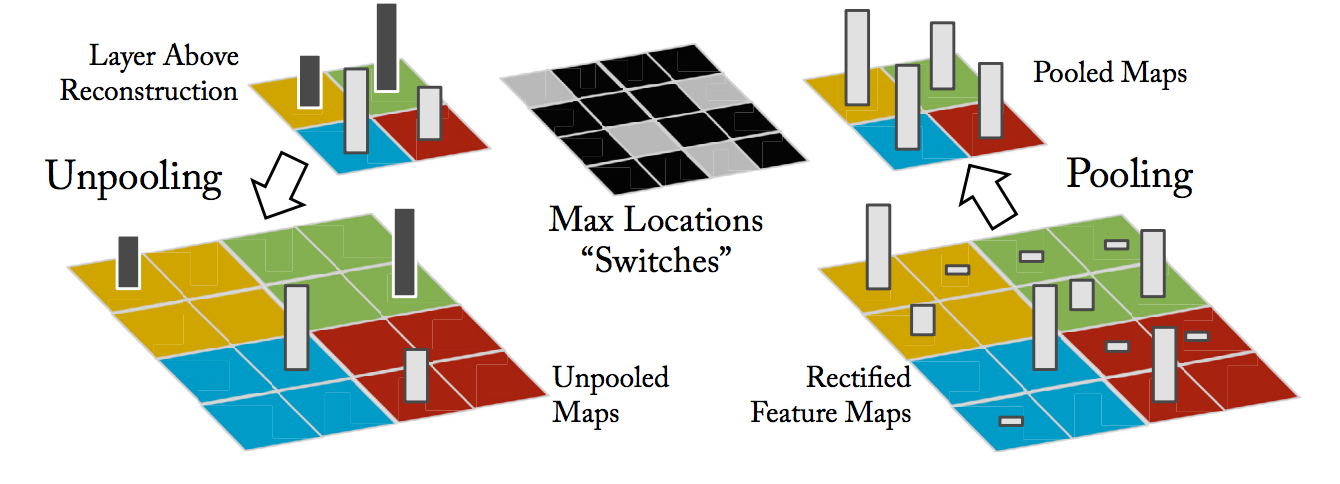
Basically, keep track of what activated a pool through the forward pass
Visualizing Convolutional Neural Networks
Pass unpooled map through ReLU
Visualizing Convolutional Neural Networks
Deconvolution using the transpose of the original filters
Experiments and Results
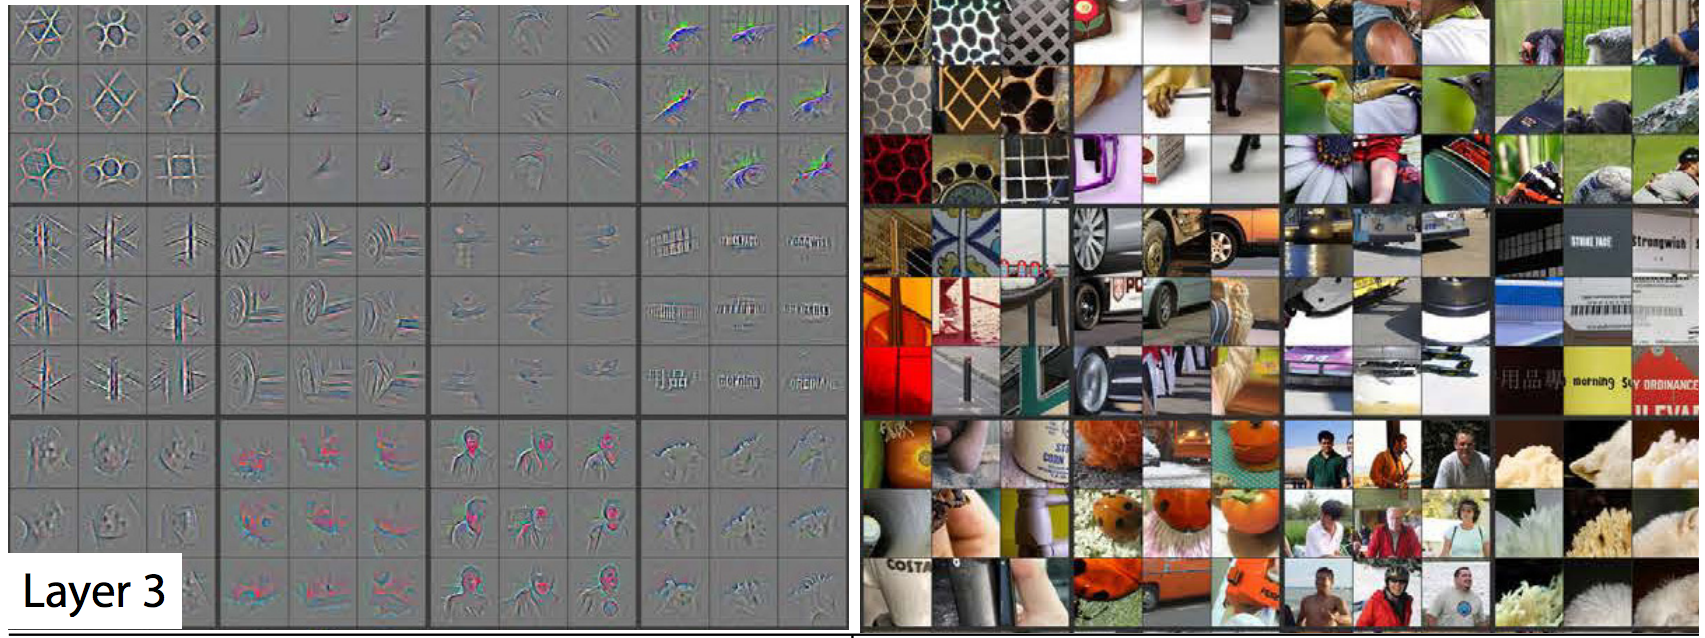
For a given layer, pick some random features. Find images that maximally activate that feature.
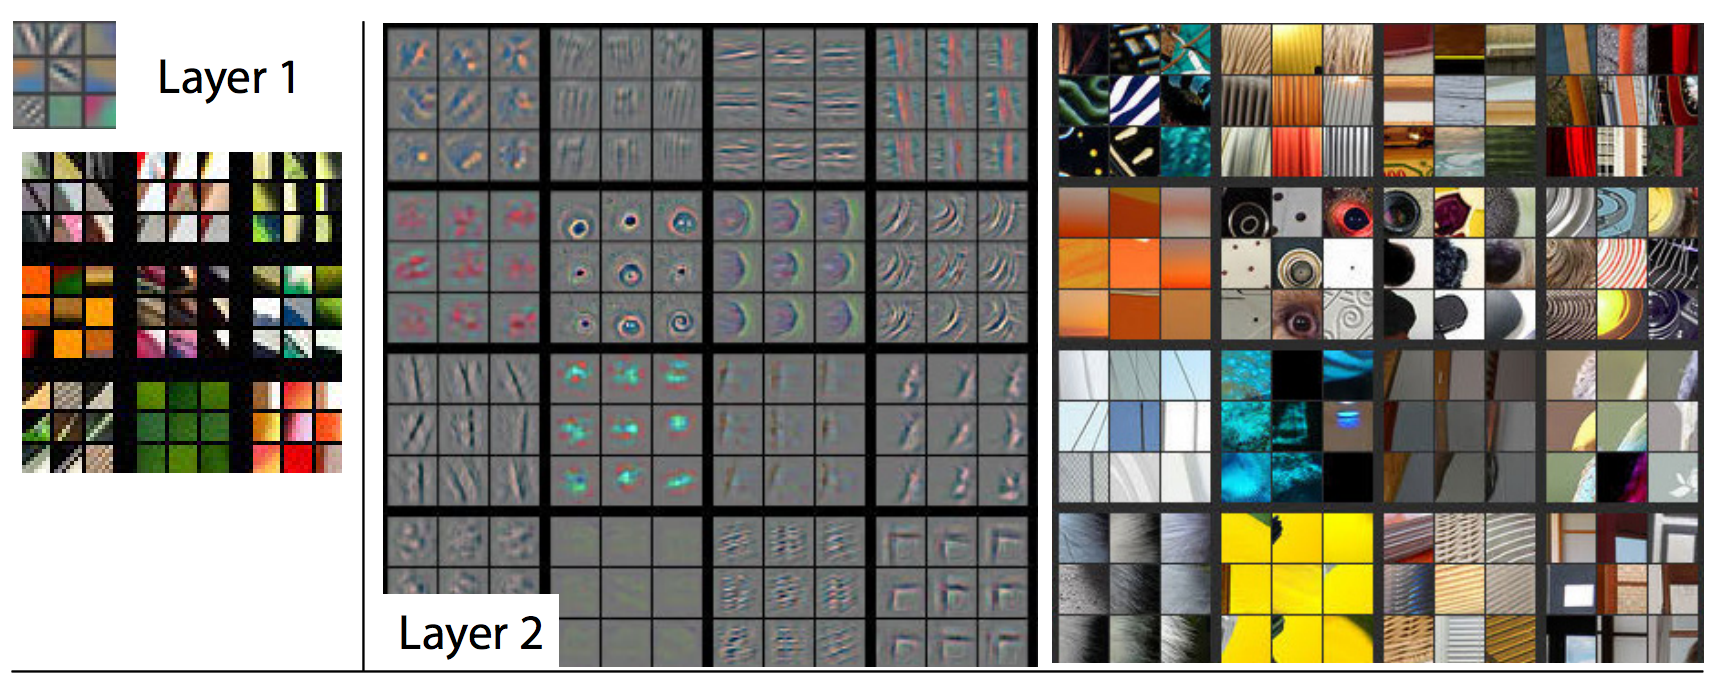
Experiments and Results
For a given layer, pick some random features. Find images that maximally activate that feature.
Experiments and Results
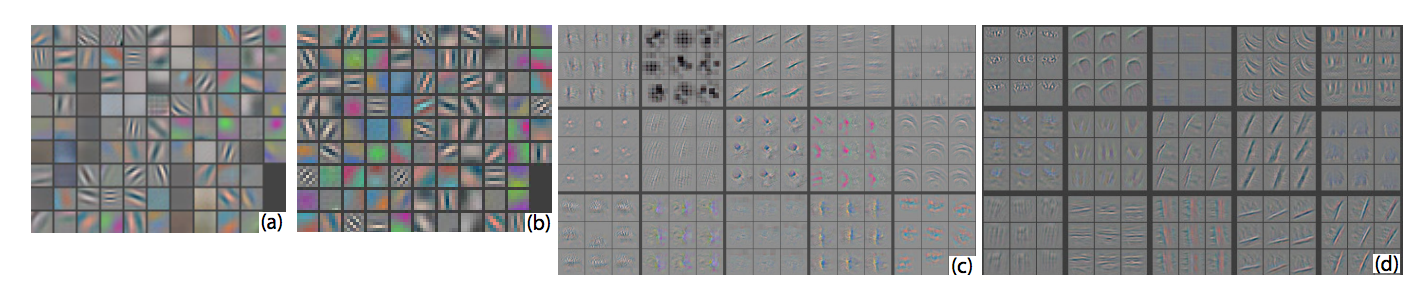
As a diagnostic tool, it allows you to pick out problematic filters.
Thanks!
Visualizing and Understanding CNNs
By Joshua Horacsek


