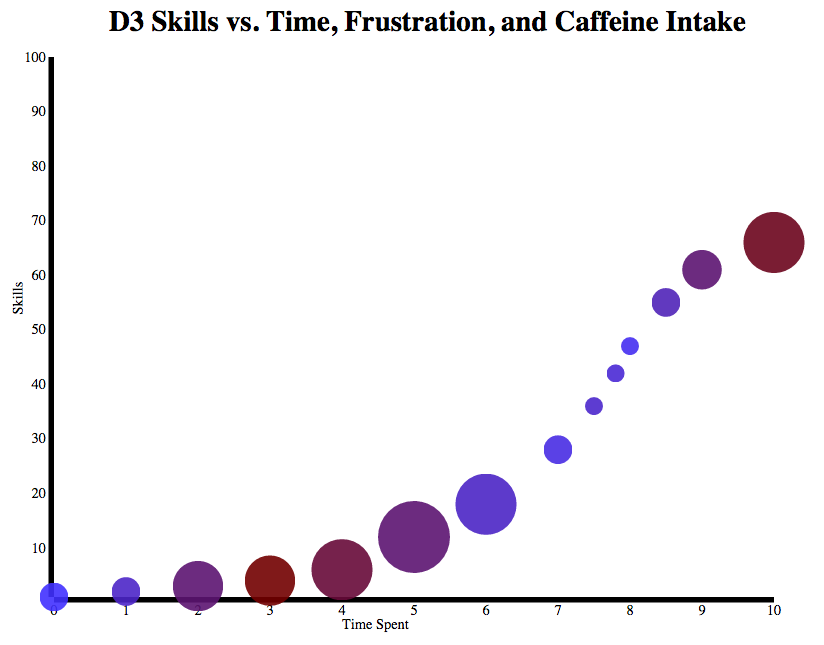
D3 Scales, Axes, and Graphs
Overview
- SVG
- Scales
- Color Functions
- Axes
Who am I?
Former SQL database guy turned JS dev


Some D3 things I've built
'npm install' visualizer for 2015
Political Funding Visualizations
- Topojson
- Heatmaps
- Pie Charts
- Graphs!
- Zoom & Pan

SVG
The container for all things D3
<body>
    <div class='chart'></div>
</body>


var svg = d3.select('.chart').append('svg')
    .attr('width', width)
    .attr('height', height);
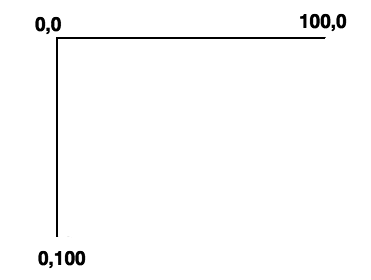
SVG
Not Normal Coordinates
Scales
Three Major Types
- Quantitative
- Ordinal
- Time
But they all operate roughly the same way
The building block of D3 graphs
(After data, of course)
Scales
scale.domain()
scale.range()
(Input)
(Output)
var myScale = d3.scale.linear()

myScale.domain([0,1])

myScale.range([0,100])

console.log(myScale(.9))
//90
var myScale = d3.scale.linear()
myScale.domain([0,1])
myScale.range([0,svgWidth])
console.log(myScale(.9))
//Pixel PositionScales
var myScale = d3.scale.linear()
    .domain([0,10])
    .range([0,100]);

console.log(myScale.domain())
// [0,10]
console.log(myScale.range())
// [0,100]
Scale methods are getters and setters
//From D3 source

scale.domain = function(x) {
    if (!arguments.length) return domain;
    domain = x.map(Number);
    return rescale();
};
The string "if (!arguments.length) return" is in the D3 source over 150 times
Scales
Useful Helpers: d3.min(), d3.max(), d3.extent()
data = [
    {a:1},
    {a:10},
    {a:20}
]

d3.min(data,function(d){return d.a})
//1

d3.max(data,function(d){return d.a})
//20

d3.extent(data,function(d){return d.a})
//[1,20]
var extent = d3.extent(data,function(d){
return d.a});
var myScale = d3.scale.linear()
.domain(extent);
console.log(myScale.domain())
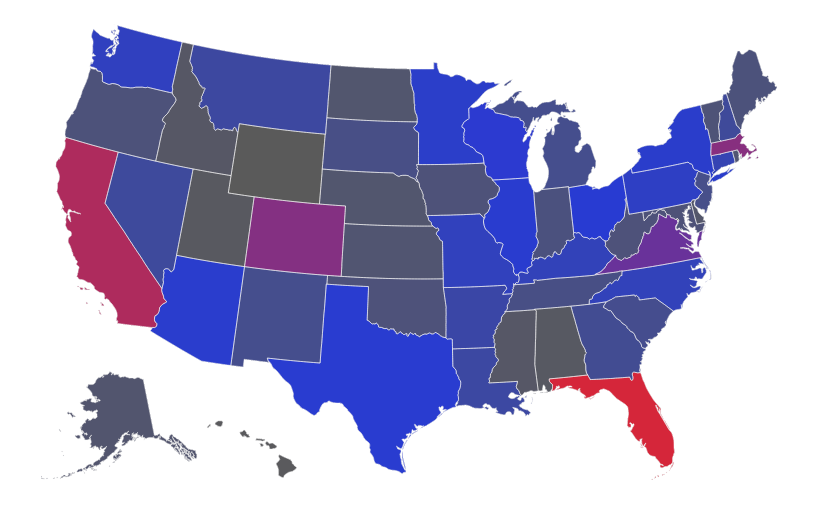
//[1,20]Color Functions
var colorFunc = d3.scale.linear()
    .domain([0, topTotal / 2, topTotal])
    .range(['#4C4C4C', '#0b24e5', '#e50b24']);

svg.selectAll(".state")
    .style('fill', function(state) {
        return colorFunc(state.total)
    });
Just scale functions that output colors
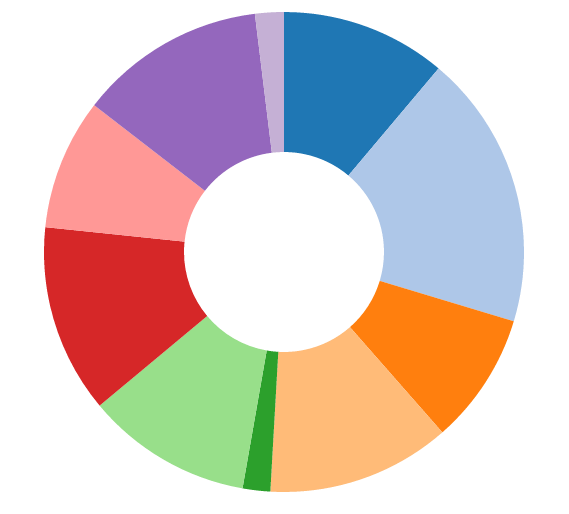
Color Functions
var colorFunc = d3.scale.category10();

.style('fill',function(d){
    return colorFunc(d.prop)
}

//Ordinal (discrete) Scale
console.log(colorFunc('justin'))
//'#1f77b4'

d3.scale.category20()
d3.scale.category20b()
d3.scale.category20c()
Helpful starters
Axes
Combine svg's with scales
var myScale = d3.scale.linear()
    .domain([0,10])
    .range([0,svgDimension]);

var myAxis = d3.svg.axis()
    .scale(myScale);
d3.svg.axis()
Axes
Mind your SVG coordinates
var xScale = d3.scale.linear()
    .domain([0,100])
    .range([0,svgWidth]);//normal

var xAxis = d3.svg.axis()
    .scale(xScale)

var yScale = d3.scale.linear()
    .domain([0,100])
    .range([svgHeight,0])//flipped

var yAxis = d3.svg.axis()
    .scale(yScale)
Bigger y value = farther down in svg, so scale range gets flipped
Axes
Appending Axes to the DOM
svg.append("g")
    .attr('class','x axis')
    .call(xAxis)

svg.append("g")
    .attr('class','y axis')
    .call(yAxis)
var xScale = d3.scale.linear()
.domain([0,100])
.range([0,svgWidth]);//normal
var xAxis = d3.svg.axis()
.scale(xScale)
var yScale = d3.scale.linear()
.domain([0,100])
.range([svgHeight,0])//flipped
var yAxis = d3.svg.axis()
.scale(yScale)Putting it Together
Data makes your scales

Scales make your graph
It all starts with the data

D3 Scales and Axes
By Justin Cohen
D3 Scales and Axes
D3 - Graph Building Basics