Building custom plugin for Kibana to visualise Oracle database audit logs
Supervisors:
Daniel Lanza
Prasanth Kothuri
Student:
Kristina Šatara
july-august 2016
Bigger picture
- Central repository for database audit logs
- Listener and alert logs to be parsed and stored in the central repository
- Performance metrics (AWR) for troubleshooting and capacity planning
- Possibility of Real-time analytics, Offline analytics and visualization
- Reusable open source solution
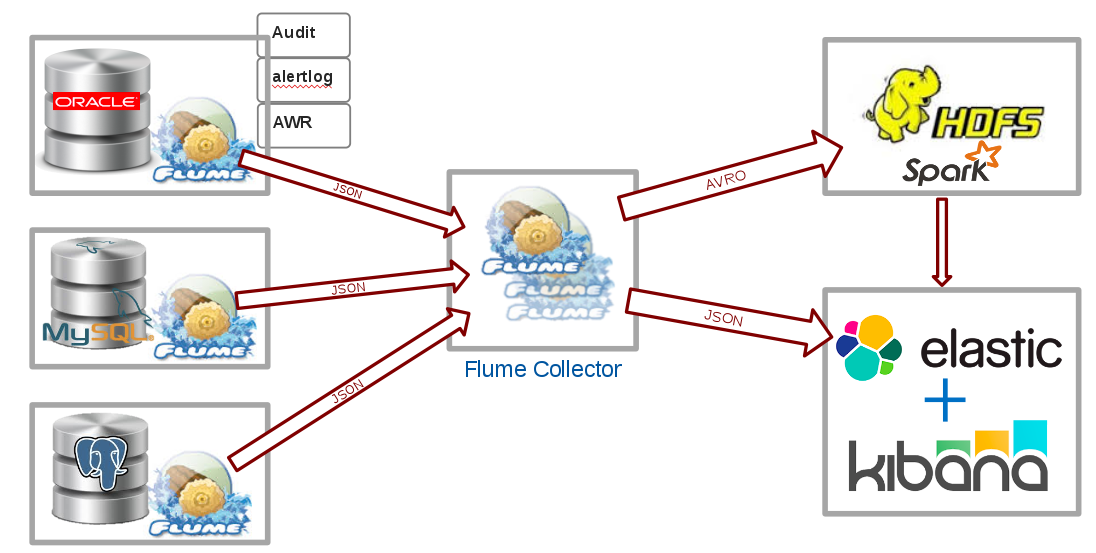
Architecture
Elastic Stack
Elasticsearch
Logstash
Kibana
Beats


Elasticsearch
- distributed, open source search and analytics engine
Kibana
- open source data visualisation platform
- histogram, geomaps, line and pie charts...
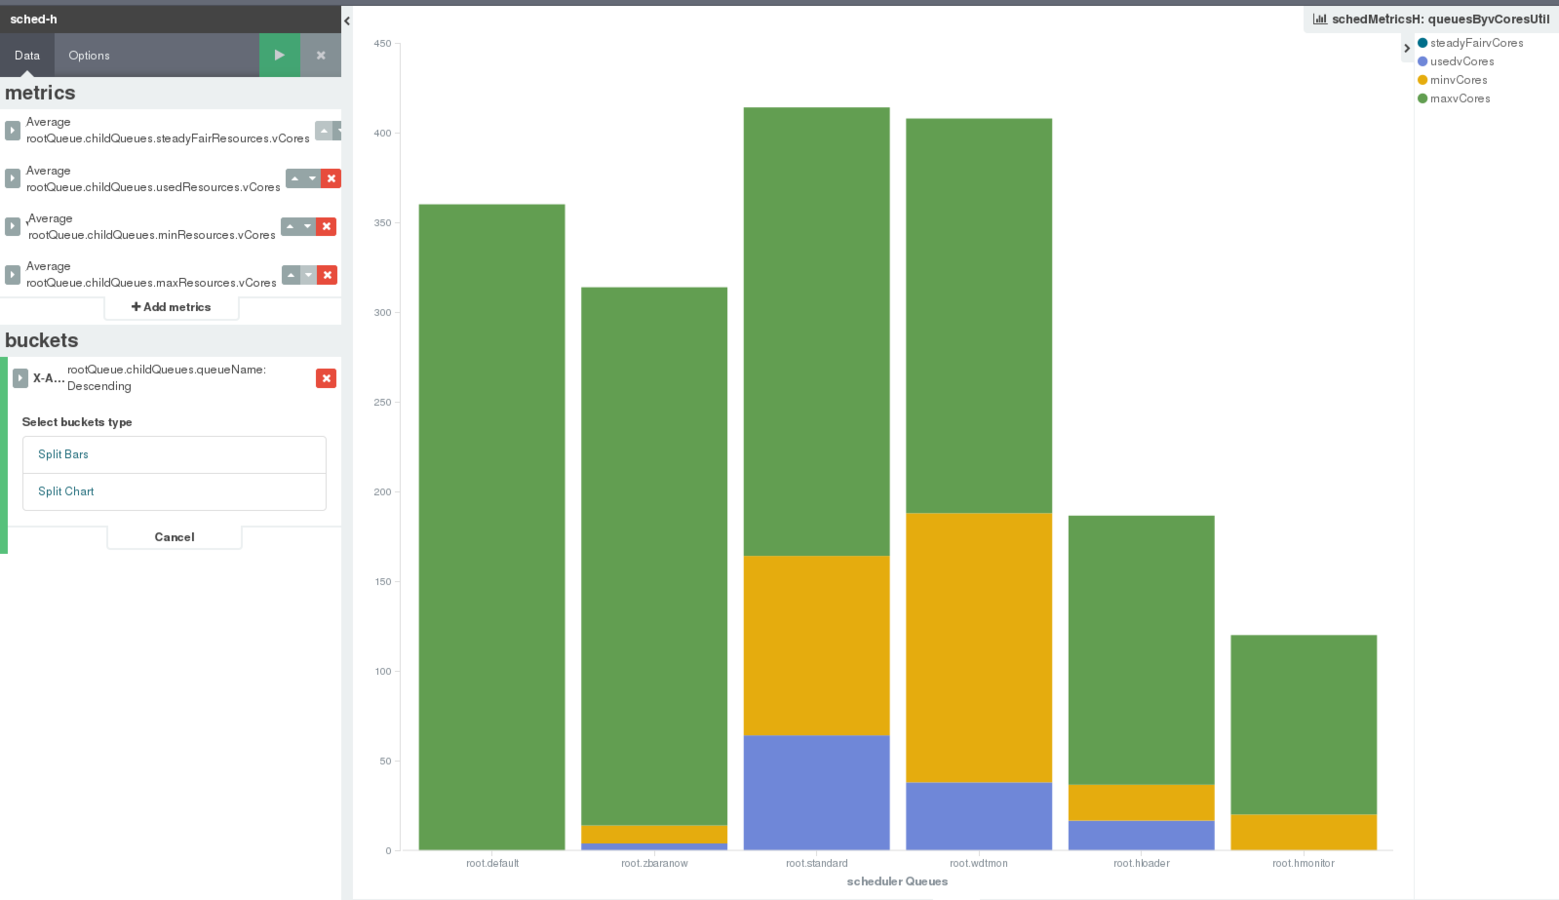
Kibana plugin - goals
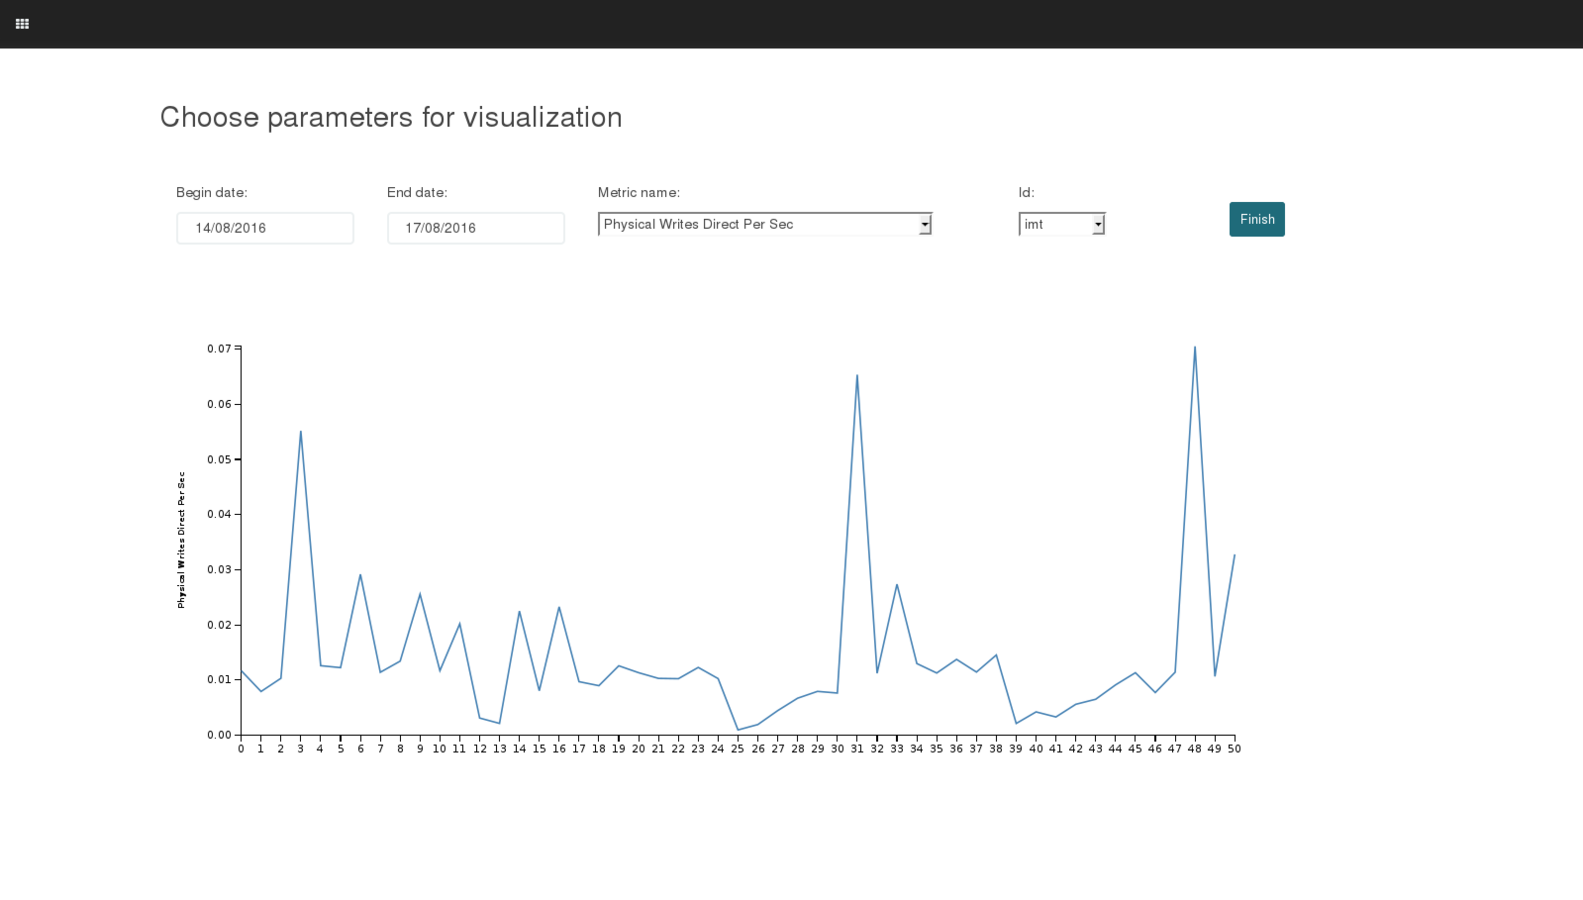
- create a new type of visualisation
- possibility of choosing begin and end date
- metric name
- database id
Developing Kibana plugin
- each plugin is npm module
- package.json provides list of all dependencies
- npm install command installs the dependencies
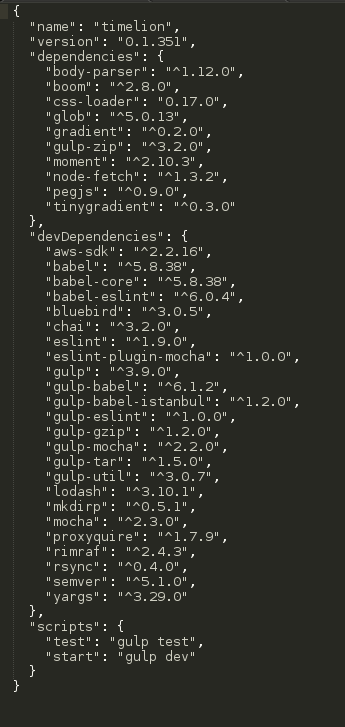
Timelion plugin's package.json
Developing Kibana plugin
- Yeoman generator provides basic structure of the plugin
mkdir my-new-plugin
cd my-new-plugin
yo kibana-plugin
- Generating plugin with yeoman
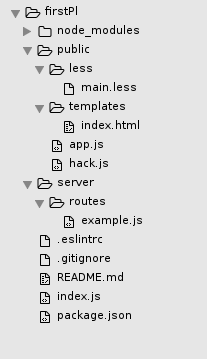
Developing Kibana plugin
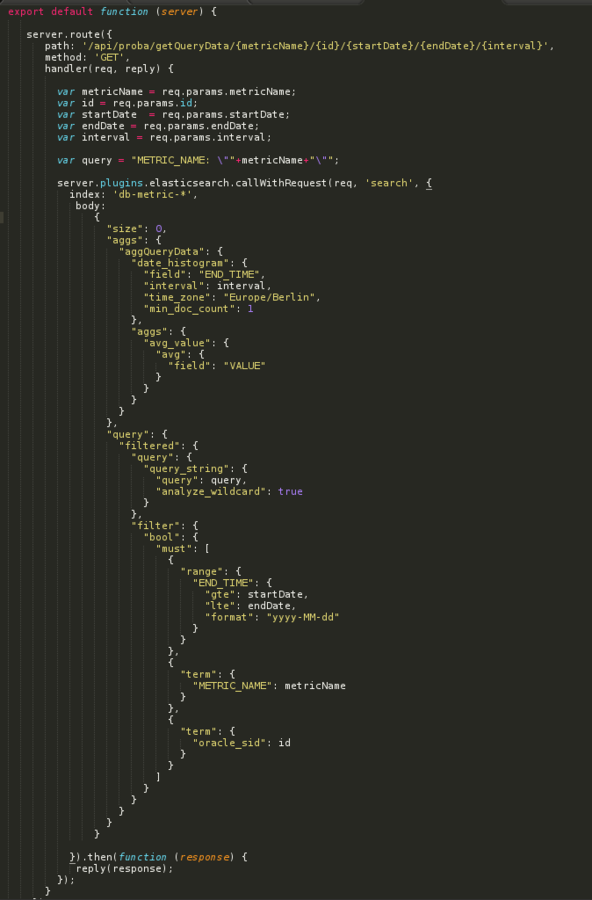
- adding new html files
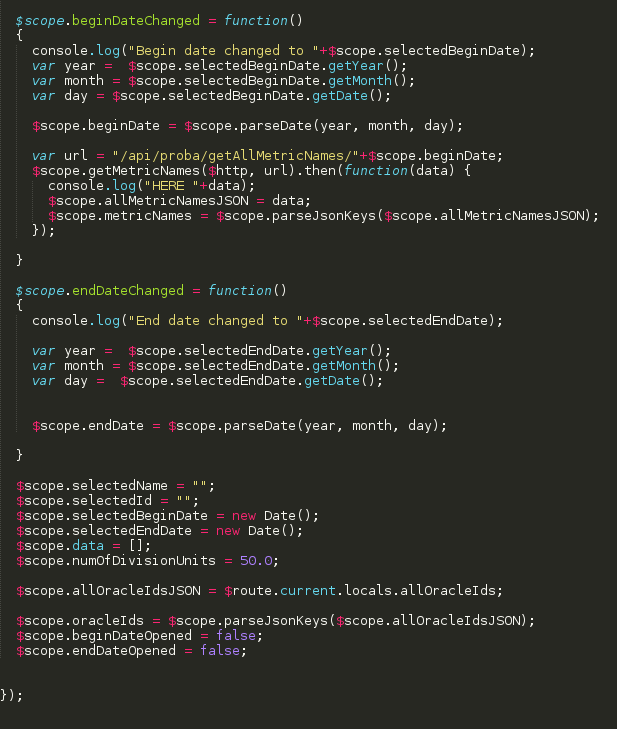
- new js files - controllers
- creating new routes for getting the data from Elasticsearch
Next steps

Developing Kibana plugin
AngularJS
- powerful JavaScript framework
- extends HTML with ng-directives
- provides data binding
- controllers

Developing Kibana plugin
Kibana plugin - during the work...
created new Kibana visualization type
created Kibana's simple plugin


plugin + existing Kibana's visualizations
Kibana plugin - during the work...
- so we decided to use D3 library for visualizations
How to install the plugin
1) switch to Kibana plugin directory
cd /opt/kibana/installedPlugins
2) clone the repository ( install the plugin )
git clone https://github.com/MsSquirrel/OracleLogs.git
3) install dependencies mentioned in package.json
npm install
4) restart Kibana
service kibana restart
How to extend the plugin
- include Kibana's visualisations
- provide user possibility to choose the index and fields
Further work
- extend the plugin to include visualisation for database alert and listener logs
- use machine learning to analyse them
- use Kibana's visualisations instead of D3 library
Thank you!
GroupPresentation
By kristinasatara

