Causal Inference on
Human Society
with Natural Science Data
Masayuki Kudamatsu
Osaka School of International Public Policy (OSIPP)
Osaka University
16 May, 2018
Data Science
Prediction
Causal inference
Data Science
Prediction
Causal inference
Data Science
Prediction
Causal inference
Today's lecture:
3
examples of
how natural science data
helps economists
conduct causal inference
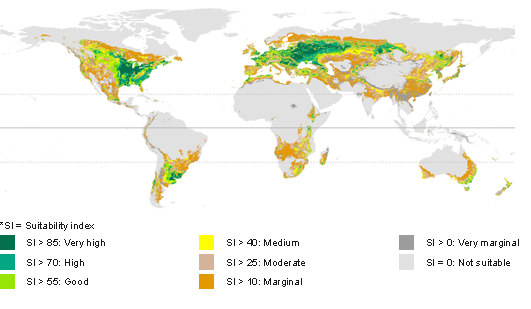
Suitability for Agriculture

Natural science data #1
Weather "forecast" in 1871
Natural science data #2
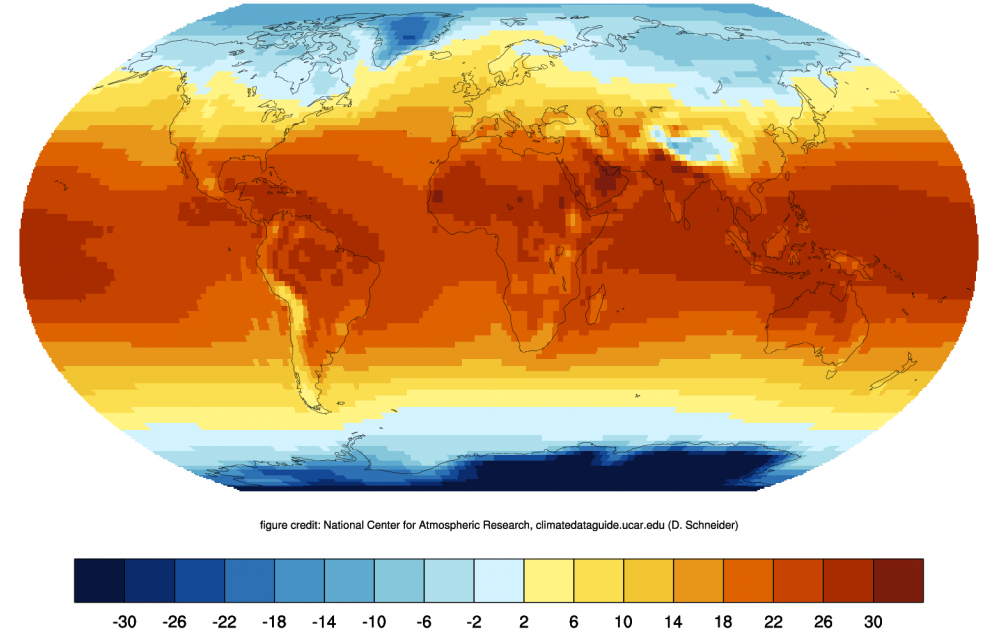
(The above image refers to the mean temperature for 1951-1980)
Potential crop yields (FAO-GAEZ)
Natural science data #3
These natural science data help us learn
1
2
A cause of ethnic diversity
Impact of Tsetse flies
on African economic development
3
Origin of states
Before diving in to these 3 examples...
Ordinary Least Squares (OLS) explained in 5 min.
Image adapted from Figure 3.1 of James et al. (2013)
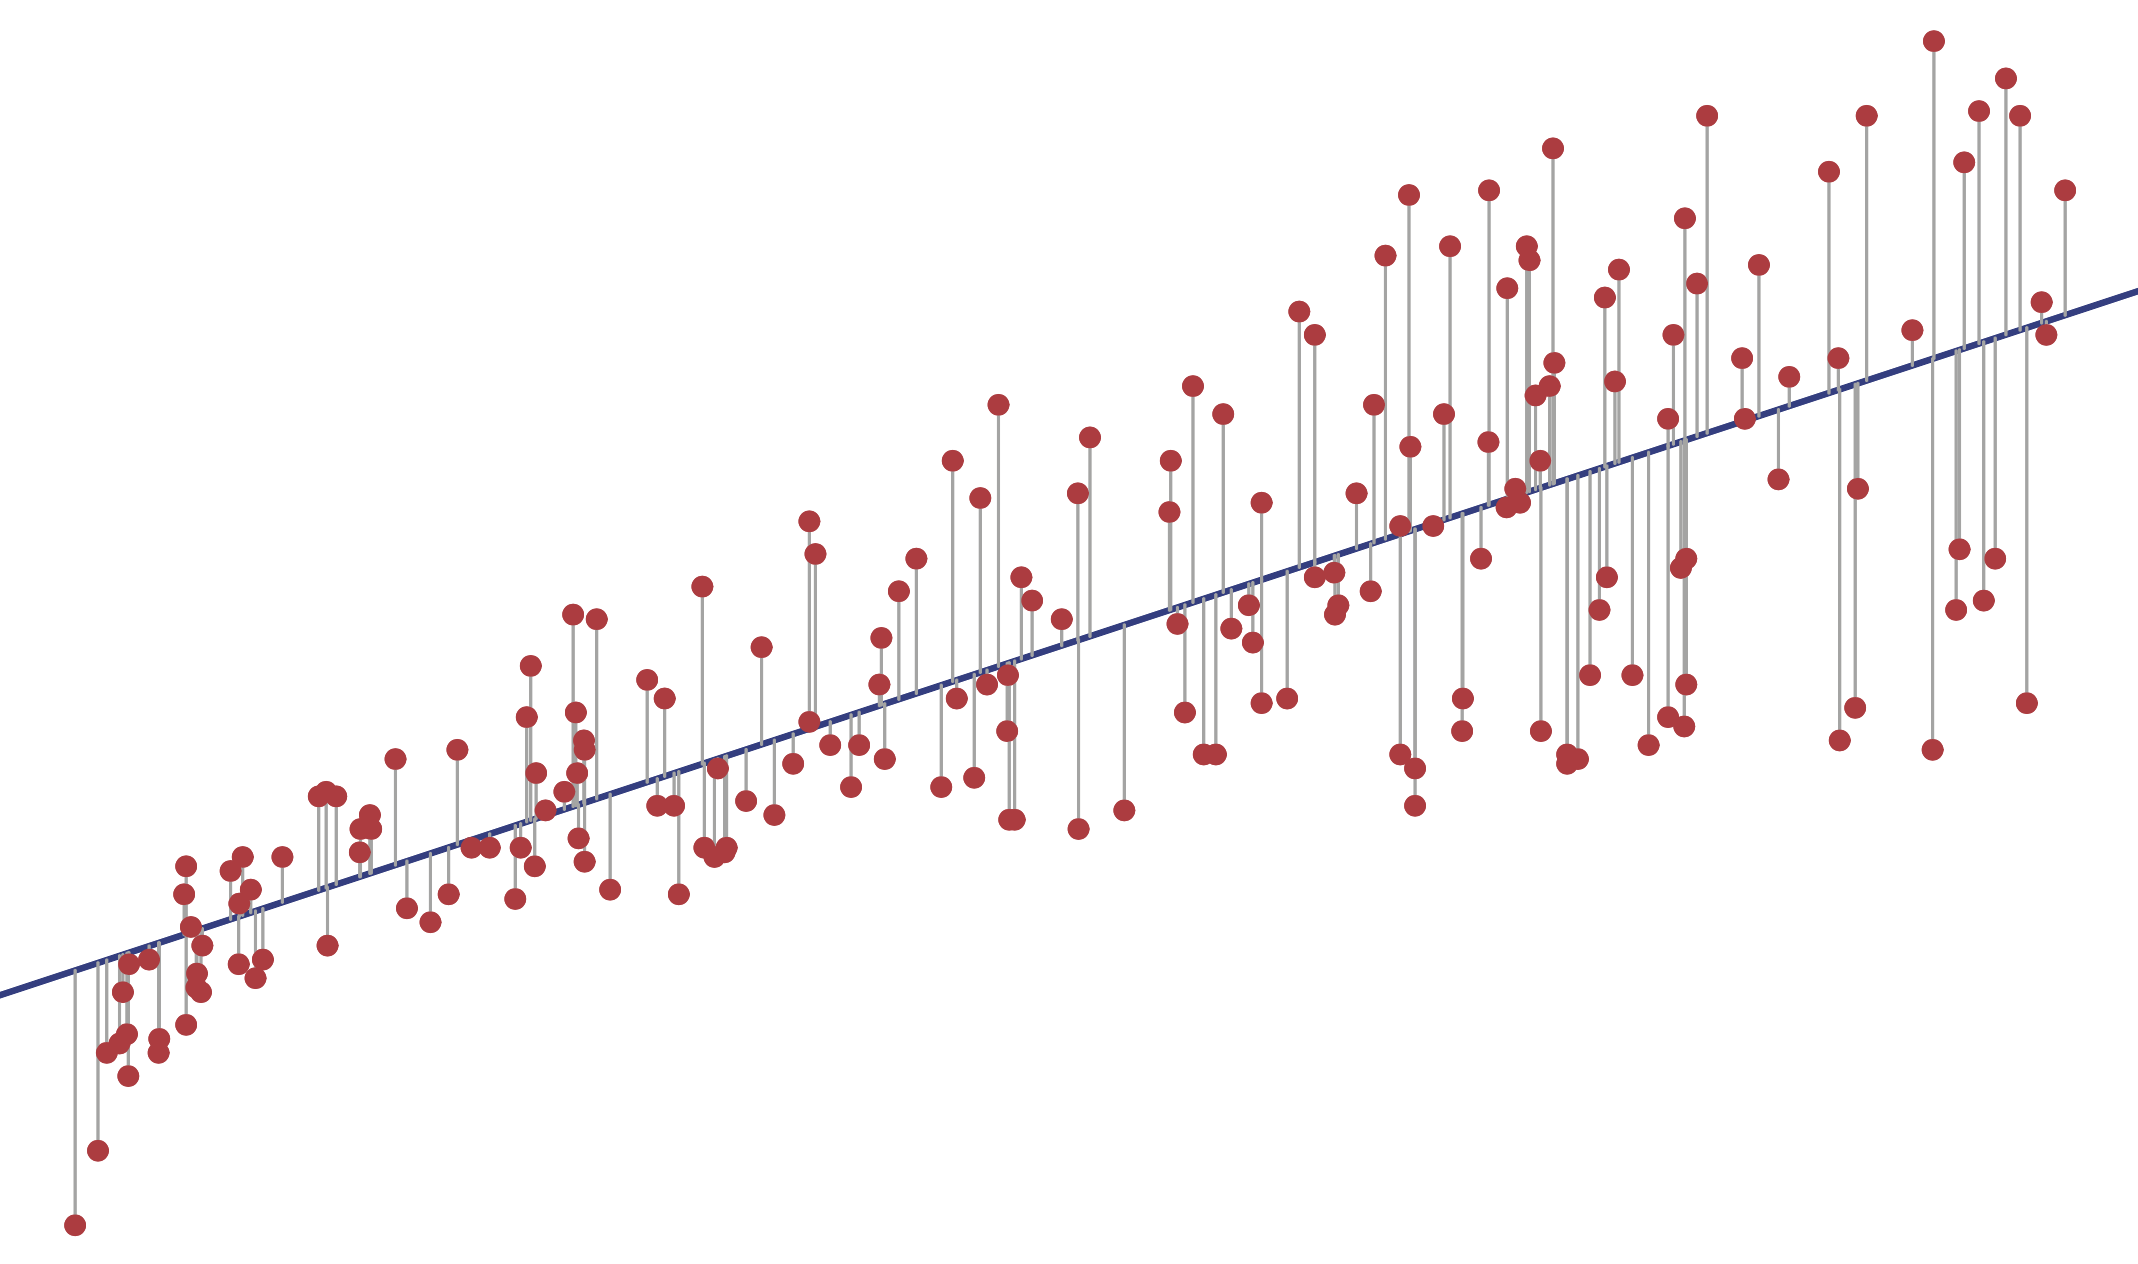
X
Y
Y_i=\alpha + \beta X_i +\varepsilon_i
\min_{\alpha,\beta} \sum_i \varepsilon_i^2
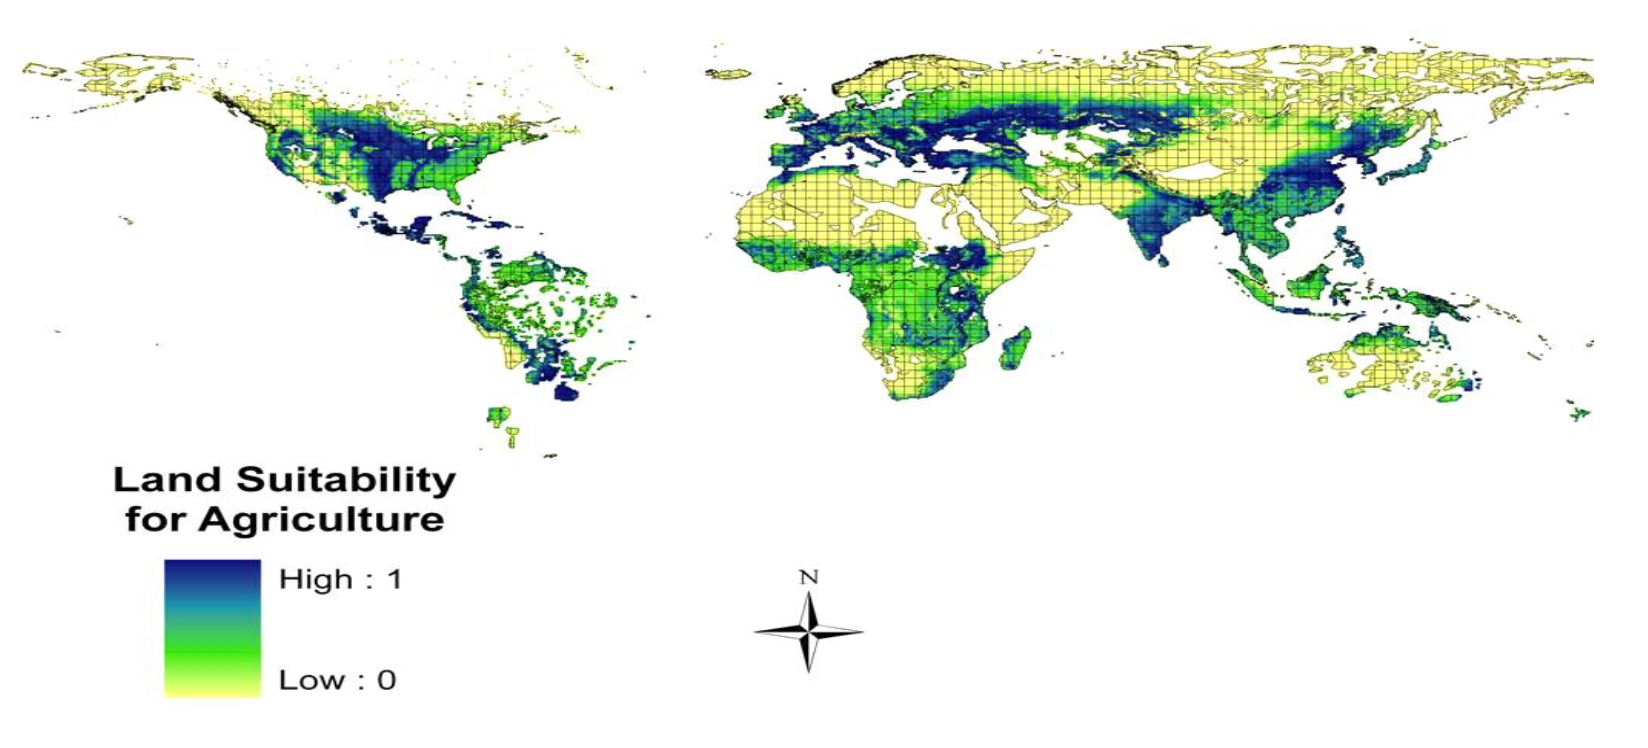
Suitability for Agriculture
Natural science data #1
This data is created as follows:
[1] Obtain spatial distribution of croplands from satellite images
[2] Divide the earth into 0.5-degree cells
[3] Calculate % of cells cultivated
[4] Regress [3] on degree-days, moisture, soil carbon density, soil pH
[5] Predict % of cells cultivated from [4]
This data is created as follows:
[1] Obtain spatial distribution of croplands from satellite images
[2] Divide the earth into 0.5-degree cells
[3] Calculate % of cells cultivated
[4] Regress [3] on degree-days, moisture, soil carbon density, soil pH
[5] Predict % of cells cultivated from [4]
Process [4] removes
human factors for cultivation
e.g. wars, population growth
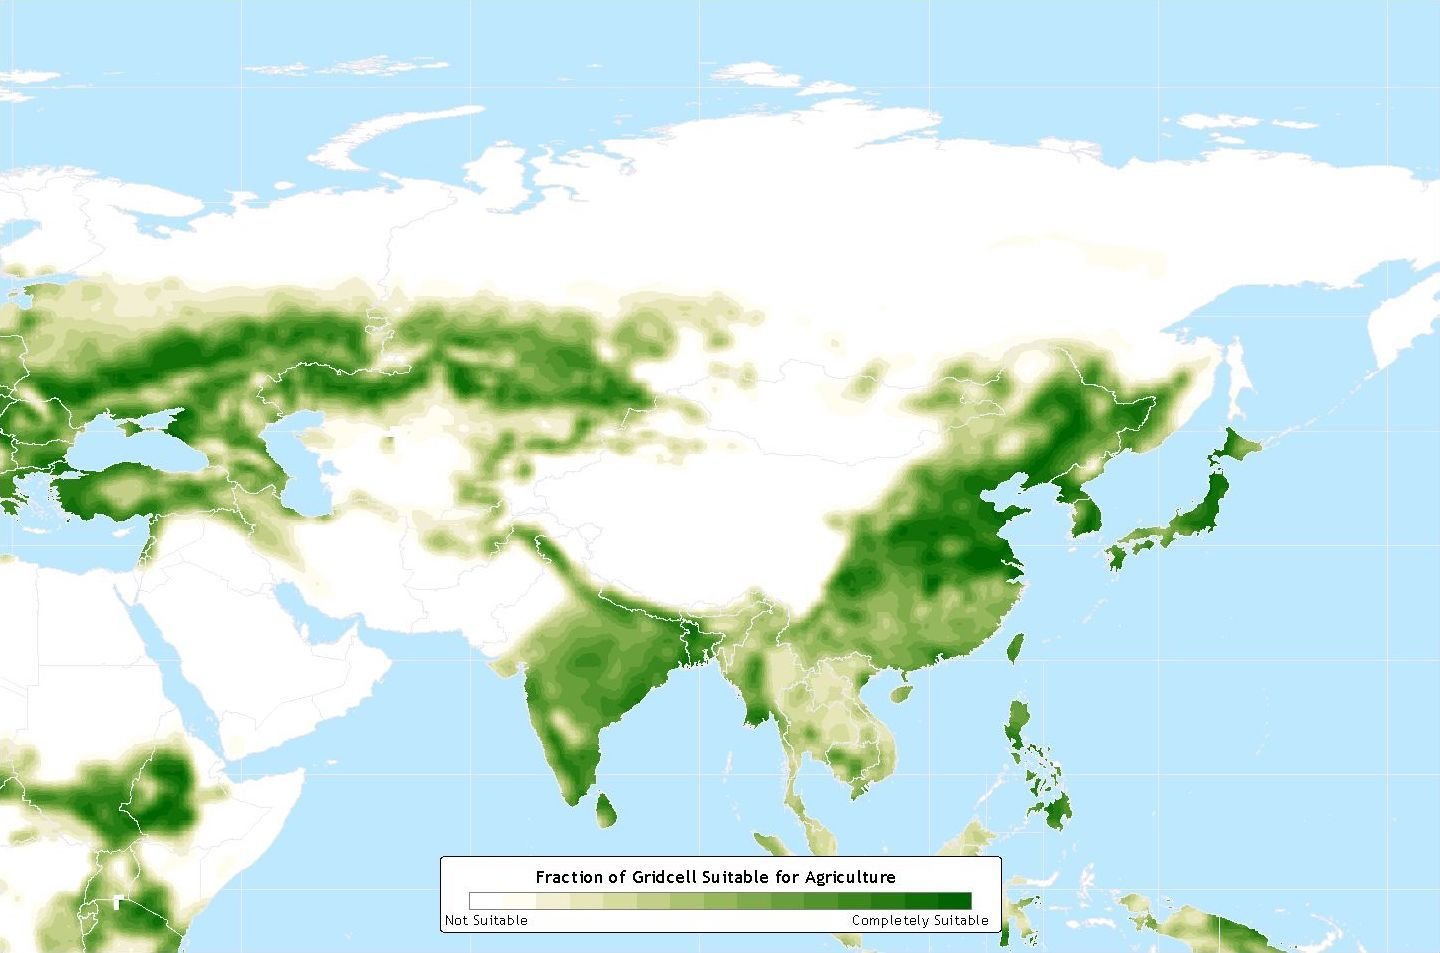
Suitability for Agriculture in Asia
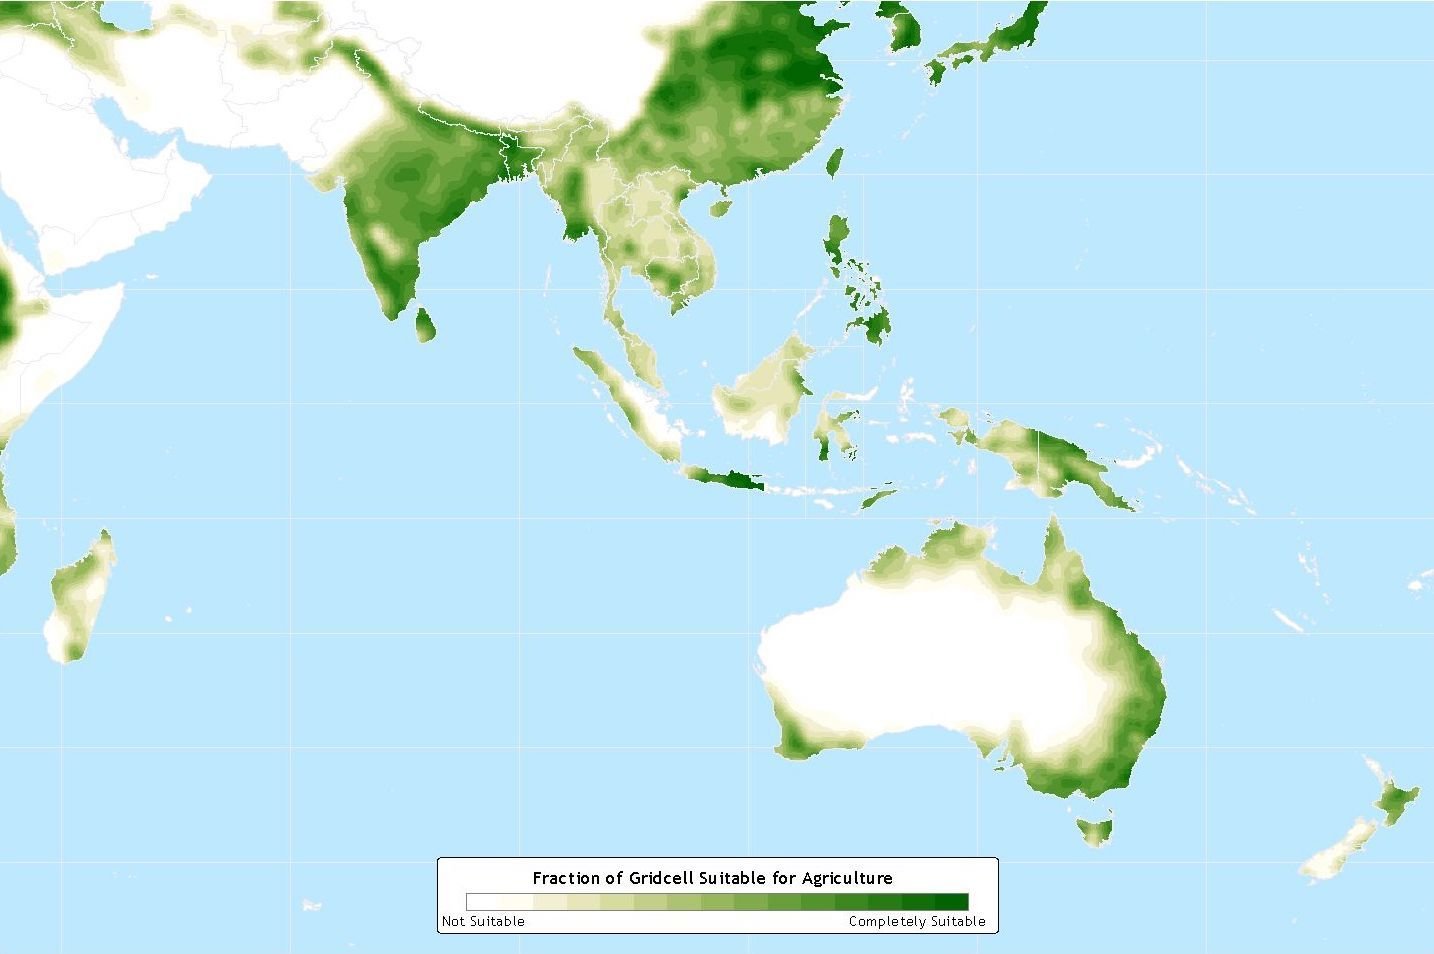
Suitability for Agriculture in Oceania
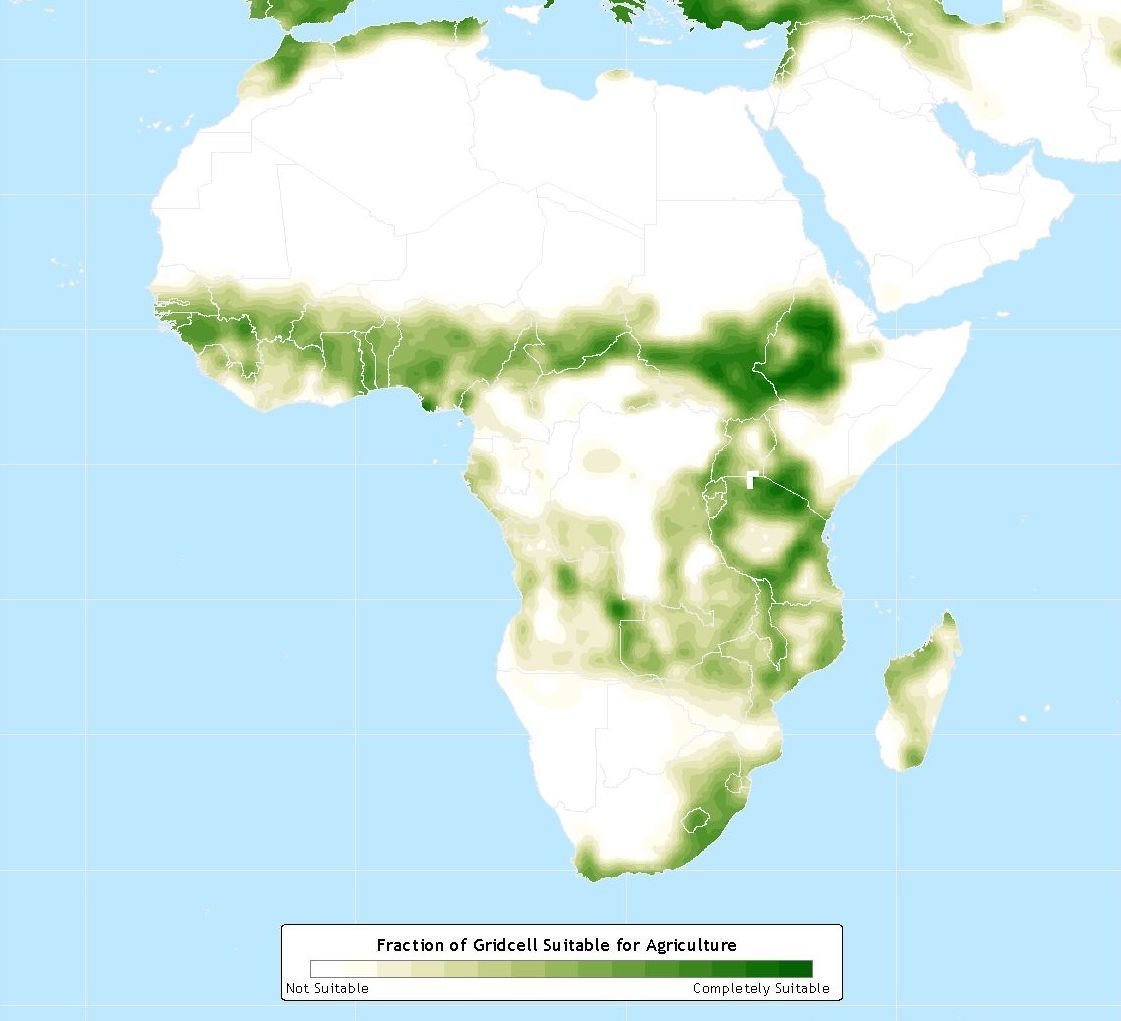
Suitability for Agriculture in Africa
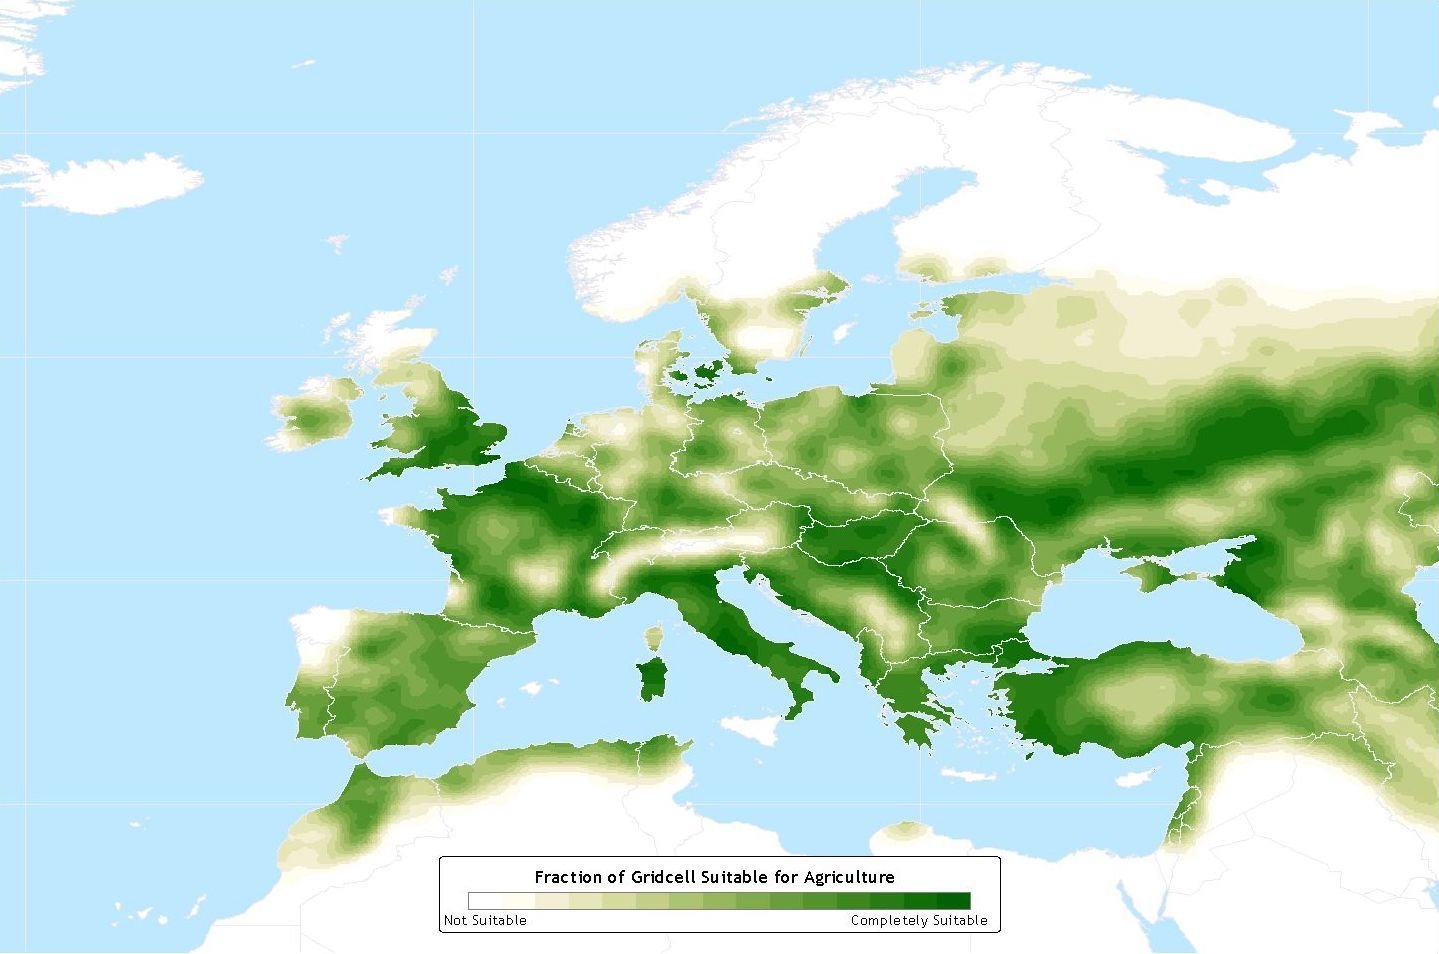
Suitability for Agriculture in Europe
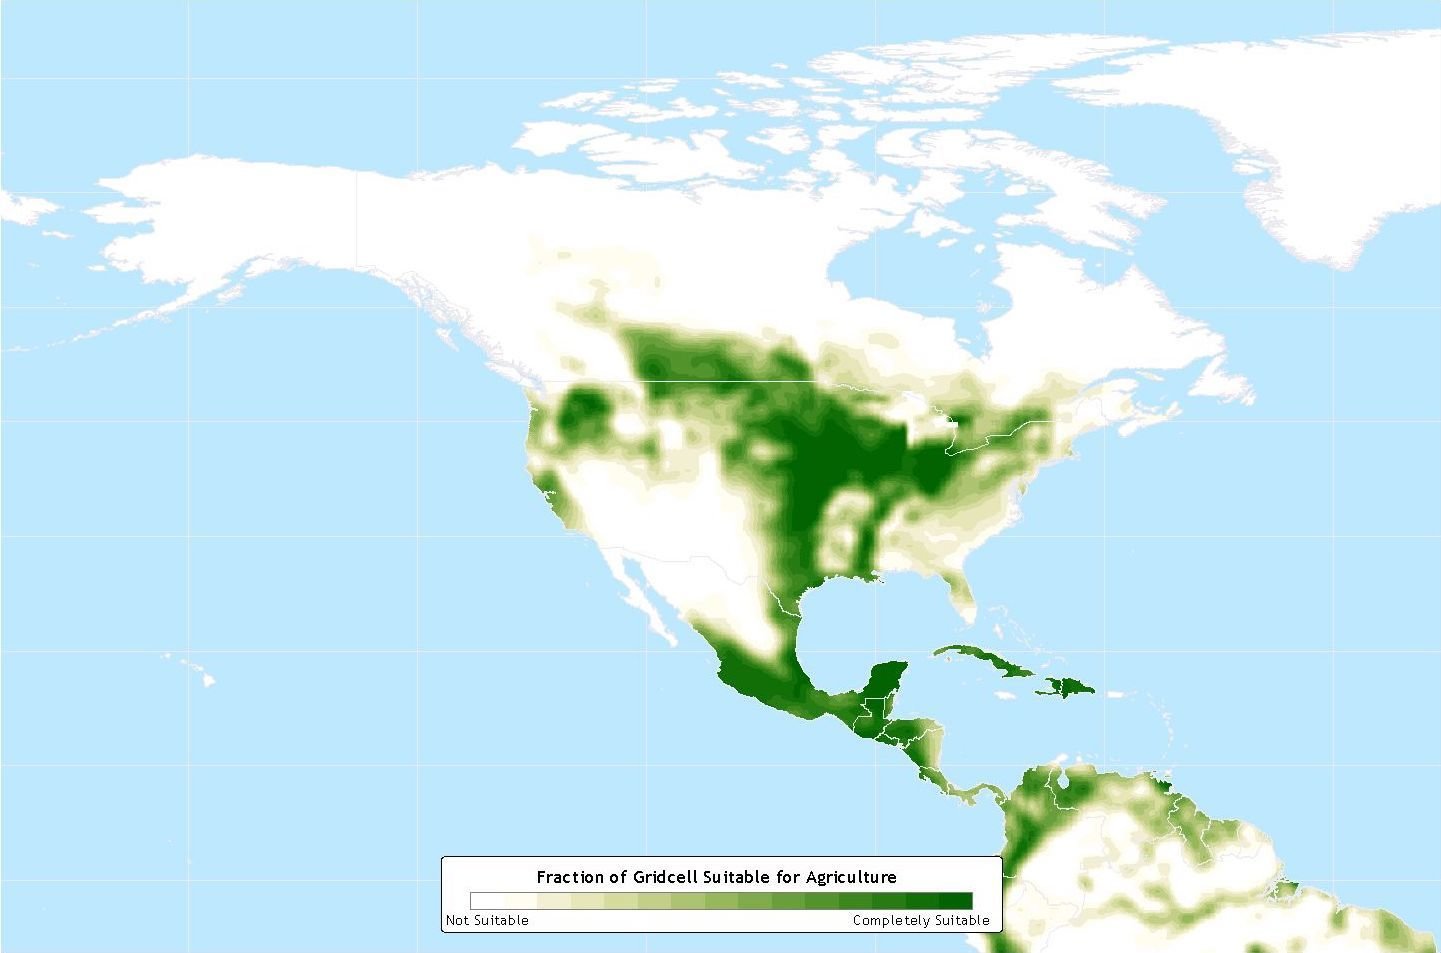
Suitability for Agriculture in North America
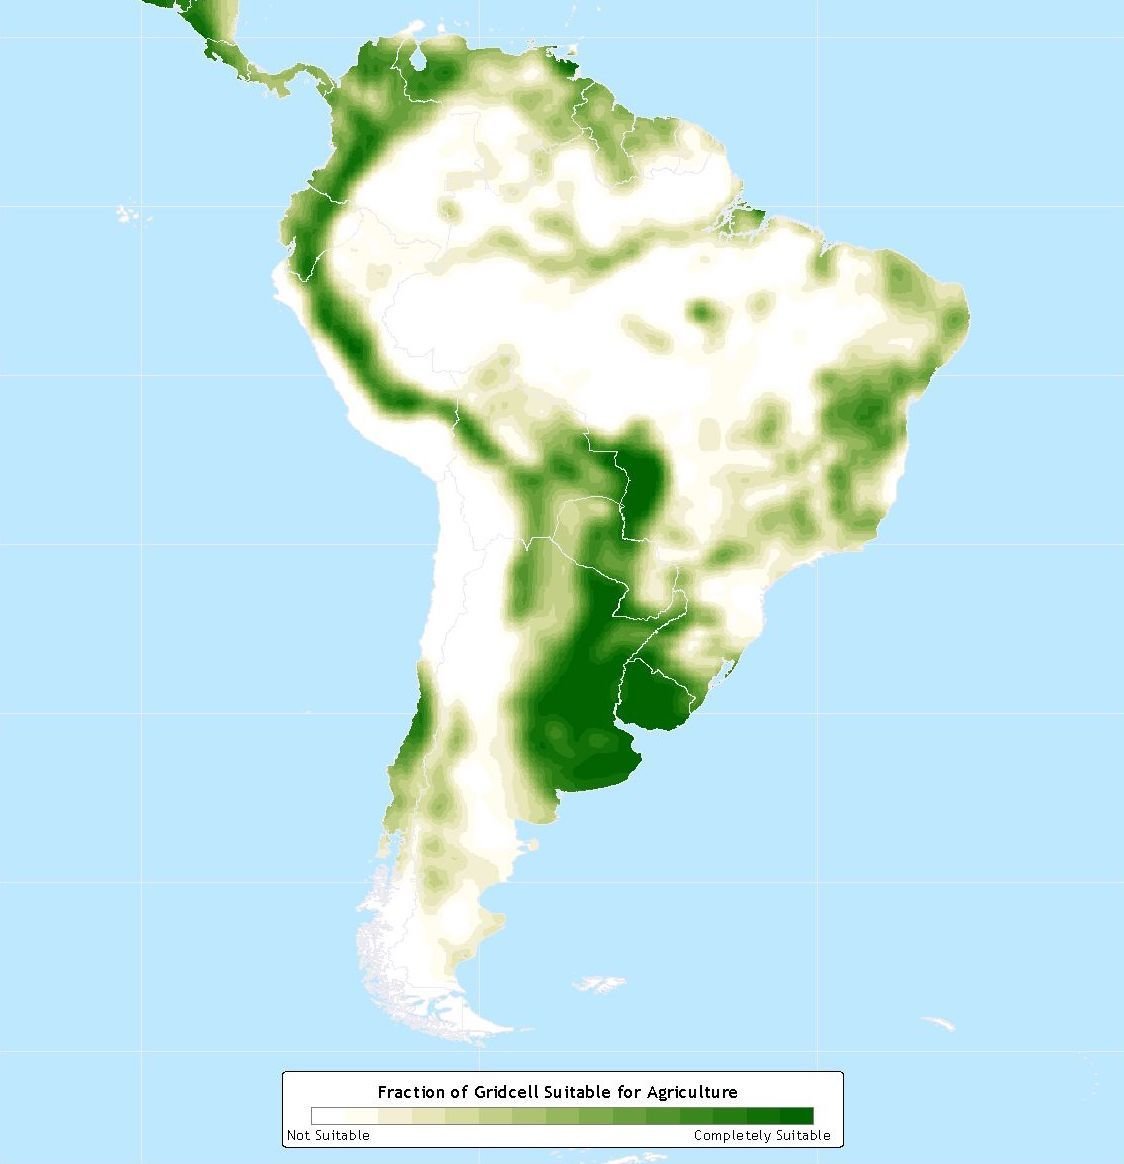
Suitability for Agriculture in South America
In economics, it's been known that
ethnic diversity is associated with lower economic growth
In antholopology, some studies suggest
linguistic diversity is associated with ecological diversity
Stelios Michalopoulos,
an economist at Brown University,
provides systematic evidence
for language-ecology relationship
in his 2012 paper.

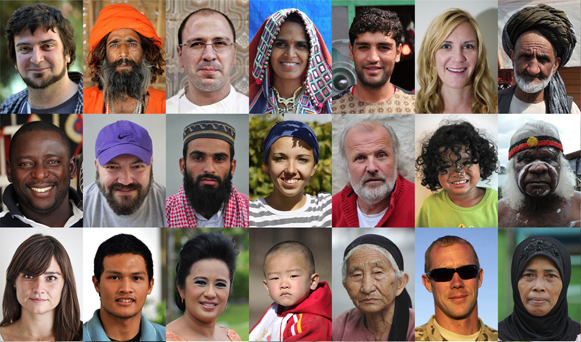
A seemingly irrelevant topic in social science:
Origin of Ethnic Diversity
Calculate the standard deviation of suitability for agriculture
within each country
Measuring ecological diversity for humans:
Count the number of languages spoken within each country
from the World Language Mapping System
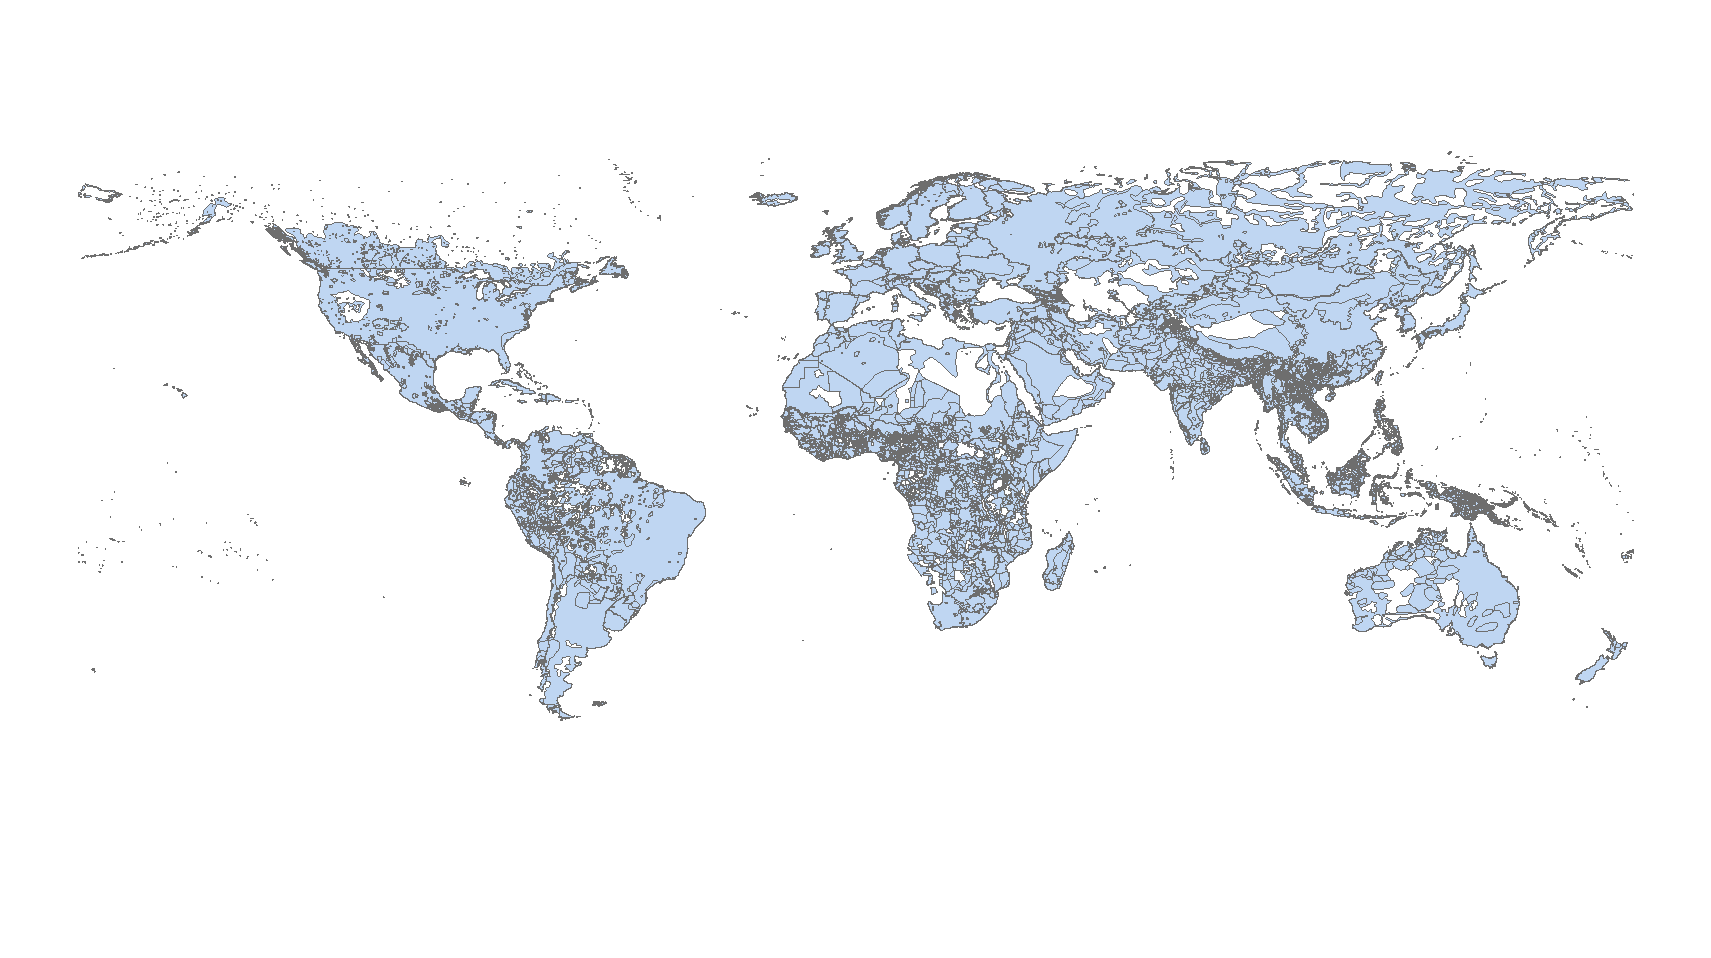
Measuring linguistic/ethnic diversity
Example: Nepal vs Greece
Source: Figure 2 and page 1514 of Michalopoulos (2012)
# of languages
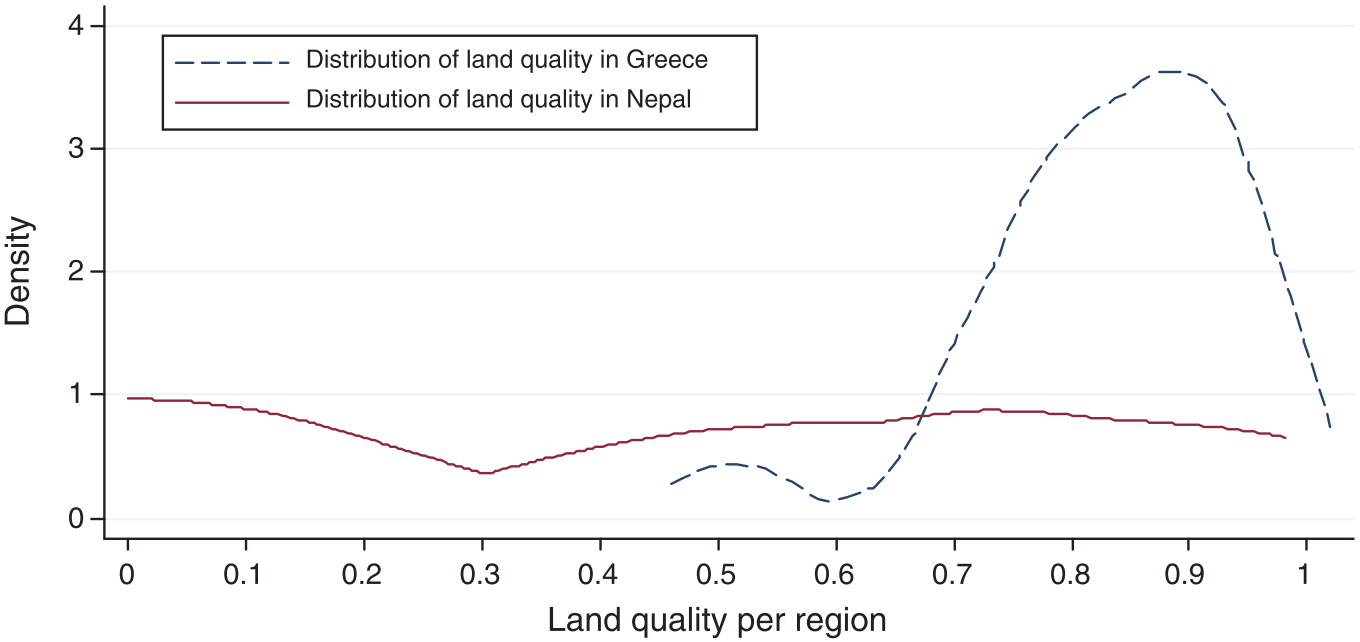
107
14
Nepal
Greece
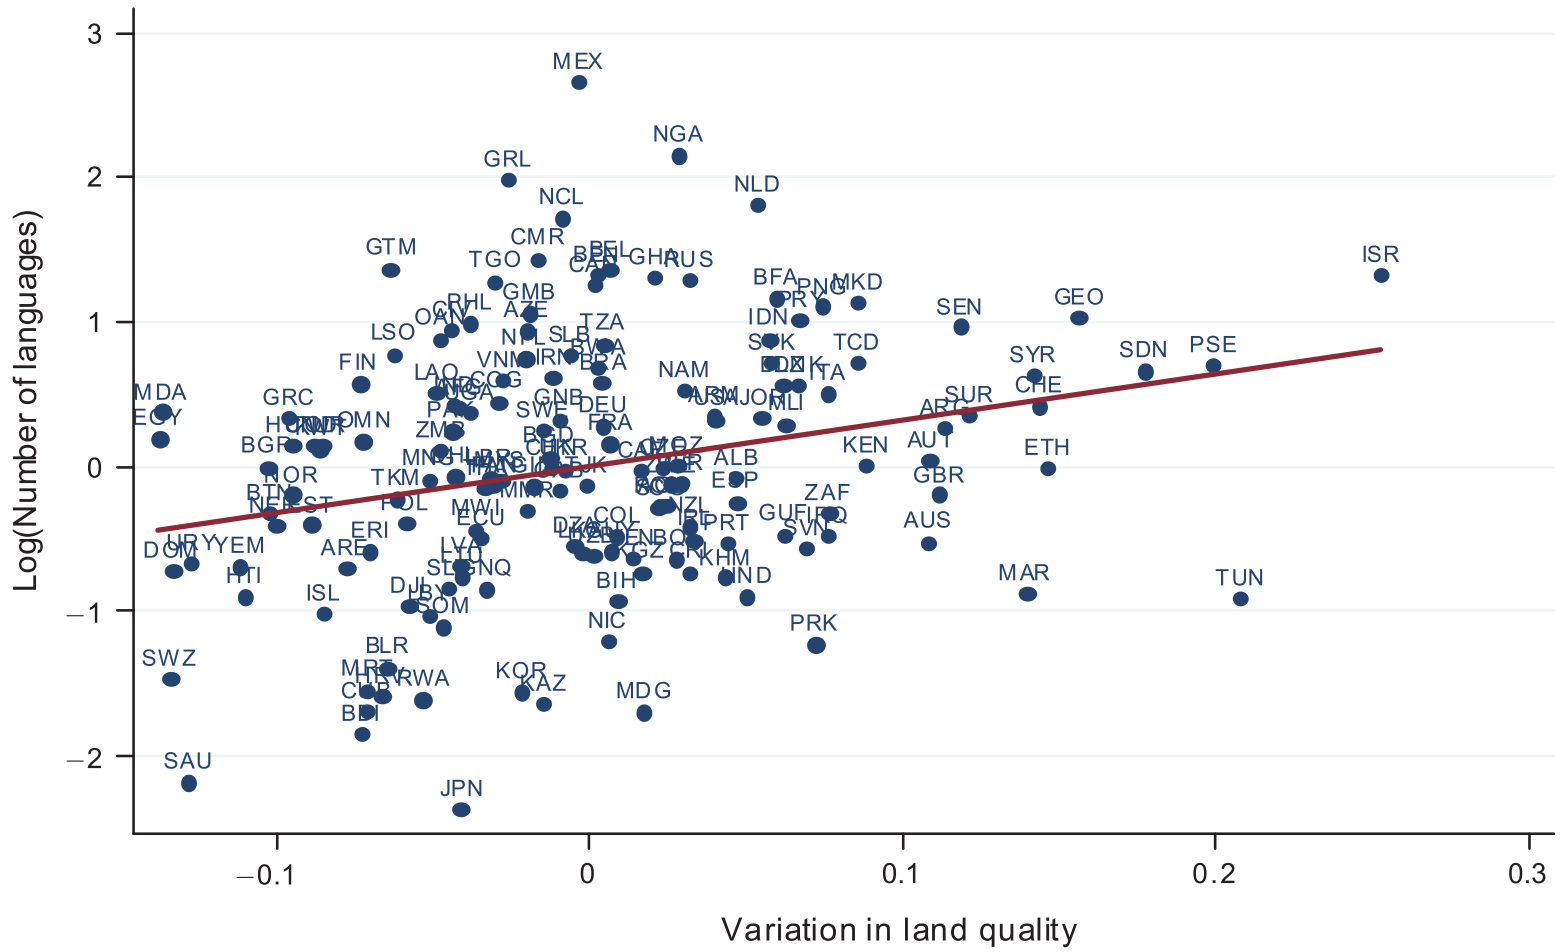
Whole world plot
Source: Figure 4 of Michalopoulos (2012)
A case of everywhere cultivable
Japan
Source: Figure 4 of Michalopoulos (2012)
Saudi Arabia
Source: Figure 4 of Michalopoulos (2012)
A case of everywhere deserted
Ethiopia
Source: Figure 4 of Michalopoulos (2012)
A case of numerous ethnic groups in Africa
Senegal
Source: Figure 4 of Michalopoulos (2012)
A case of numerous ethnic groups in Africa
Source: Figure 4 of Michalopoulos (2012)
Swaziland
A case of ethnically homogenous Africa
Source: Figure 4 of Michalopoulos (2012)
Can we interpret this as causal?
Natural science data gives random variation in X
Image adapted from Figure 3.1 of James et al. (2013)
X
Y
Then we can claim that X causes Y
Image adapted from Figure 3.1 of James et al. (2013)
X
Y
Natural science data gives random variation in X
Image adapted from Figure 3.1 of James et al. (2013)
X
Y
Known as
"Natural Experiments"
Source: Figure 4 of Michalopoulos (2012)
Can we interpret this as causal?
Look at 2.5-degree cells, not at countries
Source: Map 1 of Online Appendix to Michalopoulos (2012)
Weather "forecast" in 1871
Natural science data #2
(The above image refers to the mean temperature for 1951-1980)
The 20th Century Reanalysis project
Create the start-of-the-art model of climate
at the spatial resolution of 2-degree cells across the earth
"Forecast" the weather 6 hours ago from the current weather
Correct the "forecast" whenever actual observations are available
Repeat this up to the year of 1871
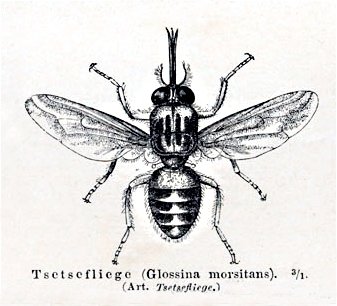
A seemingly irrelevant topic in social science:
Tsetse flies
& Africa's
economic development
Tsetse flies kill domesticated animals
Image sources: Encyclopedia Britannica and Wikipedia
Livestock is
historically important
for agriculture
Manure
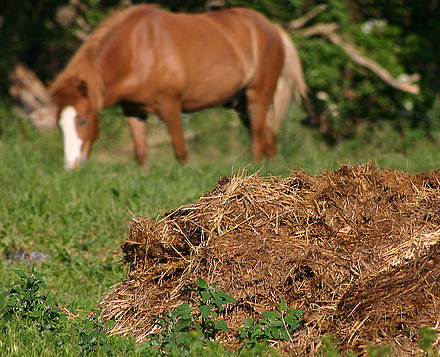
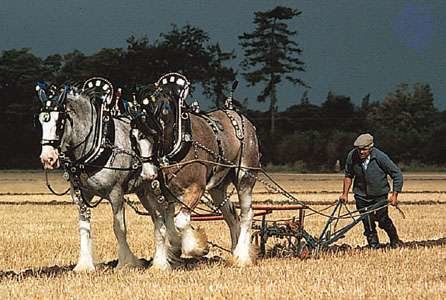
Draft power
Tsetse flies
only found in Africa
Anthropologists and historians speculate
Tsetse flies were the main cause for
Africa's economic backwardness
Africa is historically...
agricultural productivity: low
population density: low

Marcella Alsan
health economist in Stanford University
provides systematic evidence
on the impact of tsetse flies in her 2015 paper
Tsetse flies survive the longest
under warm but not too hot temperature
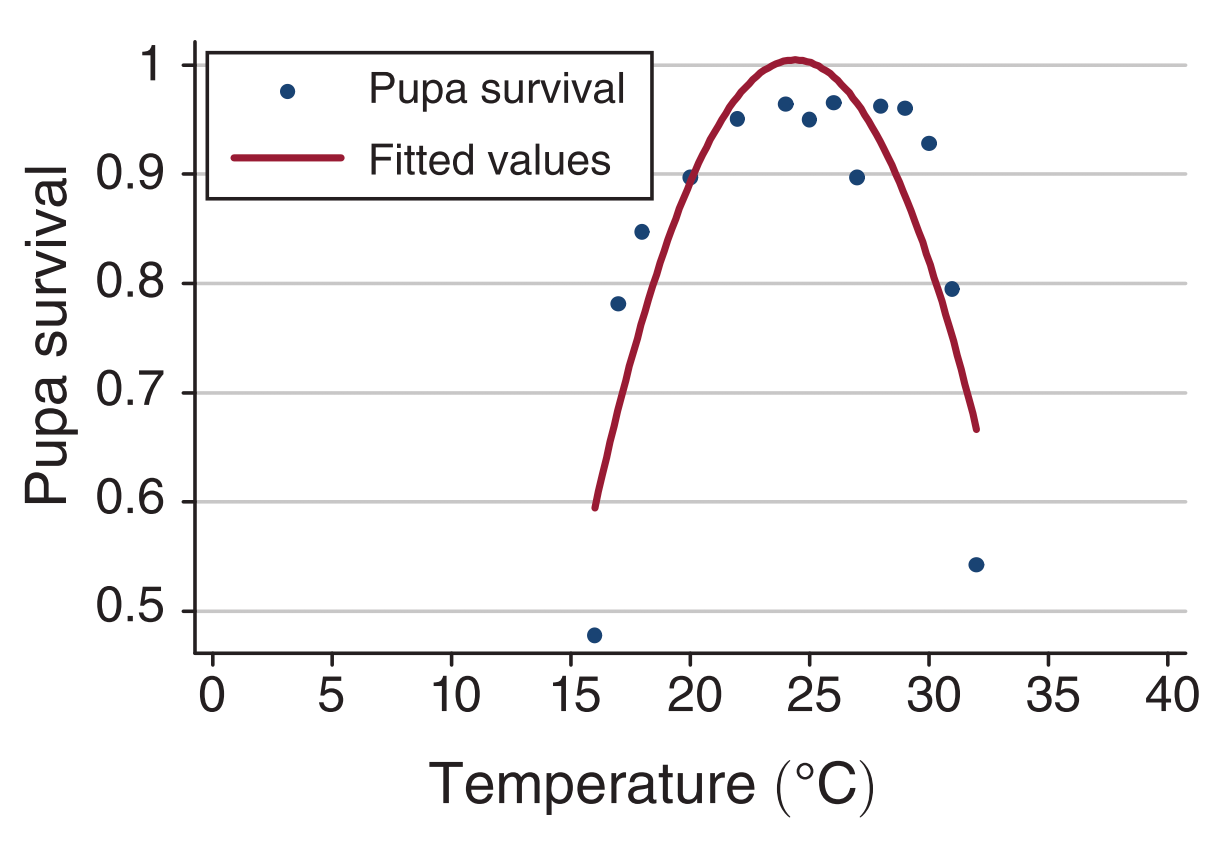
Source: Figure 2 Panel A of Alsan (2015)
Tsetse flies die more likely
when the air gets drier
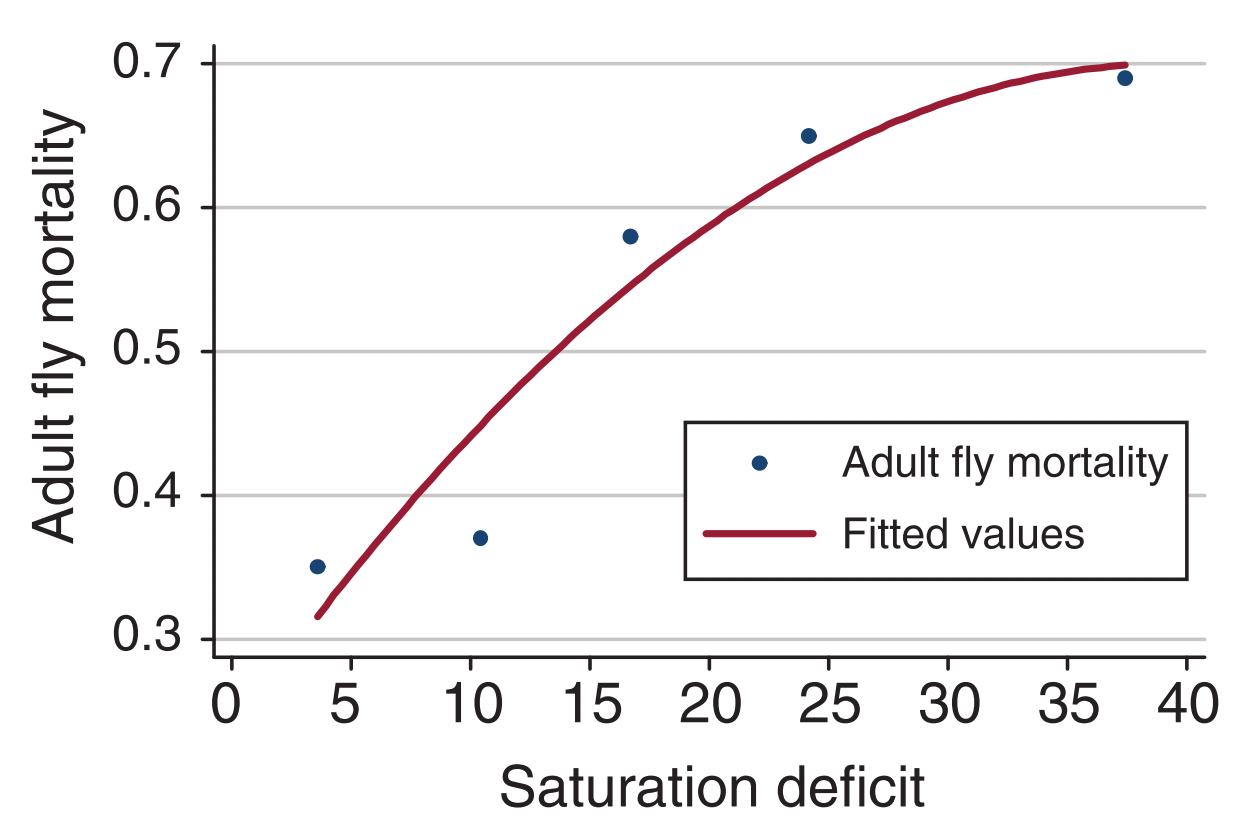
Source: Figure 2 Panel B of Alsan (2015)
Temperature & humidity
in 1871
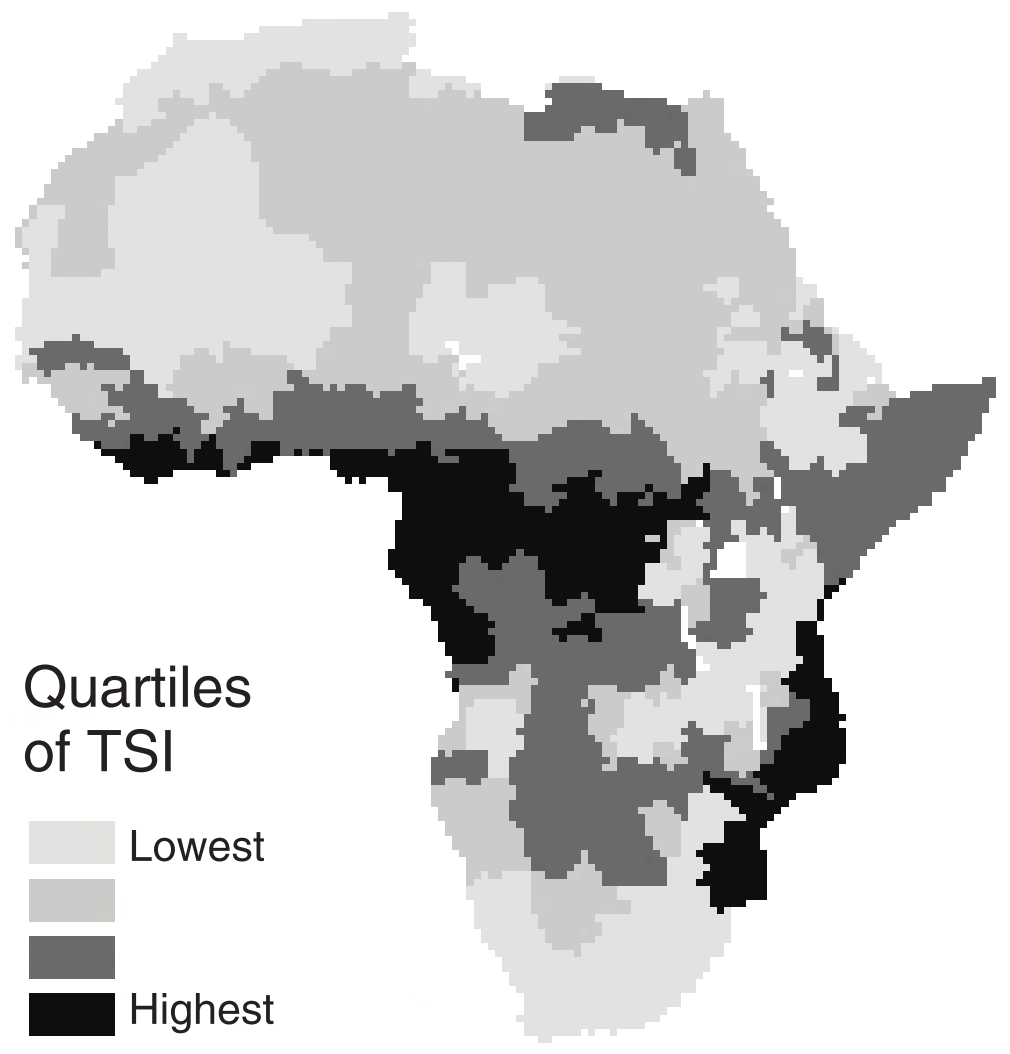
Tsetse suitability index
Source: Figure 3 Panel A of Alsan (2015) and Wikipedia
Historical data on Africa: Ethnographic Atlas
Source: Figure 5 Panel A of Alsan (2015)
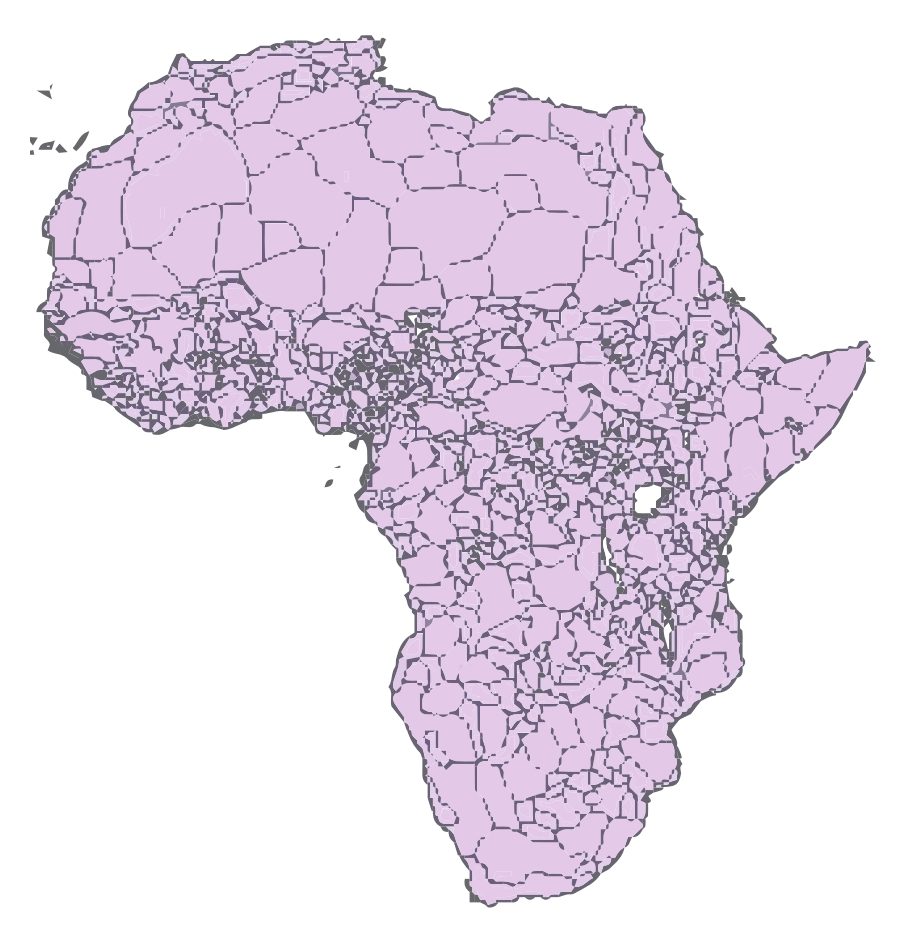
Spatially match these two datasets
Tsetse Suitability Index
Ethnographic Atlas
The more suitable for tsetse, the less developed
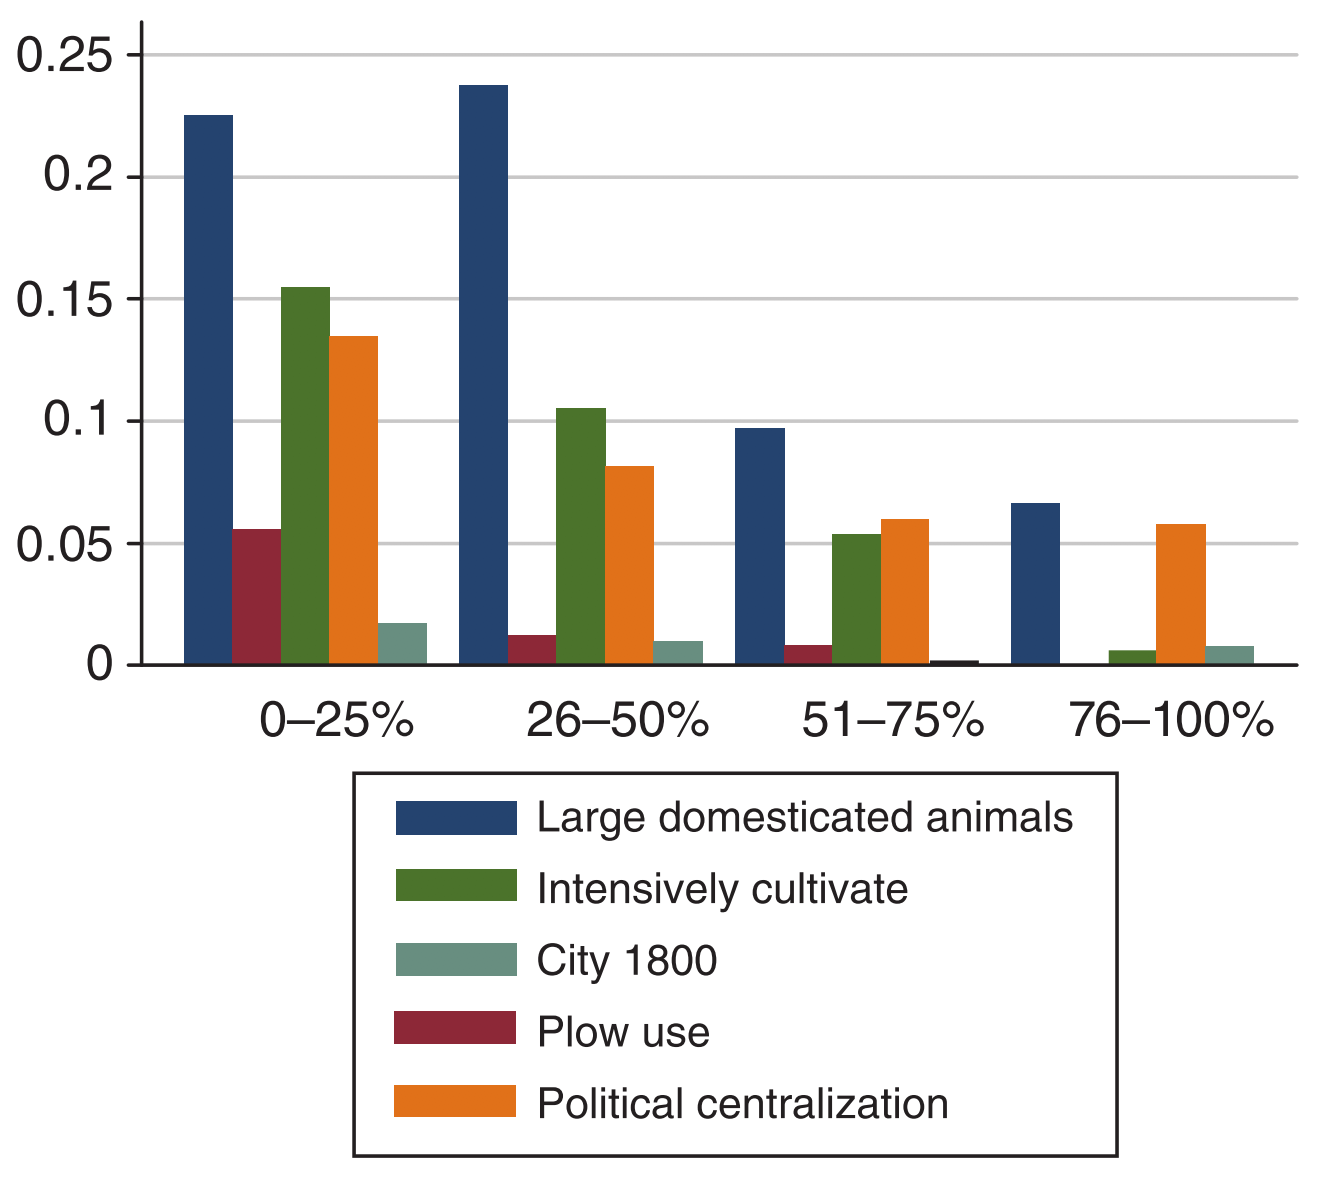
Source: Figure 4 Panel A of Alsan (2015)
The more suitable for tsetse, the less developed
Source: Figure 4 Panel A of Alsan (2015)
The more suitable for tsetse, the less developed
Source: Figure 4 Panel A of Alsan (2015)
The more suitable for tsetse, the less developed
Source: Figure 4 Panel A of Alsan (2015)
(Over 20,000)
The more suitable for tsetse, the less developed
Source: Figure 4 Panel A of Alsan (2015)
The more suitable for tsetse, the less developed
Source: Figure 4 Panel A of Alsan (2015)
Potential crop yields (FAO-GAEZ)
Natural science data #3
How potential crop yields are calculated
For 5 arc-minute cells across the earth
Daily average weather
temperature, precipitation, humidity, wind speed, sun exposure
Soil type, Elevation, Land gradient
For each crop (wheat, rice, potatoes, cassava, etc.)
Crop growth parameters
How sensitive to degree-days, water scarcity, etc.
at each of the four stages of crop growth
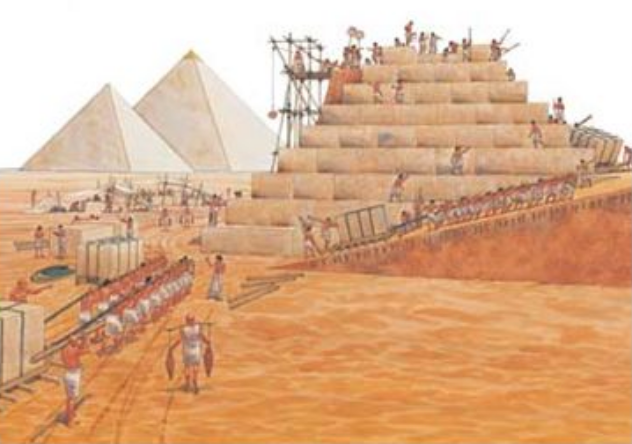
A seemingly irrelevant topic in social science:
Origin of states
Historians and anthlopologists debate
whether agriculture led to the emergence of states
A seemingly irrelevant topic in social science:
Origin of states
These four economists argue
it's appropriability of crop harvests that matters for states to emerge

Luigi
Pascali
(Pompeu Fabra)

Omer
Moav
(Warwick)

Zvika
Neeman
(Tel Aviv)

Joram
Mayshar
(Hebrew)
Lucrative
for the powerful
to collect as tax
CEREALS
Wheat, rice, maize...
Storable
Harvest within a short season
ROOTS AND TUBERS
Cassava, yam, taro, bananas...
Perishable upon harvest
Harvesting is non-seasonal
Difficult and costly
to collect as tax
States should have emerged where
cereals are relatively more productive
than roots and tubers
Measuring relative productivity of cereal crops
Convert each crop's
potential yield
into calory units
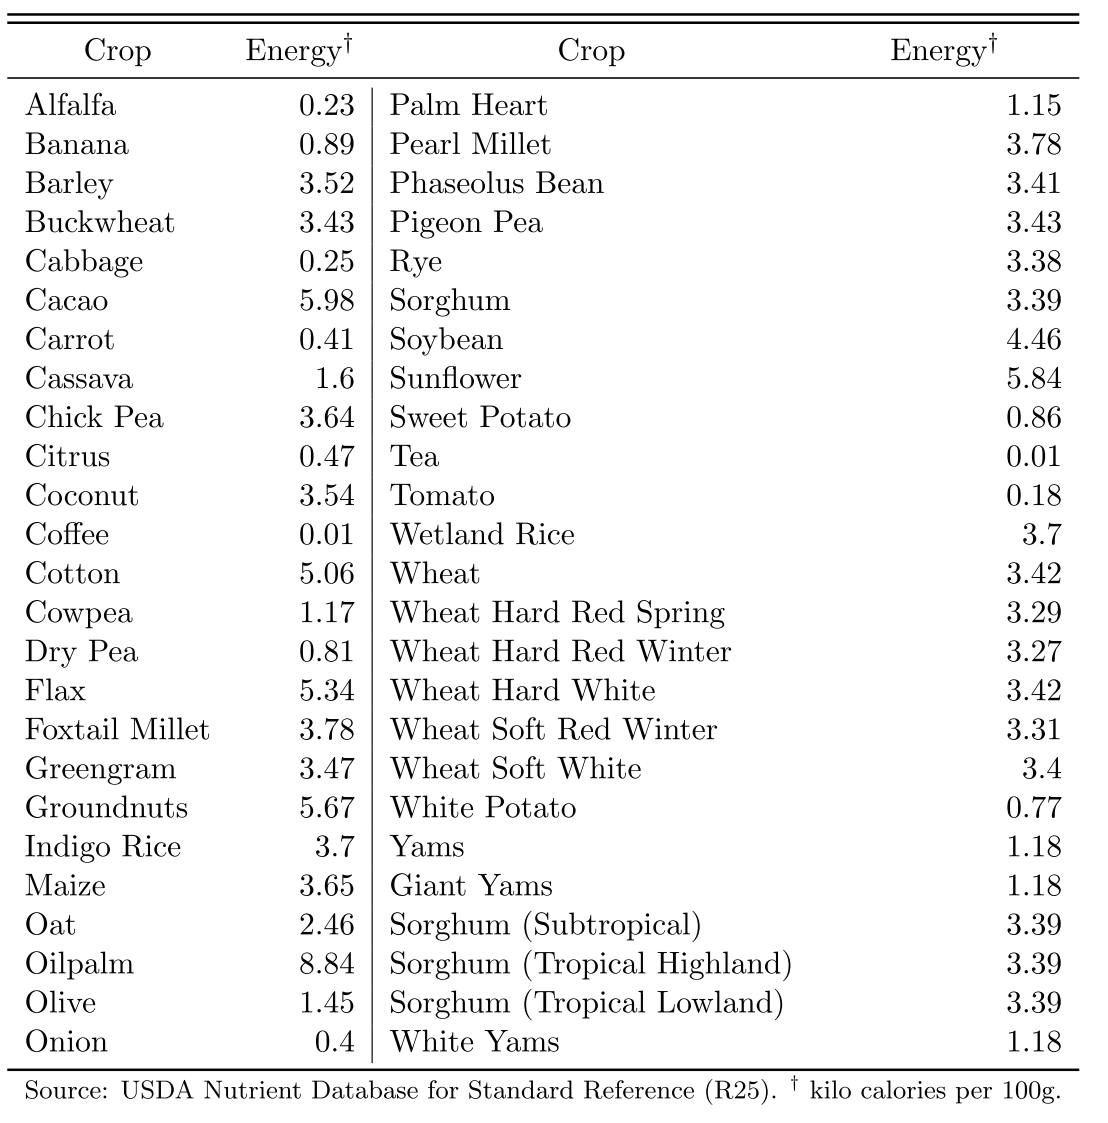
Step 1
Obtain the maximum caloric yield among cereals
Step 2
Obtain the maximum caloric yield among roots and tubers
Step 3
Step 4
Take the difference
Measuring relative productivity of cereal crops
Relative productivity of cereal crops
Source: Figure 7 of Mayshar, Moav, Neeman, & Pascali (2015)
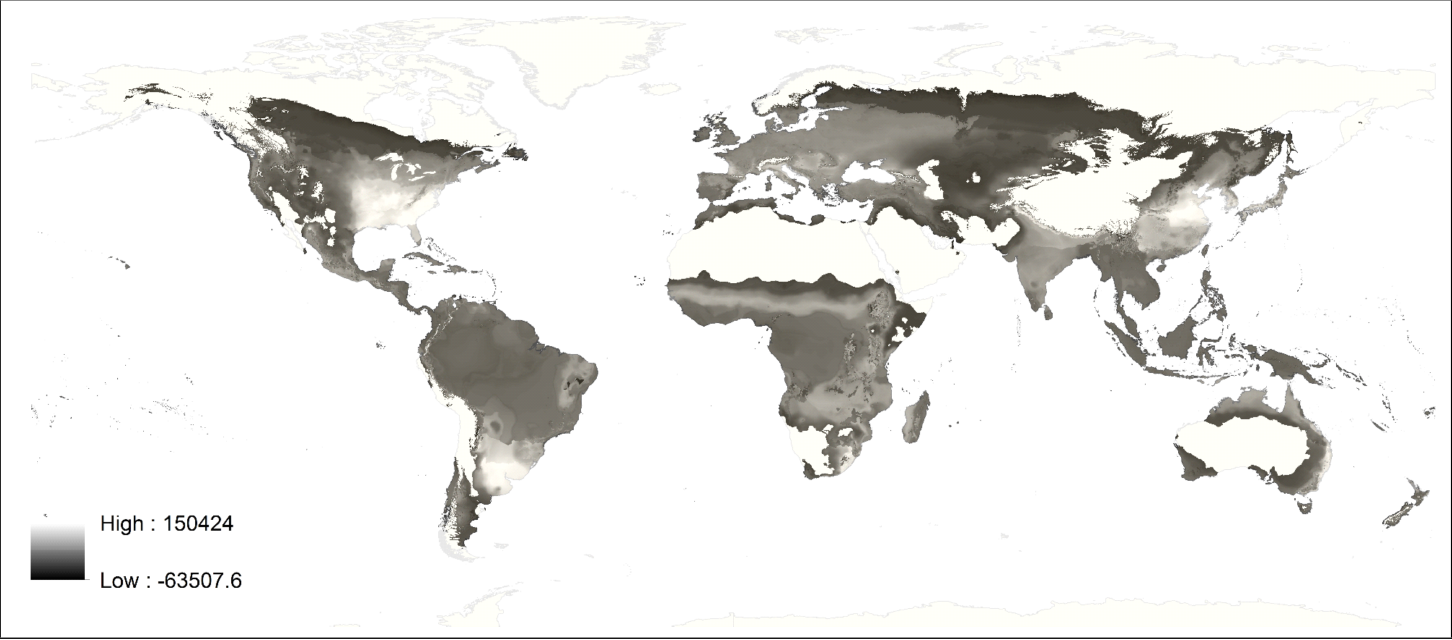
Source: Figure 4 of Mayshar, Moav, Neeman, & Pascali (2015)
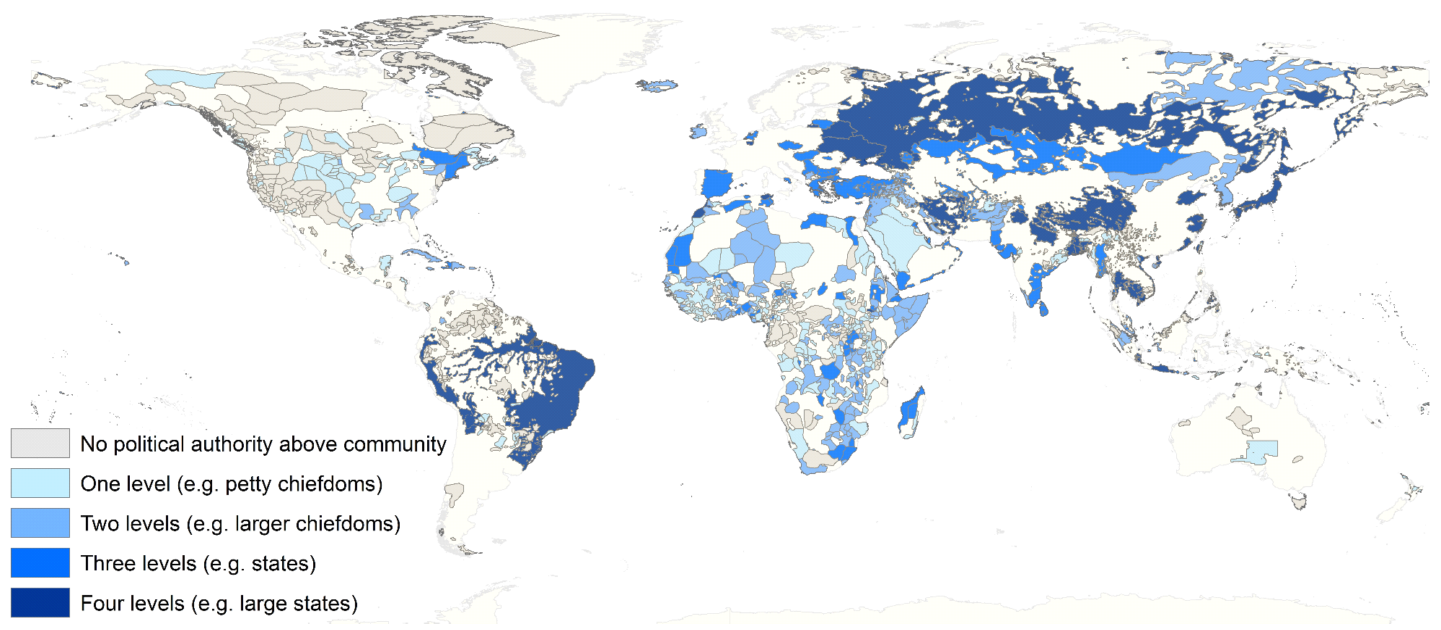
To measure the emergence of states
Use Ethnographic Atlas across the world
Statistical analysis of 952 ethnic groups reveals:
on average
# of administrative levels
1.89
2.13
Relative
productivity
of cereals
higher
by 1 s.d.
1.65
Relative
productivity
of cereals
lower
by 1 s.d.
Takeaways
Data science's most basic tool:
Ordinary Least Squares (OLS)
Image adapted from Figure 3.1 of James et al. (2013)
Y
X
Can be used for prediction and causal inference
Image adapted from Figure 3.1 of James et al. (2013)
Y
X
Need random variation in X for causal inference
Image adapted from Figure 3.1 of James et al. (2013)
X
Y
Nature offers random variation in X
Image adapted from Figure 3.1 of James et al. (2013)
X
Y
This lecture is based on the following academic articles:
Mayshar, Joram, Omer Moav, Zvika Neeman, and Luigi Pascali. 2015.
"Cereals, Appropriability and Hierarchy."
CEPR Discussion Paper, no.10742.
Alsan, Marcella. 2015.
"The Effect of the TseTse Fly on African Development."
American Economic Review, 105(1): 382–410.
Michalopoulos, Stelios. 2012.
"The Origins of Ethnolinguistic Diversity."
American Economic Review, 102(4): 1508–1539.
Tutorials on
computer programming for data science
Python
CodeCademy: Learn Python (for free)
R
DataCamp: Introduction to R (for free)
The Owen Guide (for free)
Economic Analysis of Natural Science Spatial Data
By Masayuki Kudamatsu


