Politics through the Lens of Economics
Lecture 13: Lobbying
Masayuki Kudamatsu
10 January, 2018
NRA (National Rifle Association) in U.S.

Motivation: Politically influential interest groups
Most influential in U.S. (Fortune Power 25 in 2005)
National Rifle Association (NRA)
AARP (formerly American Association of Retired Persons)
National Federation of Independent Business
American Israel Public Affairs Committee
Motivation: Politically influential interest groups
Motivation: Politically influential interest groups
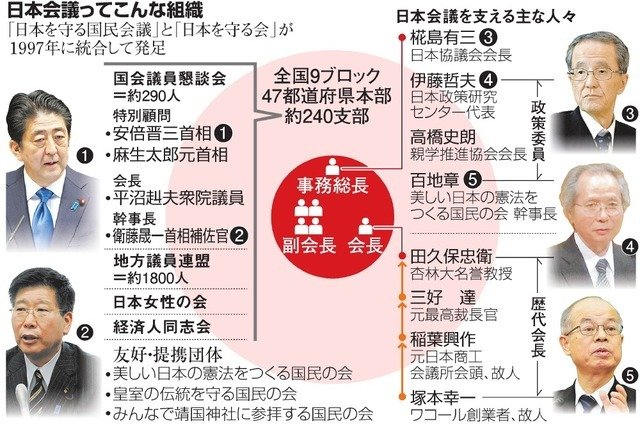
日本会議
Motivation: Politically influential interest groups
In what way
do these interest groups
influence policy-making?

Today's Road Map
Campaign contributions versus lobbyists
Return to hiring lobbyists
Connection or expertise?
Methods of influencing policy-making
Campaign contributions
Interest
Groups
Politicians
Lobbyists
Hire
?
Theories on campaign contributions
Two types of theories on how contributions affect policy-making
Buy votes in legislature
Help politicians win elections
Interest groups promise to
pay money
if a legislator votes
in their preferred way
Interest groups pay money to
their favourite candidate
so he/she can spend more
on electoral campaign
These theories were popular among economists in the 1990s.
But...
Too little money,
compared to the value of policies at stake
$590,000b
Federal govt
consumption & investment
in 2000
Campaign contributions
in national elections
in 2000
$3b
Source: Ansolabehere et al. (2003), p. 110
Too little money,
compared to the value of policies at stake
$134,000,000,000
Defense
procurement contracts
in 2000
Campaign contributions
by defense industry
in 2000
$13,200,000
Source: Ansolabehere et al. (2003), p. 110
Too little money,
compared to the value of policies at stake
$1,000,000,000
Price supports
for diary products
in 2002
Campaign contributions
by diary producers
in 2000
$1,300,000
Source: Ansolabehere et al. (2003), pp. 110-111
Contributions don't change how legislators vote
Chamber of Commerce, an interest group, calculates
% of times each member of Congress votes with the group
for bills relevant for the group, from 1978 to 1994
For a given legislator, this percentage does not change much
in response to more/less campaign contributions from corporations
Source: Table 2 of Ansolabehere et al. (2003)
So what are campaign contributions for?
Consumption, like a lottery ticket
Access fee to politicians
They'll listen to you, by paying money
But they won't necessarily support your policy
We do not know more than this
Lobbying industry
In the past decade or so
economists (and political scientists) focus more on lobbying industry
partly because the data has become available
Data on the U.S. lobbying industry
Lobbying Disclosure Act of 1995
requires all lobbyists to report (twice a year):
Their names and previous positions in govt
Clients' names and industries
Revenue received from each client
List of bills they lobby for/against
Data can be downloaded at Senate Office of Public Records (SOPR)
Center for Responsive Politics summarises the data
Data on the U.S. lobbying industry (cont.)
Collection of biographies of lobbyists
compiled by Columbia Books and Information Services
Of which about 17,000 can be matched in www.lobbyists.info
About 37,000 lobbyists for 1999-2008 in the SOPR data
Source: Bertrand et al. (2014), p. 3889
Money involved in U.S. in 2012
Campaign contributions
Interest
Groups
Politicians
Lobbyists
Hire
?
$750,000,000
$3,500,000,000
Source: de Figueiredo and Richter (2014), p. 165
What do lobbyists do?
Advise Congress committee members on bill proposals
Give access to politicians they know
Help politicians draft bills
Today's Road Map
Campaign contributions versus lobbyists
Return to hiring lobbyists
Connection or expertise?
Measurement
We need the following three pieces of data
Enactment of a policy
Lobbying expenditure by each lobbying firm
Policies each lobbying firm lobbies for/against
Measuring the enactment of a policy
Collect all the bills on the energy sector
introduced during the 110th Congress
(2007-2008: last 2 years of George W Bush's 2nd-term presidency)
Including those the committees didn't submit to the floor
Divide a bill into sections
One bill may deal with several policies
A bill section deals with one specific policy
Measuring the enactment of a policy (cont.)
Obtain word frequencies of each bill section
Image source: khorn2.onmason.com/author/khorn2/
Measuring the enactment of a policy (cont.)
Treating word frequencies as a vector,
measure the angle between a pair of bill sections
Image source: www.mathsisfun.com/algebra/vectors-dot-product.html
Measuring the enactment of a policy (cont.)
\cos \theta = 1
if relative frequencies of all words are the same
\cos \theta = 0
if not a single word is used in common
Treat bill sections as the same policy if
\cos\theta \geq 0.985

Then look at the status of the last bill
among all bill sections dealing with one policy
Measuring the enactment of a policy (cont.)
Bills are typically amended throughout Congress session
| Status | # of policies | % of policies |
|---|---|---|
| Enacted | 45 | 8.4% |
| Reported | 106 | 19.7% |
| Not reported | 387 | 71.9% |
Source: Table 1 of Kang (2016)
Measuring lobbying expenditure
The lobbying industry data identify
559 firms and associations in the energy sector
Total lobbying expenditure: $607.9m
Median lobbying expenditure: $0.16m
Top 10% accounts for 76% of total expenditure
Source: Kang (2016), page 273
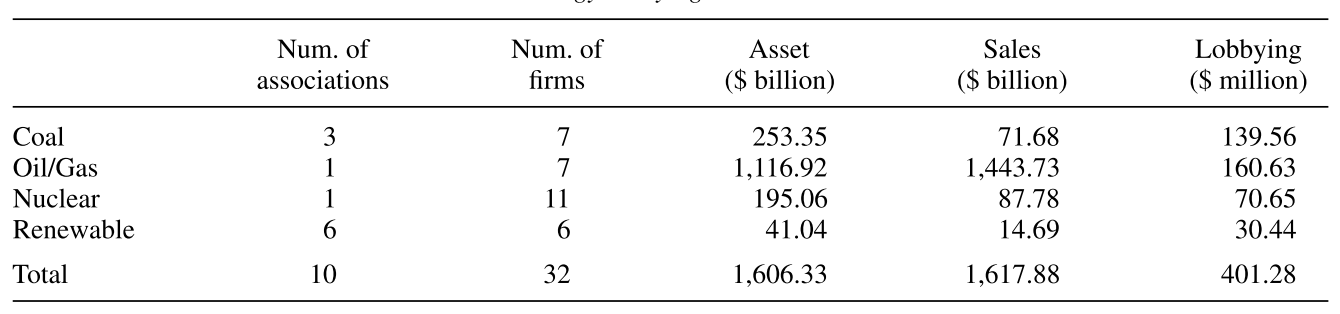
Measuring lobbying expenditure (cont.)
Source: Table 2 of Kang (2016)
Group these lobbying firms into four sub-sectors
Coal
Oil/Natural Gas
Nuclear
Renewable energy
Measuring which policy was lobbied
Assume a coalition lobbies for/against all policies within a bill mentioned in the dataset
% of policies each lobbying coalition participates in lobbying
| Coal | 50% |
| Oil / Natural Gas | 67% |
| Nuclear | 49% |
| Renewable | 62% |
Source: Table 3 of Kang (2016)
How to obtain return to lobbying expenditure
Policy value
x
Enactment probability increase
-
Lobbying expense
Lobbying expense
Calculate
(Profit)
(Investment)
But we don't observe policy value or enactment probability
We use a model
1
Each coalition decides how much to spend on lobbying in favour of / against each policy
\frac{\pi + \alpha S_f}{1+\alpha S_f + \beta S_a}
Let
denote the sum of spendings
by those in favour of / against the policy
S_f
S_a
and
Model (a simplified version)
2
The policy is enacted with probability:
\frac{\pi + \alpha S_f}{1+\alpha S_f + \beta S_a}
Policy enactment probability
if no lobbying spendings on either side
even if only those in favour lobby
=\pi
\neq 1
The more spending, the less change in probability
Extra benefit from additional spending
spending
Extra benefit
Policy enactment probability
doesn't go up much
if you have spent a lot
Extra benefit from additional spending
spending
Extra benefit
Extra benefit goes up
if the value of a policy is higher
Optimization
spending ($)
Extra benefit
$1
More valuable policy
Less valuable policy
Spend more
for more valuable policy
Estimate policy enactment probabilities
Calculate
\frac{\pi + \alpha S_f}{1+\alpha S_f + \beta S_a}
for a certain values of
\alpha, \beta, \pi
Obtain the average for enacted policies and not-enacted policies
Repeat this for all possible values of
(roughly speaking)
\alpha, \beta, \pi
Pick
\alpha, \beta, \pi
that maximizes
See how higher the average for enacted policies is ( )
Estimated increase in enactment probability
only 0.054 percentage points
higher than in the absence of any lobbying
Source: page 287 of Kang (2016)
Estimated average value of policies
| Coal | $802.3m |
| Oil & Gas | $823.5m |
| Nuclear | $522.1m |
| Renewable | $549.0m |
Source: Table 13 of Kang (2016)
Return to lobbying expense
Policy value
x
Enactment probability increase
-
Lobbying expense
Lobbying expense
Calculate
(Profit)
(Investment)
Estimated return to lobbying expense
| Coal | 145.8% |
| Oil & Gas | 151.9% |
| Nuclear | 139.2% |
| Renewable | 137.0% |
Source: Table 13 of Kang (2016)
Today's Road Map
Campaign contributions versus lobbyists
Return to hiring lobbyists
Connection or expertise?
Where does the value of lobbyists come from?
Lobbyists are valuable potentially for two reasons
They help clients to contact politicians they used to work with
Their working experience help clients to deal with the inner workings of legislative process or policy matters
Connections
Expertise
Testing the
Connection hypothesis
Revolving Door Phenomenon in U.S.
Federal public employees often join the lobbying industry
56% of revenues by lobbying firms attribute to them
34 of top 50 lobbyists worked in the federal govt
cf. In US, 4,000+ top positions in federal government are appointed by President (1,000 of which requires the approval by the Senate)
Source: Table 1 of Blanes i Vidal et al. (2012)
Measuring lobbyists' connection
Identify lobbyists who used to work for congressmen
US congressmen can hire staffers with public money
Representatives / Senators hire 14 / 34 staffers on average
cf. MPs in Japan can hire only 3 staffers with public money
Estimate the value of connections
Check if the revenue is higher for those lobbyists with connections than for those without
Lobbyist's revenue = Value of their service to clients
Naive idea
Estimate the value of connections (cont.)
But skilful lobbyists may have more connections
Skill
Connection
Revenue
Compare the biannual revenue of lobbyists
before and after their connected legislators leave office
Lobbyists' skill change
over time
Better idea
Their connected legislators'
decision to quit
unlikely
Estimate the value of connections (cont.)
Estimate the value of connections (cont.)
But macroeconomy may still affect both
Macroeconomy
Legislator leaving office
Revenue
Even better idea
Difference-in-differences (cf. Lecture 11)
| Before legislator quits | After legislator quits | |
| Connected lobbyist | A | B |
| Unconnected lobbyist | C | D |
Value of connections
= (A - B) - (C - D)
Estimate the value of connections (cont.)
Estimated value of connections to Senator
Source: Table 2 and page 3741 of Blanes i Vidal et al. (2012)
24% of the revenue of unconnected lobbyists
$372,000 per year on average
Testing the
Expertise hypothesis
Measuring lobbyists' expertise
From the lobbying industry data:
Obtain the share of revenues each lobbyist earns by policy issue
1/4 of lobbyists are specialists, defined this way
Those with political experiences are less likely to be specialists
If this share is 25% or more, we call this lobbyist a specialist
Source: Bertrand et al. (2014), pp. 3897-3900
Models of lobbying as information transmission
Two lobbyists with opposing ideology bias
They know what policy benefits society
Which may be against their ideology
The policy-maker does not know which policy is good
Lobbyists inform the policy-maker of which policy is good
They can tell a lie
Main prediction from these models
Policy-makers will learn the truth
when both lobbyists inform the policy-maker
If they tell different stories,
the policy-maker has an incentive to verify
This in turn gives an incentive for lobbyists to tell the truth
Main prediction from these models (cont.)
If lobbyists offer their expertise,
we should observe politicians listen to lobbyists from both camps
Evidence for the expertise view
For each congressman
identify which lobbyists they receive contributions from
This share should be higher for specialist lobbyists
if their expertise does matter
Obtain the share of such lobbyists from the other party
Separately for specialists and non-specialists
Evidence for the expertise view (cont.)
Share of lobbyists from the other party
Among non-specialists
Among specialists
28%
17%
Source: Table 7 of Bertrand et al. (2014)
Summary
Campaign contributions do not seem to affect policy-making per se
Lobbying does not change the enactment probability much
but the value of policies at stake is very large
so the return to lobbying expenditure is over 100%
The role of lobbyists appears to be both
1. Introducing connected politicians to their clients
2. Helping politicians with their expertise on policy issues
Next week...
Wars
Does poverty intensify civil wars?
What makes a war unavoidable?
This lecture is based on the following academic articles:
Kang, Karam. 2016. “Policy Influence and Private Returns from Lobbying in the Energy Sector.” The Review of Economic Studies 83(1): 269–305.
Bertrand, Marianne, Matilde Bombardini, and Francesco Trebbi. 2014. “Is It Whom You Know or What You Know? An Empirical Assessment of the Lobbying Process.” American Economic Review 104(12): 3885–3920.
Blanes i Vidal, Jordi, Mirko Draca, and Christian Fons-Rosen. 2012. “Revolving Door Lobbyists.” American Economic Review 102(7): 3731–48.
Ansolabehere, Stephen, John M De Figueiredo, and James M Snyder. 2003. “Why Is There so Little Money in U.S. Politics?” Journal of Economic Perspectives 17(1): 105–30.
Politics through the Lens of Economics (2017): Lecture 13 Lobbying
By Masayuki Kudamatsu


