HOW TO USE DATA AND A/B TESTING TO IMPROVE YOUR BUSINESS
@KYLERUSH
KYLERUSH.NET
Head of Optimization, Optimizely
Context
$1 billion expected
$1.1 billion actual
$690 million online
QUICK DONATE
$115 million
1.5 million users
500 experiments
weeks of user testing
668,720,213 GA events
results
+49% DONATE PAGE
+161% EMAIL sign up
optimization
experimentation
observation
data gathering
experimentation
1. identify goals
Top of the funnel vs. bottom of the funnel
2. hypothesis
3. sample size
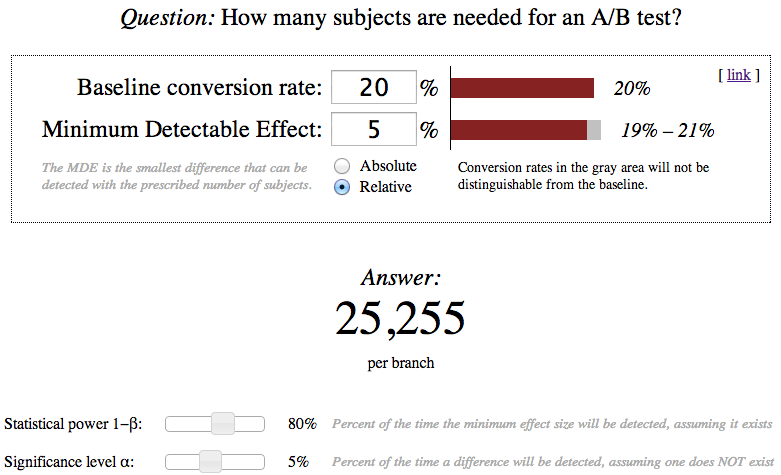
http://www.evanmiller.org/ab-testing/sample-size.html
sample size best practices:
Use 5% significance (95% confidence level)
use 80%+ statistical power
More on sample size:
kylerush.net
4. Prioritize with ROI
5. QA THE EXPERIMENT
5. test
6. record results
7. consider a retest
first test
control variation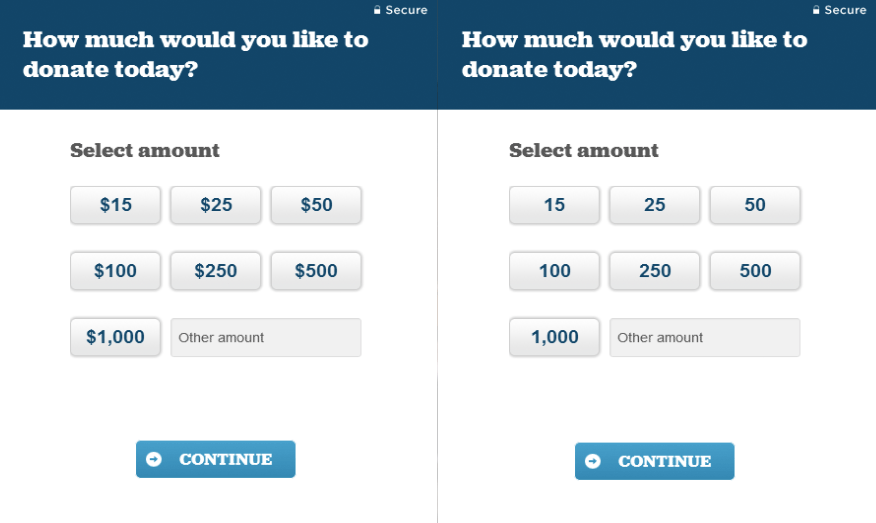
+ 36% revenue
second TEST
control variation
statistical tie
Third TEST
control variation
statistical tie
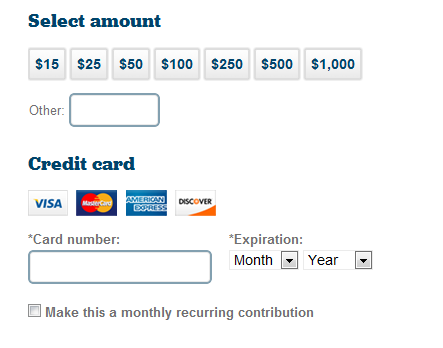
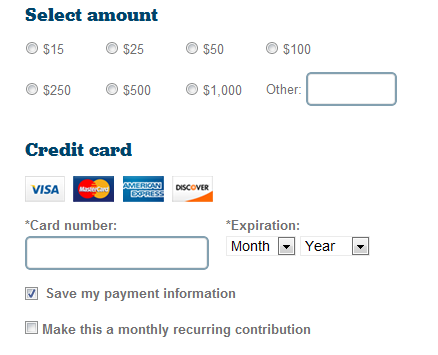
copy
control
variation
more direct copy resulted in:
+21% conversions
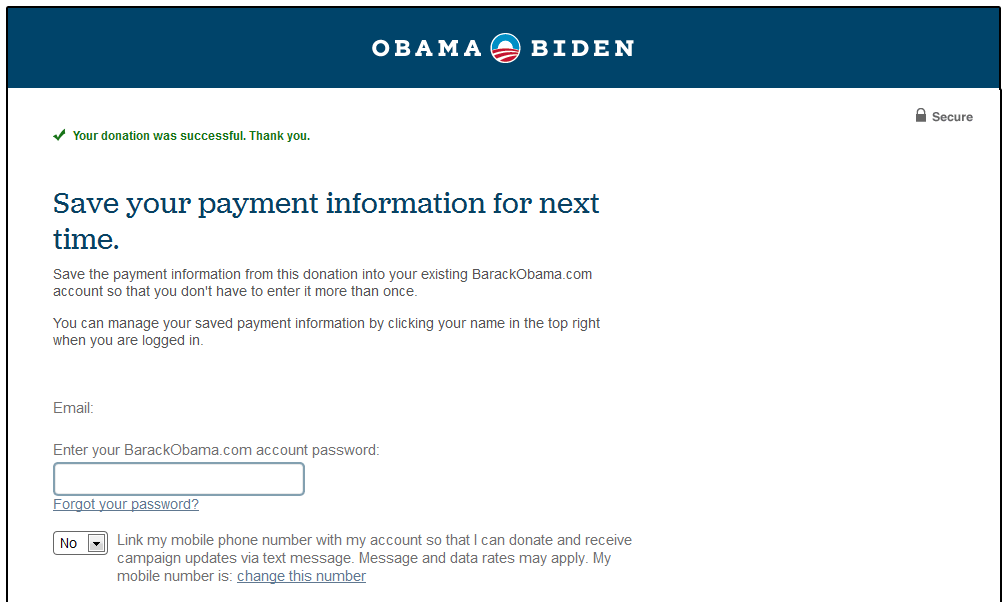
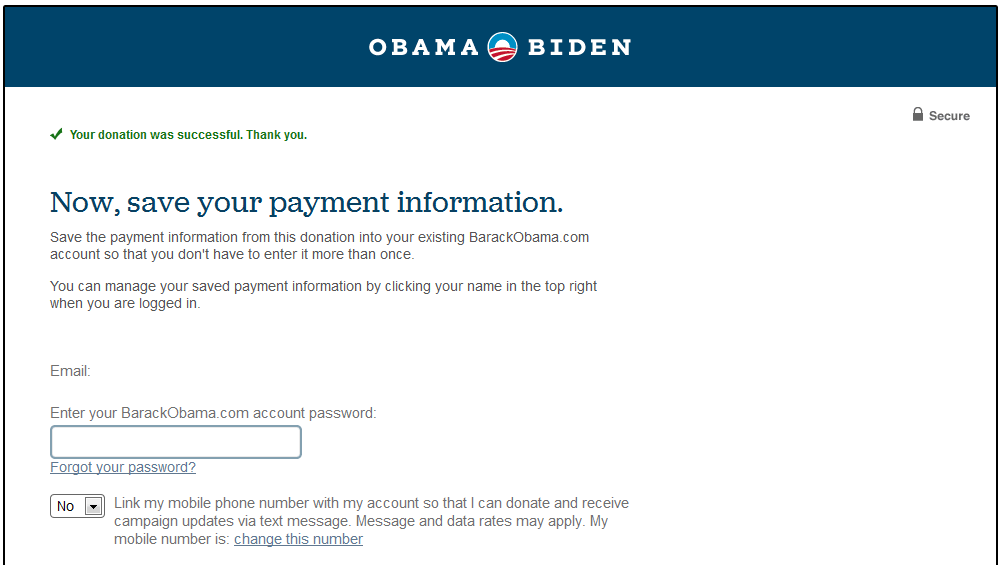
SAVE YOUR PAYMENT INFO FOR NEXT TIME
VS.
NOW, SAVE YOUR PAYMENT INFO
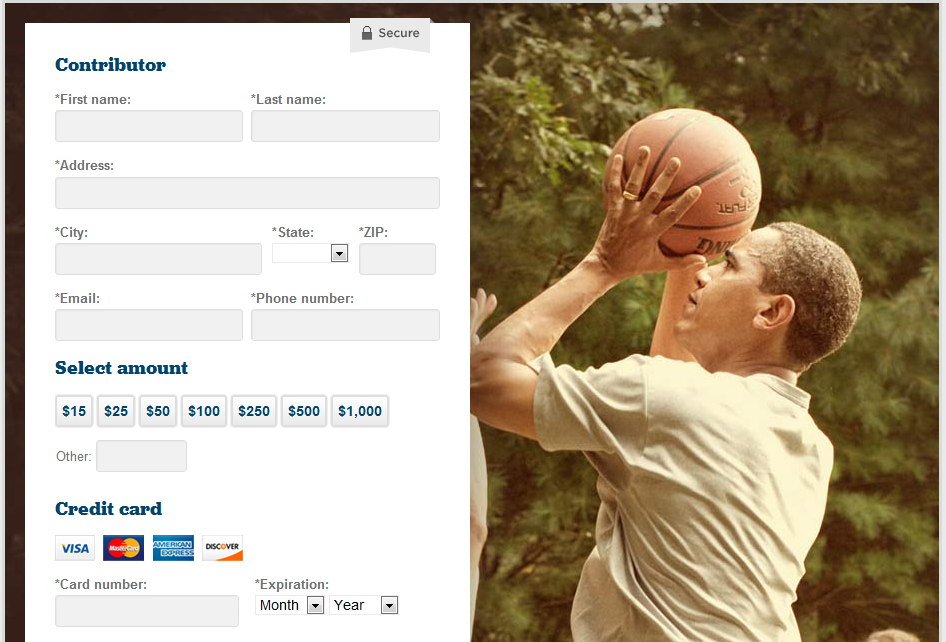
imagery
control
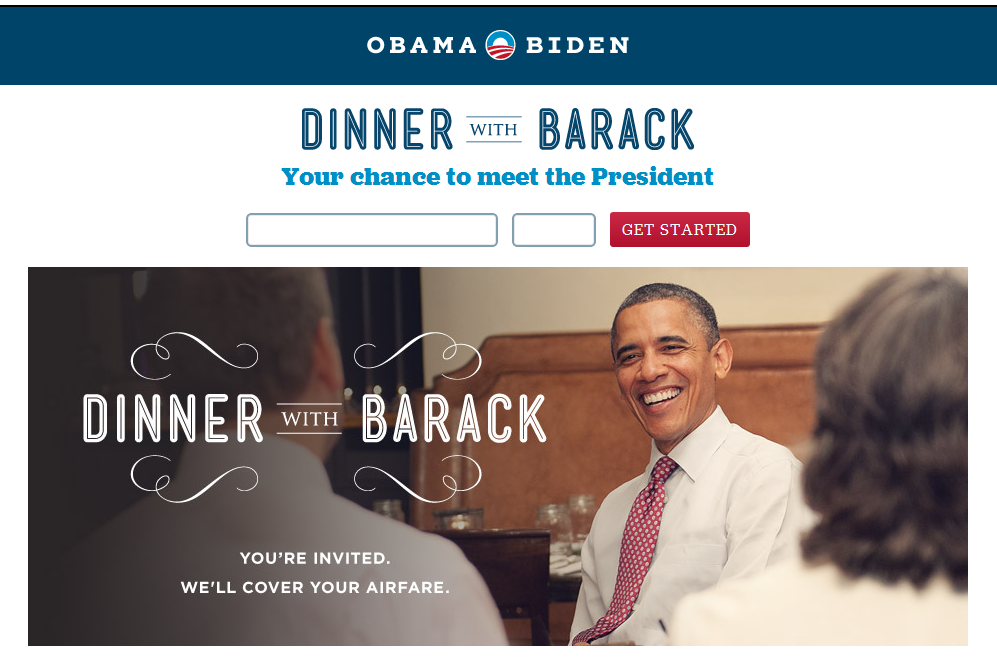
variation

More situational imagery resulted in:
+19% conversions


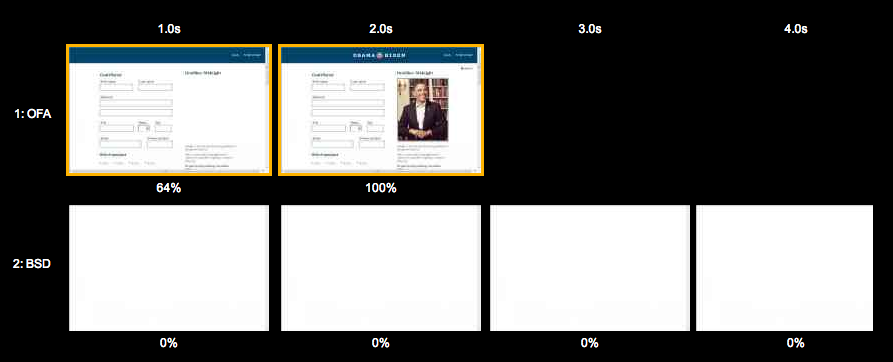
performance
what we started with
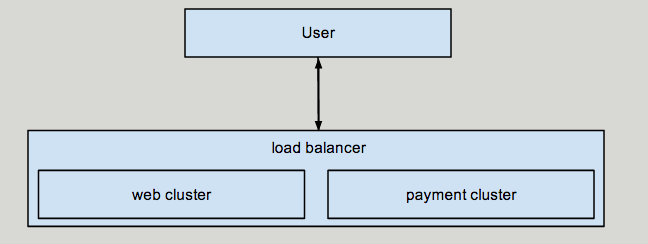
5-7 second load time
No CDN
No caching
What we engineered
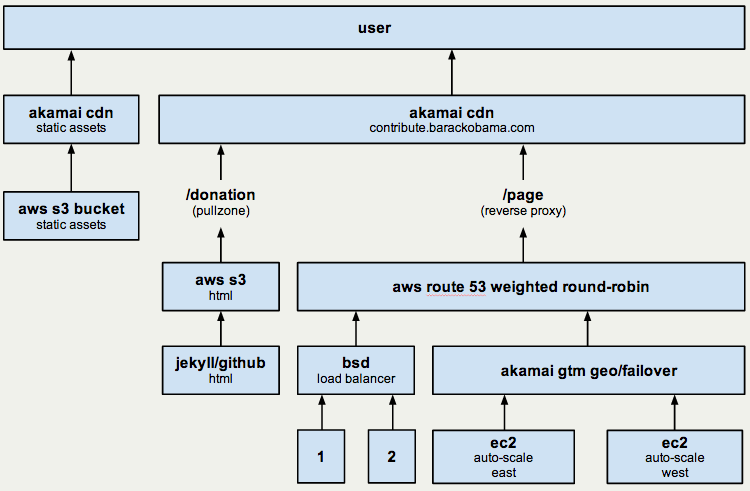
80% faster time-to-paint
63% reduction in page weight
52% reduction in requests
80% faster resulted in:
+14% conversions
OR
$32 million
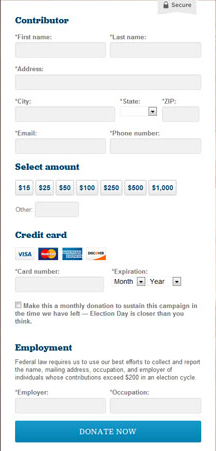
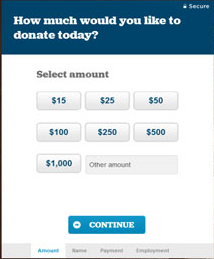
user experience
control
variation
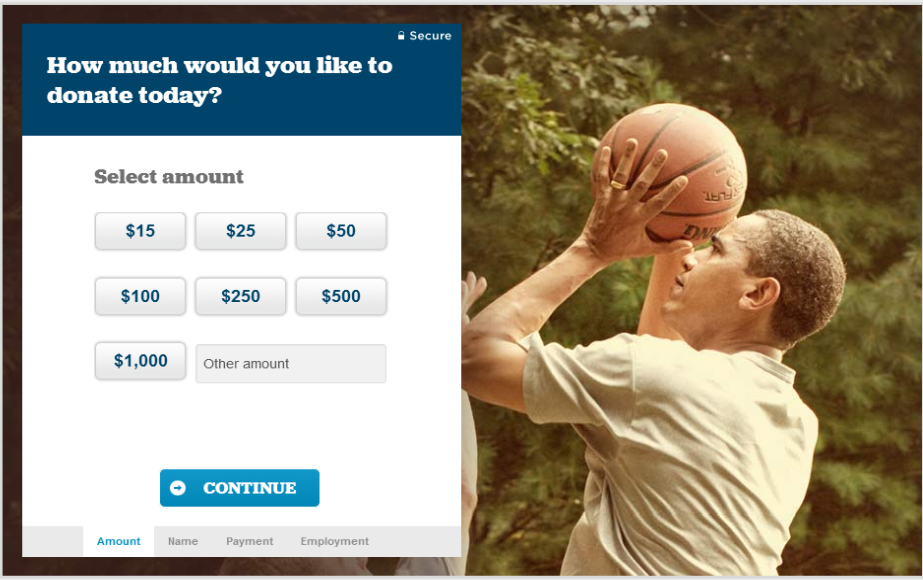
Gradual incline instead of steep slope resulted in:
+5% conversion
on an already optimized paged
experimentation
best practices
1. Start simple
2. always have
a test running
3. don't be afraid
to fail
control variation
placing the up-sell on the conversion page instead of after resulted in:
-44% conversions
data gathering
668,720,213
Google analytics custom events
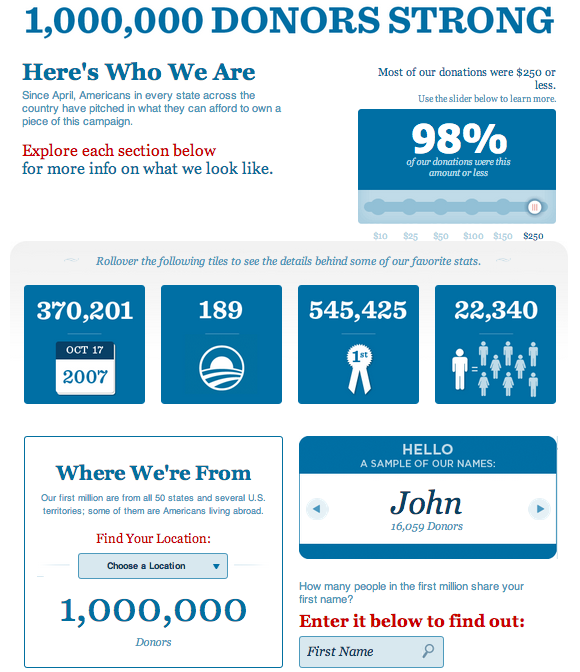
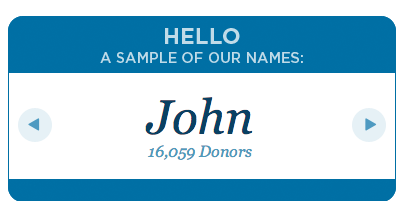
Right: 82% of clicks
_gaq.push(['_trackEvent', 'one million infographic', 'name slides right']);
User testing
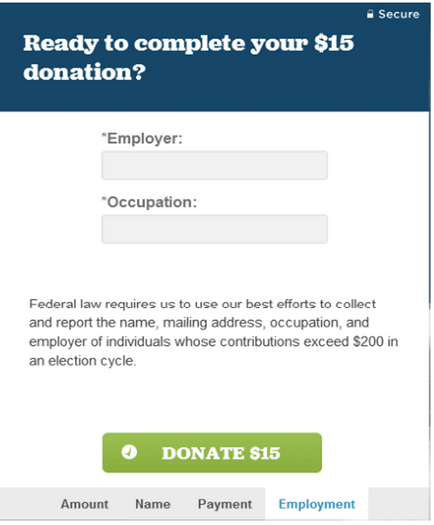
Control variation
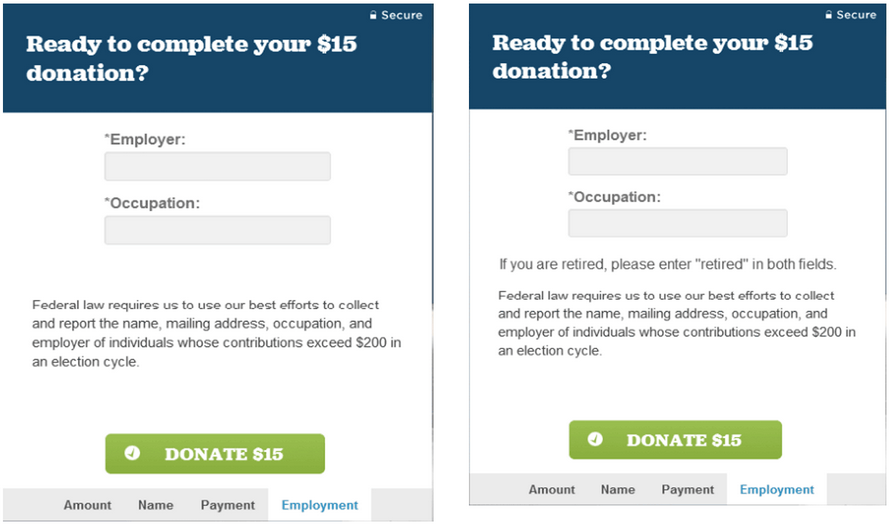
adding field hints resulted in:
63% error reduction
How to use data and a/b testing to improve your business
@KYLERUSH
kylerush.net
Head of Optimization, Optimizely
How to use data and a/b testing to improve your business
By Kyle Rush