Data Summit Brussels

Programme
Wifi: Hotel Brussels Airport
#DSBXL17
Maarten Lambrechts
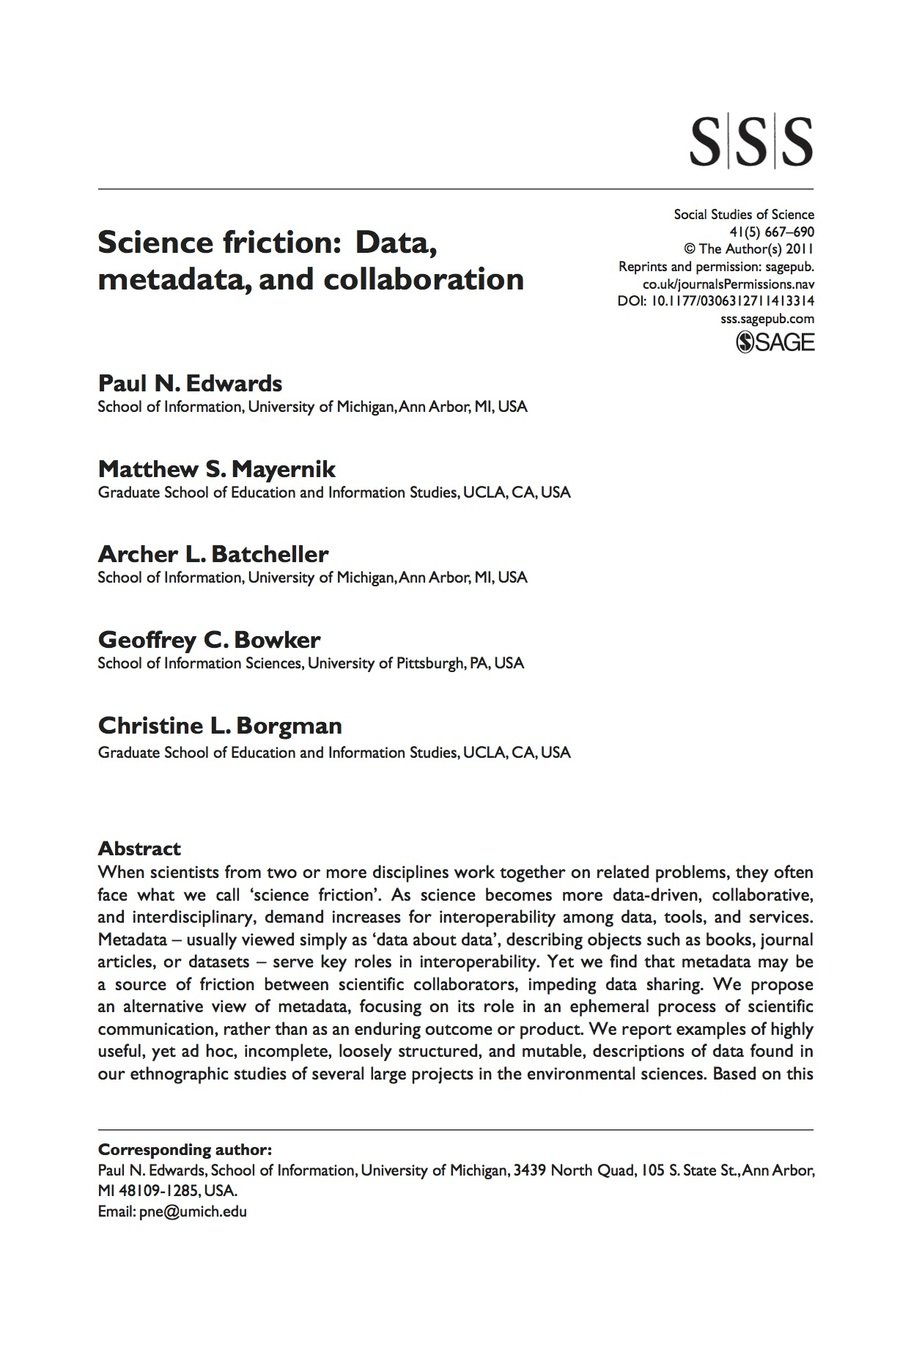
Data science friction
SAI Data Summit
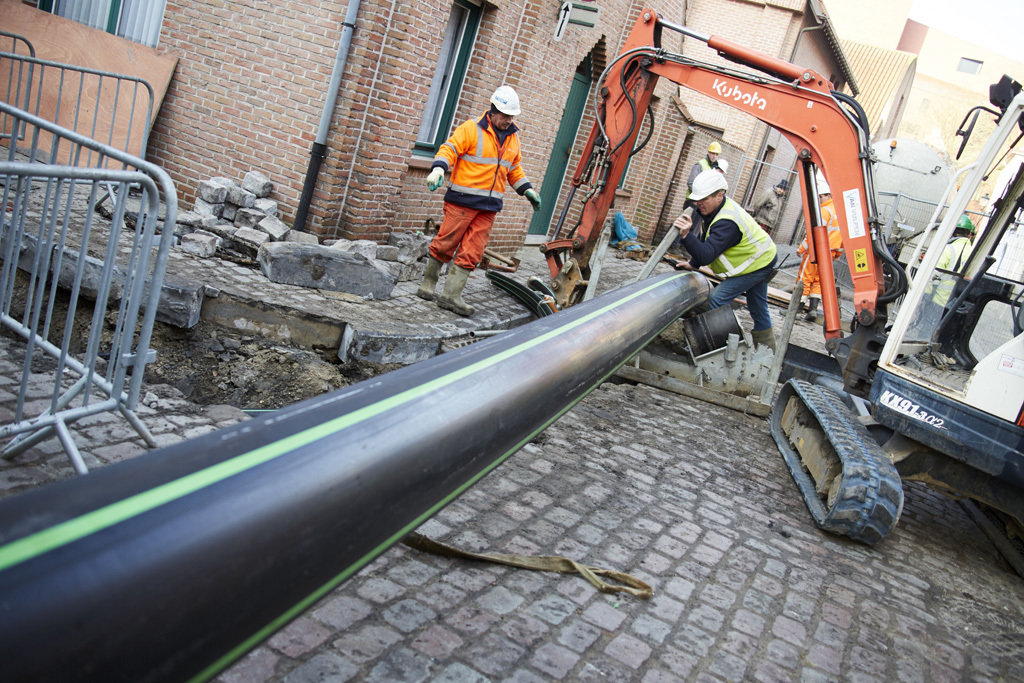
How to smooth your pipeline
19 October 2017
@maartenzam


We
Machine
Interface
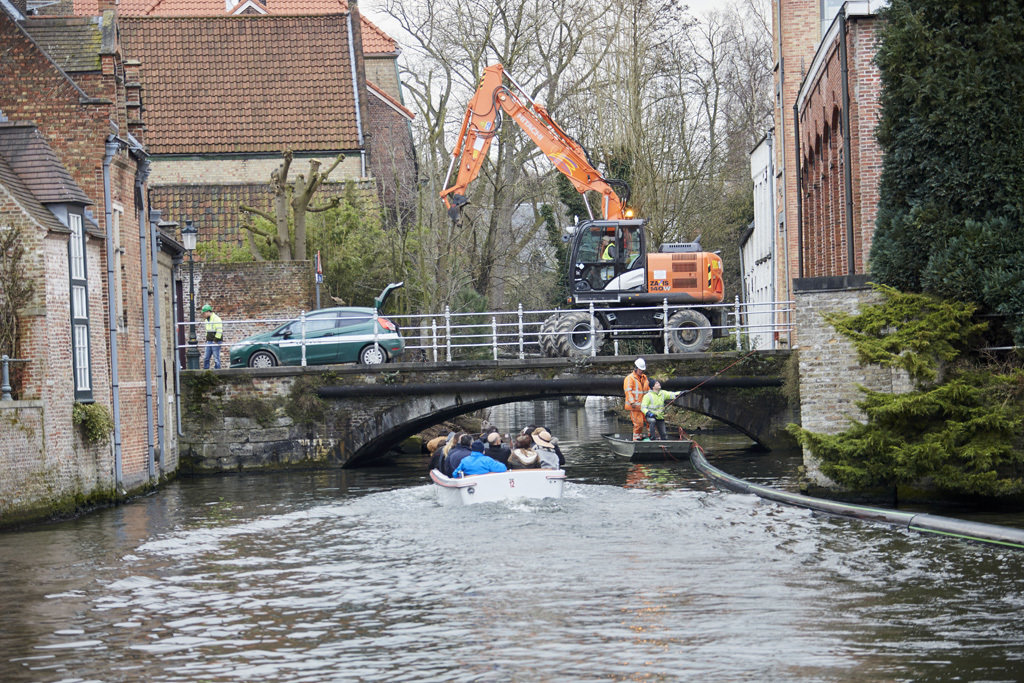
At every interface between 2 surfaces, friction consumes energy, produces heat and wears down moving parts.

Data friction is what happens between 'data surfaces': where data moves between people, substrates, organisations or machines. From one lab to another, from one discipline to another, from a sensor to a computer, or from one data format to another.
Every movement of data across an interface comes at a cost of time, energy and human attention.

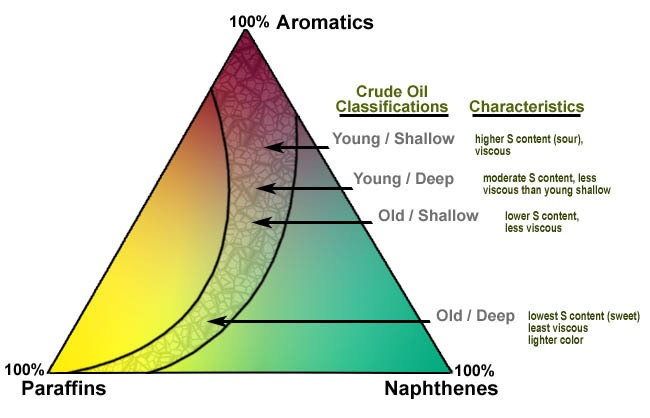
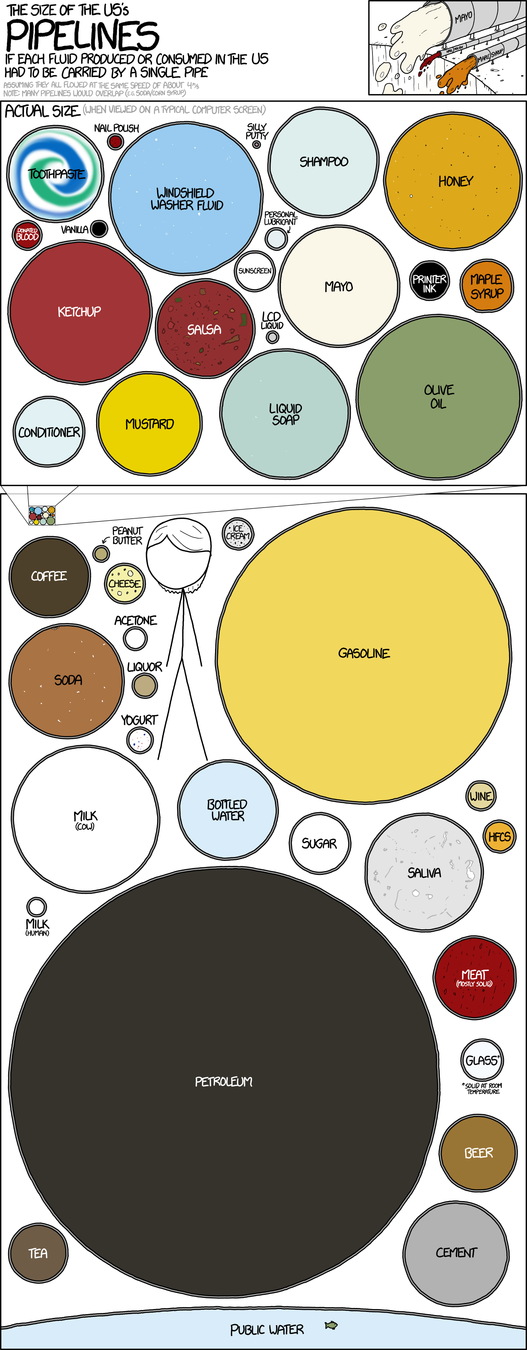
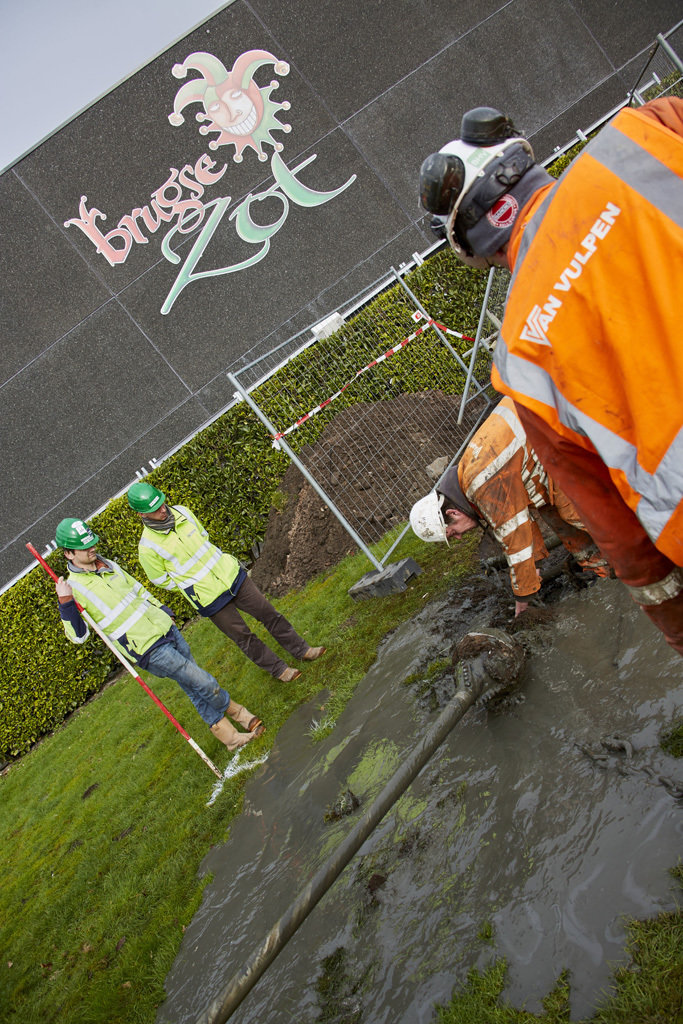
Know what goes into your pipeline
Go out in the field
Metadata
Documentation


Why build a pipeline in the first place?
1. Speed and time saving

- Speed and time saving
- Humans out of the loop: less errors, independent of individuals
- Better understanding: all the data processing jobs explicitly written down
- Debugging
Single tool pipeline?
👏👏👏
Data connectors
API's
Export & import
Multitool pipeline
Develop
Maintain

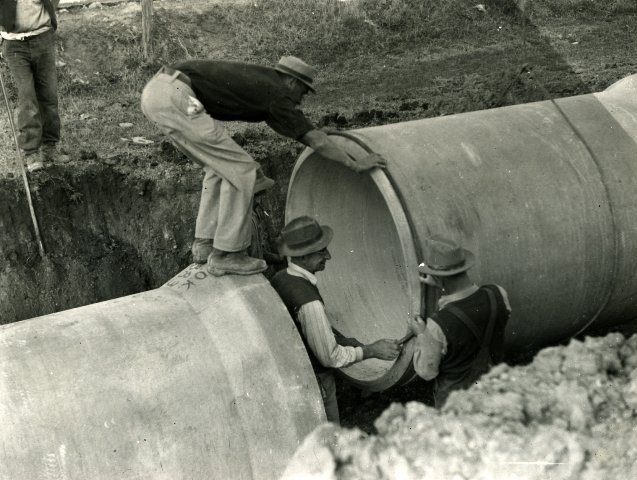
What should be the next piece of tube in your pipeline?
Some tools will help you

Know the jargon

Time = €
Get's you out of the flow

Coding friction
compiling
building
reloading
calling servers
No immediate feedback


Analysis
Slicing and dicing
Adjust parameters
Views and visualizations
Modelling and predictive analytics

Go the last mile
Building the pipe is not the goal,
providing insights and making informed decisions is
Communicate what you found
(and how you found it)

Consider the user!
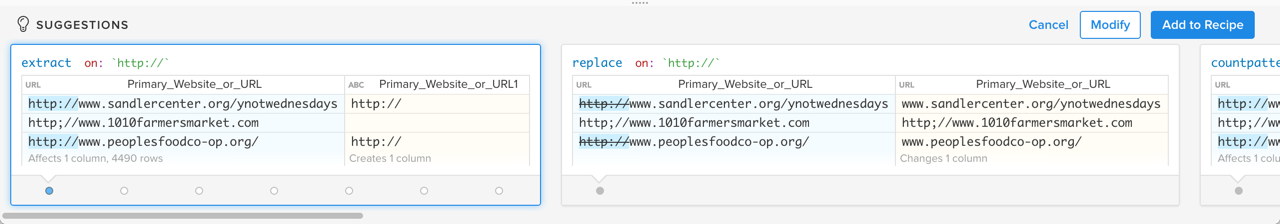
Use the right tools & techniques
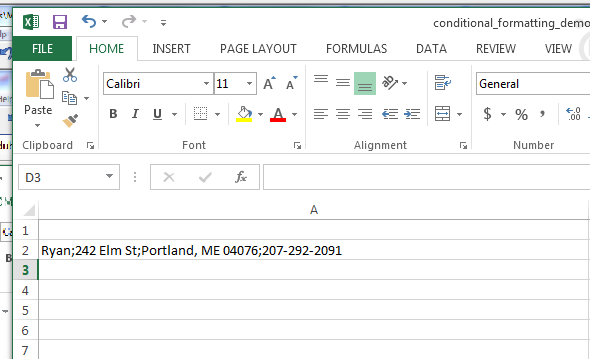
=LEFT((RIGHT((RIGHT(A2,LEN(A2)-FIND(“;”,A2))),LEN((RIGHT(A2,LEN(A2)-FIND(“;”,A2))))-FIND(“;”,(RIGHT(A2,LEN(A2)-FIND(“;”,A2)))))),FIND(“;”,(RIGHT((RIGHT(A2,LEN(A2)-FIND(“;”,A2))),LEN((RIGHT(A2,LEN(A2)-FIND(“;”,A2))))-FIND(“;”,(RIGHT(A2,LEN(A2)-FIND(“;”,A2)))))),1)-1)

Learning a new tool = friction
Know what goes into your pipe
Pipes save time & decrease errors, but consider ROI
Tool interfaces can be painful
Tools can help to build a pipe, but you need to know the jargon
Avoid latency, get immediate feedback when developing a pipe
Iterate quickly in analysis
Go the laste mile, consider the user
Use the right tools and techniques
Consider the ROI on learning a new tool
Smooth data pipelines
Programme
Friction in the data pipeline
By maartenzam


