overpass turbo
OpenStreetMap data mining made easy
“How do I get my data back?”
until now
planet.osm / extracts
:(
:)
Overpass API
“The Overpass API […] serves up custom selected parts of the OSM map data. It acts as a database over the web: the client sends a query to the API and gets back the data set that corresponds to the query.”
raw data
<?xml version="1.0" encoding="UTF-8"?>
<osm version="0.6" generator="Overpass API">
<note>The data included in this document is from www.openstreetmap.org. The data is made available under ODbL.</note>
<meta osm_base="2013-06-10T16:24:05Z"/>

  <node id="336133372" lat="46.6296301" lon="10.4486610">
    <tag k="amenity" v="place_of_worship"/>
    <tag k="denomination" v="catholic"/>
    <tag k="historic" v="monument"/>
    <tag k="name" v="Benediktinerinnenkloster St. Johann"/>
    <tag k="name:de" v="Benediktinerinnenkloster St. Johann"/>
    <tag k="name:en" v="Benedictine Convent of Saint John"/>
    <tag k="name:it" v="Convento San Giovanni"/>
    <tag k="name:rm" v="Clostra Son Jon"/>
    <tag k="note" v="UNESCO World Heritage Site"/>
    <tag k="religion" v="christian"/>
    <tag k="tourism" v="attraction"/>
    <tag k="wheelchair" v="yes"/>
    <tag k="wikipedia" v="de:Benediktinerinnenkloster St. Johann"/>
  </node>
</osm>
:(
→Overpass TURBo←
:)
Example
drinking water in a region
...
overpass API
There is more:
- query by timestamp
→ latest-changes - query by user
- search in region
- …
overpass turbo
Overpass API + UI + extensions
+ “extended” overpass Queries
- Shortcuts:
<bbox-query {{bbox}} />instead of:
<bbox-query s="46.41253" w="11.16760" n="46.51894" e="11.32415" /> - Stylesheets:
{{style: … }}+ MapCSS

+ MapCSS
+ Export
- OSM-XML
- GeoJSON
- GPX
- PNG
+ many more usability features
- share queries via short url
- “repair query ”
- templates
- embeddable map
-
publish as gist (→geojson.io)
- send data to JOSM
- etc.
Goals
- “Give the data back to the people”
-
lower the barrier for reusing OSM-data
- quick filtering and search of data
- easy exporting of data
Technical
100% javascript in Browser
data visualization: Leaflet
data format: GeoJSON
Program Sequence
- parse extended query
-
send query to the Overpass API server
-
interpret result:
error message or valid XML/JSON data?
- parse OSM data and convert to GeoJSON
-
apply MapCSS stylesheets
- display vector data in Leaflet map
“Polygon Features”
OSM-way
Line or Polygon?
Heuristic
Polygon iff:
- the way is closed
- not area=no
- at least one tag implies an area
 :
: - building=*
- highway=services (but not highway=service)
- …
Small Features Dilemma
problem:
POI may be a point or a polygon
POI may be a point or a polygon
behaviour on zooming out:
-
point-markers don't change
-
area scales down
„unfair“
solution:
Leaflet Small Features Plugin
on zooming out:
when polygon size ≲ point-POI
display a marker for smallish polygons
on zooming out:
when polygon size ≲ point-POI
display a marker for smallish polygons
Future
1. Query Wizard
-
Learning Overpass Query Language can be a hurdle
-
Simple filters expressed as key=value “templates”
-
Combine simple filters logically:
highway=bus_stop AND operator=SASA - Special filters
… AND type:node… IN Rovereto - like JOSM search tool
demo: http://overpass-tubo.eu/osmit/
2. more MapCSS
set background
canvas {background-map: url('http://tiles.example.com/{z}/{x}/{y}.png');}
labels
node[amenity=restaurant] {text: content('name');}
set popup-content
node[highway=bus_stop] {popup: 'Eine Bushaltestelle';}
line-casings, etc.
3. Plugins
- alternative data sources …
- … new data formats
- more export formats
- UI-extensions
include plugin via “extended overpass syntax”:
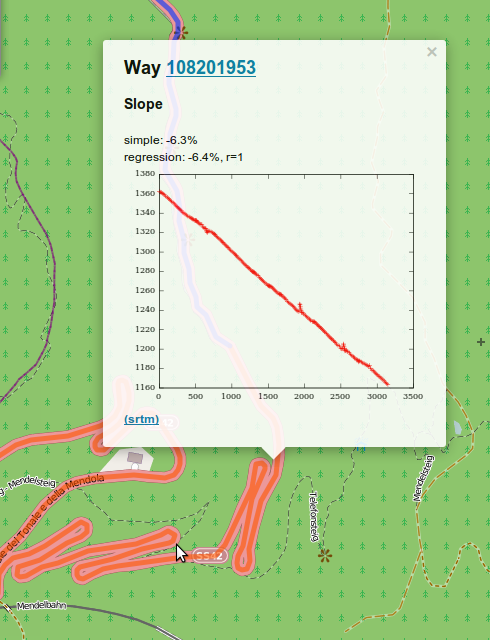
{{plugin:…}}UI-extension Example (height profiles)
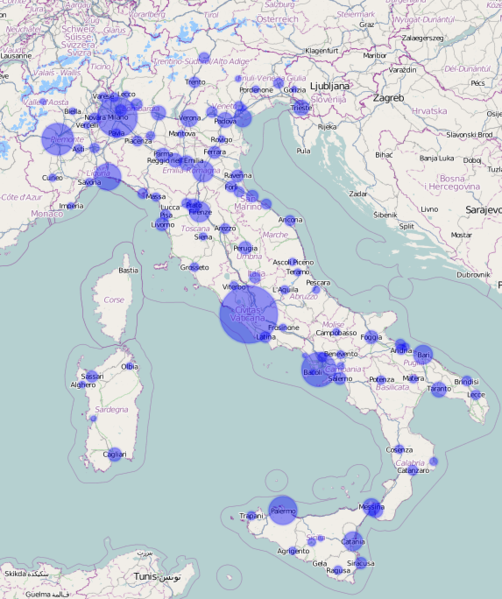
UI-EXTENSION EXAMPLE (Clustered markers)

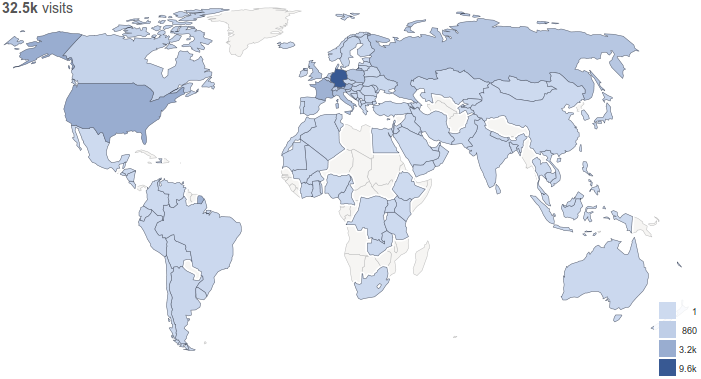
Bonus: Stats
Executed queries since January:
~120.000
~120.000
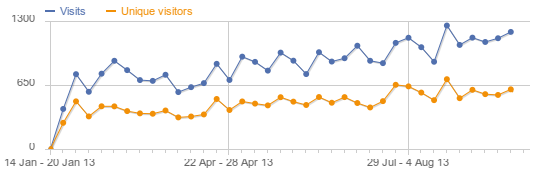
Visits / Visitors:
Questions?

Martin Raifer
http://github.com/tyrasd
Translations Welcome
overpass turbo EN
By Martin Raifer