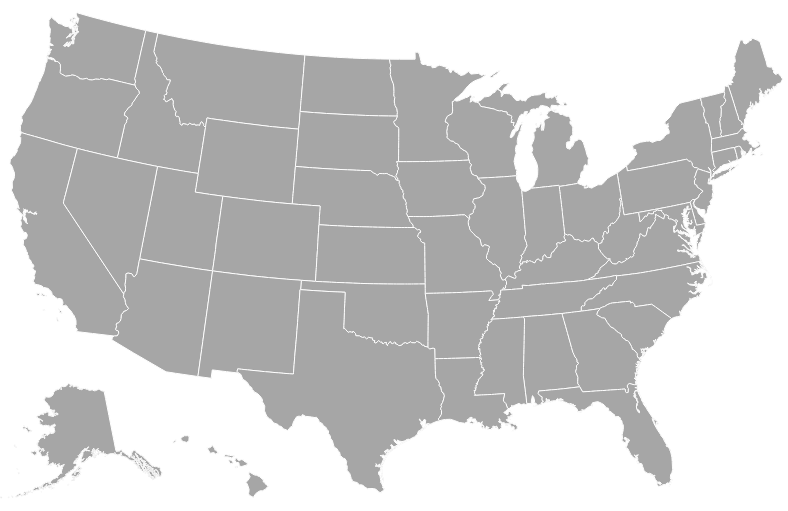
Building Interactive Maps
{review}
Columns
There are 12 columns in the grid
Elements can take up many columns
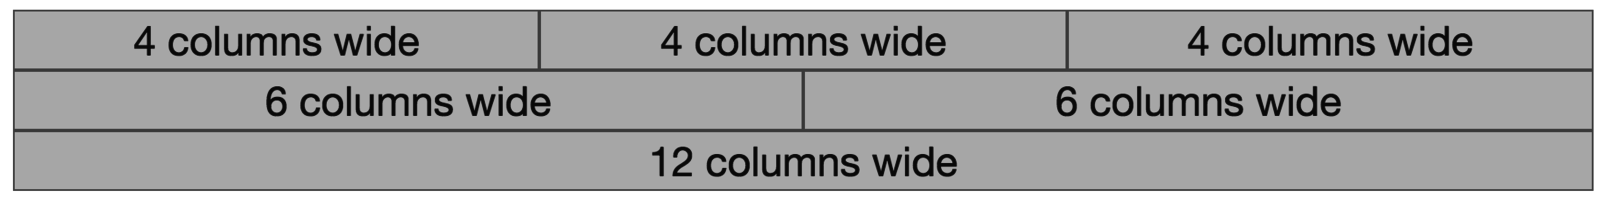
Row 1:

Row 2:
Row 3:
Specify columns based on screen-size


Outline
What are maps made of?
Getting resources (open street map)
Making your map (leaflet.js)
Getting data
Putting it all together
{what are maps made of?}
Using D3
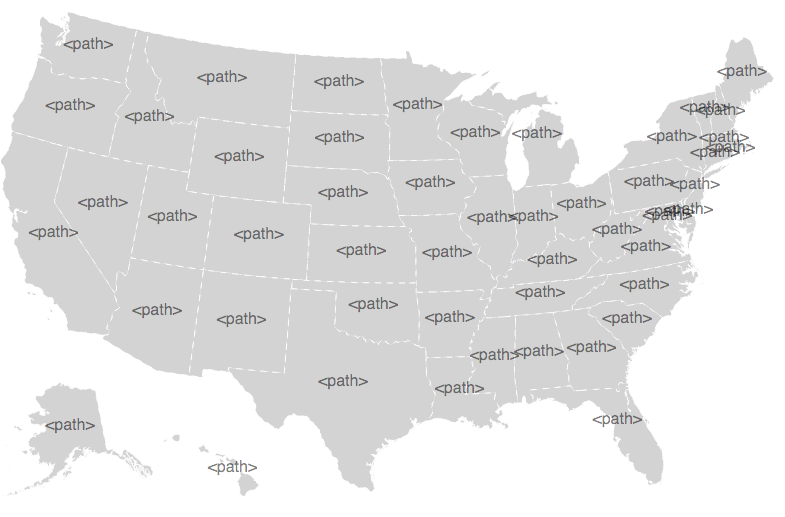
Using D3
(paths)
Using Leaflet
Using Leaflet
(map tiles)
{getting resources}
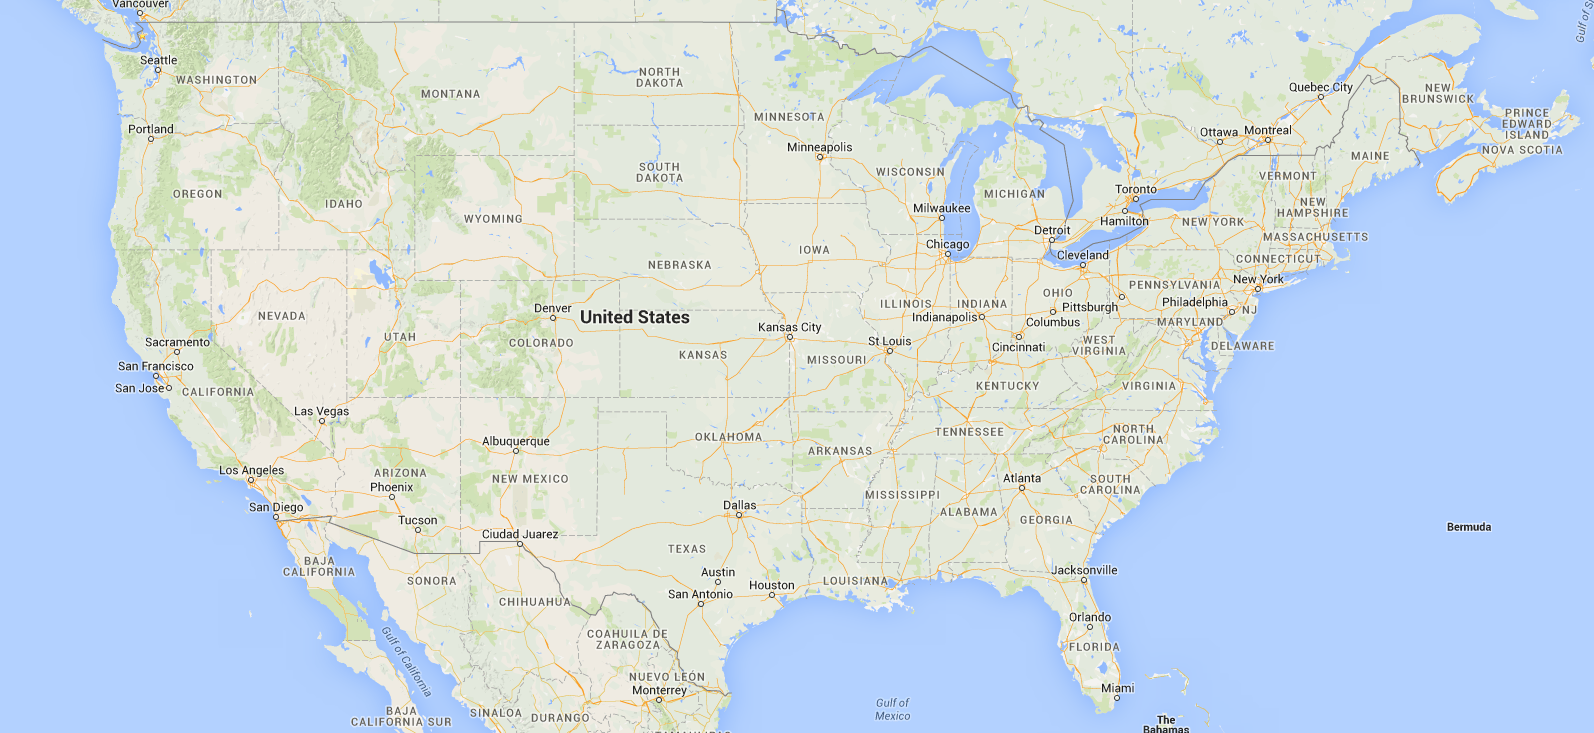
Open Street Map
Free map tiles
Easily accessible
Customizable
{how do we make the map?}
Leaflet.js
Requests map tiles
Handles panning, zooming
Highly customizable
Some syntax
Create a new leaflet map
var map = L.map('map-container')Set your center, zoom
map.setView([latitude, longitude], zoom)Create a tile layer
layer = L.tileLayer('http://{s}.url/{z}/{x}/{y}.png')Adding it to the map
layer.addTo(map)Adding Marks
Create a circle
var marker = new L.circle(
    [latitude, longitude], size, {
    color:'red',
    opacity:.3
})
Add it to the map
marker.addTo(map){let's get some data}
API
"Application Programming Interface"
Protocols, tools for building software
Exposes components (data) in specified formats
Allows web queries of content
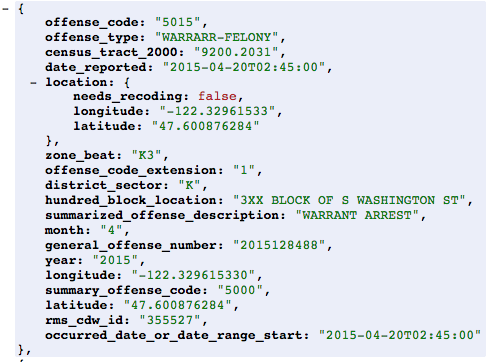
Police Incident Data
Incident data API
https://data.seattle.gov/resource/7ais-f98f.json
Ajax request
Asynchronous data request
Syntax:
var data;
$.ajax({
     url:'https:..../json?year=2015&$limit=50000',
     type: "get",
     success:function(dat) {
       data = dat
       // Create a map using your data!
     },
     dataType:"json"
})
Used to get/push data from servers/databases
Marker for each data point
Call after completion of ajax call
$.ajax({
     success:function(dat) {
       data = dat
       // Create a point using each element
     },
})
Loop through data
data.map(function(d) {
    new Circle([d.lat, d.long]....)
})
Binding pop-up
Bind pop-up info to your circle
circle.bindPopup('text goes here')What information?
Assignments
Bootstrap challenge (due Thursday before class )
Police-shooting challenge (due Monday before class )
leaflet
By Michael Freeman
leaflet
Tutorial on using Leaflet.js to build maps


