Machine Learning

{what do we do to data?}

{nothing}
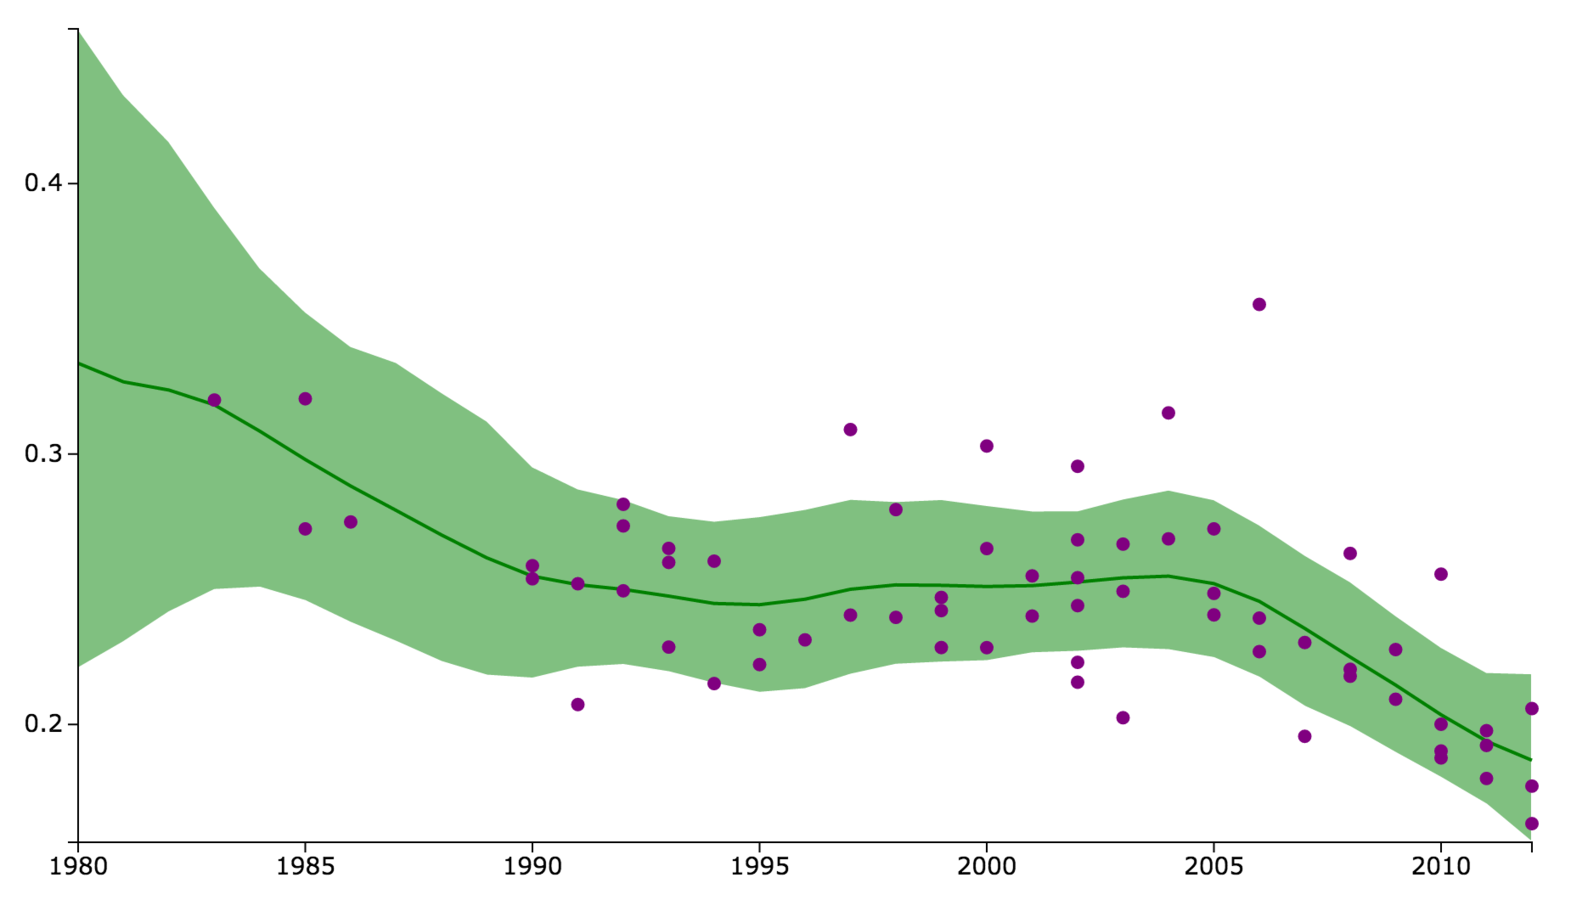
Above all else, show the data

{clean}
{model}
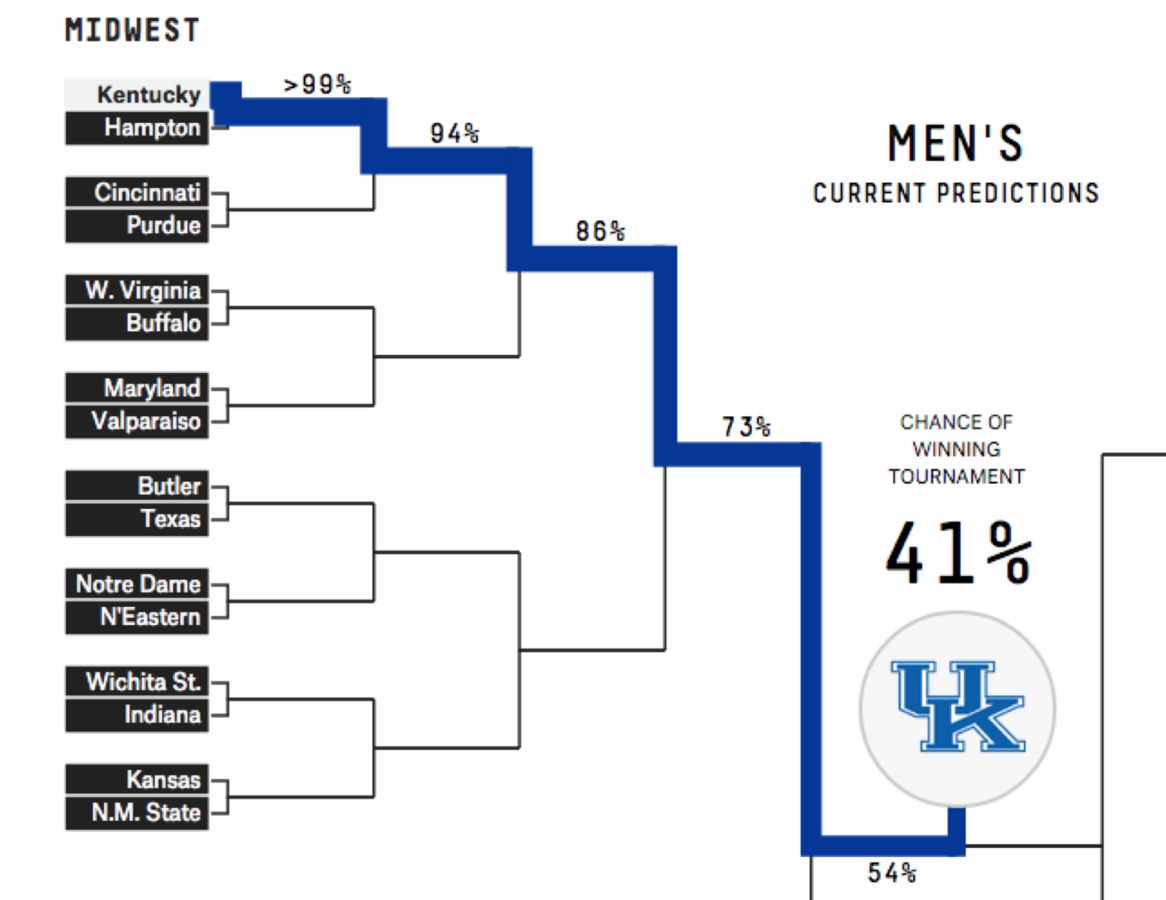
{predict}
Machine learning and statistics are a set of tools used to ask questions about data. They leverage mathematical concepts and computational abilities to make inferences about relationships, or make predications about unobserved contexts.
In general, you are faced with a tradeoff between:
prediction accuracy
model interpretability
more statistics
more machine learning
(this slide would make some people very mad)
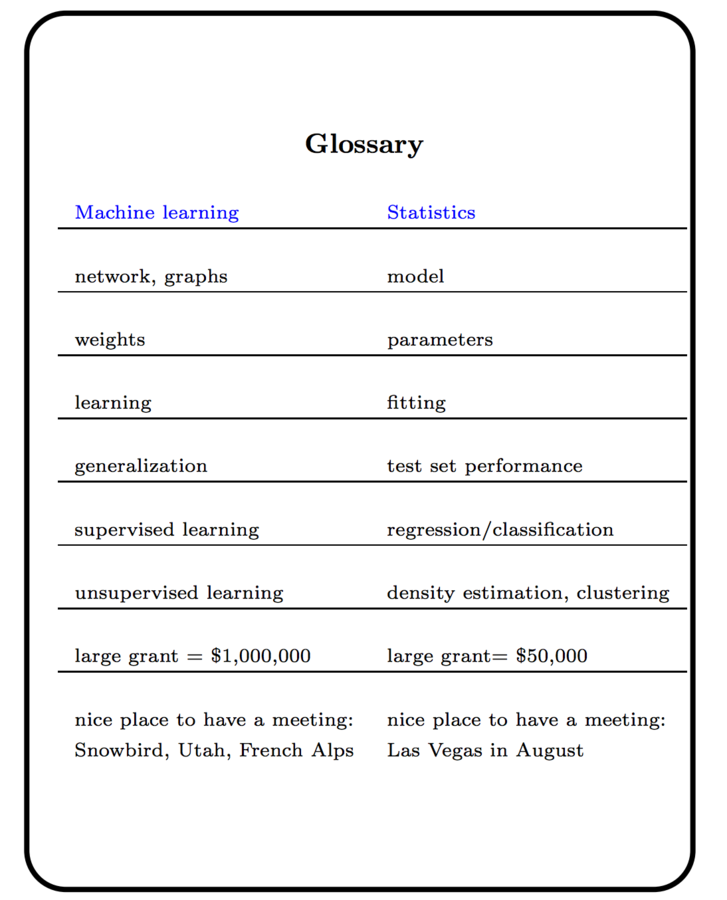
Statistics
machine learning
Machine learning
statistics
Some other thoughts
Machine learning is statistics on a mac
machine learning is statistics minus any checking of models and assumptions -Brian D. Ripley
All valid tools to choose from, but you must select the right tool for the task
Simple to use, difficult to use well

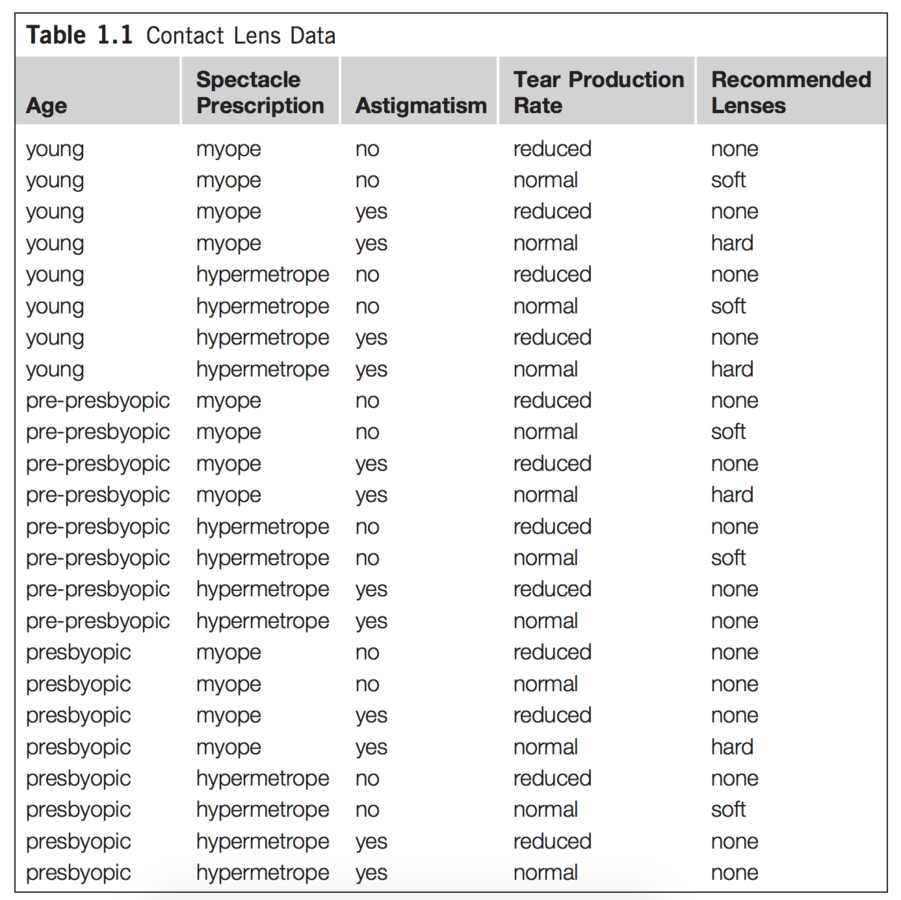
Today we'll be performing a common machine learning task: classification.
We'll attempt to determine if an instance (observation) is a member of a particular class.
In other words, we'll be predicting a categorical variable.
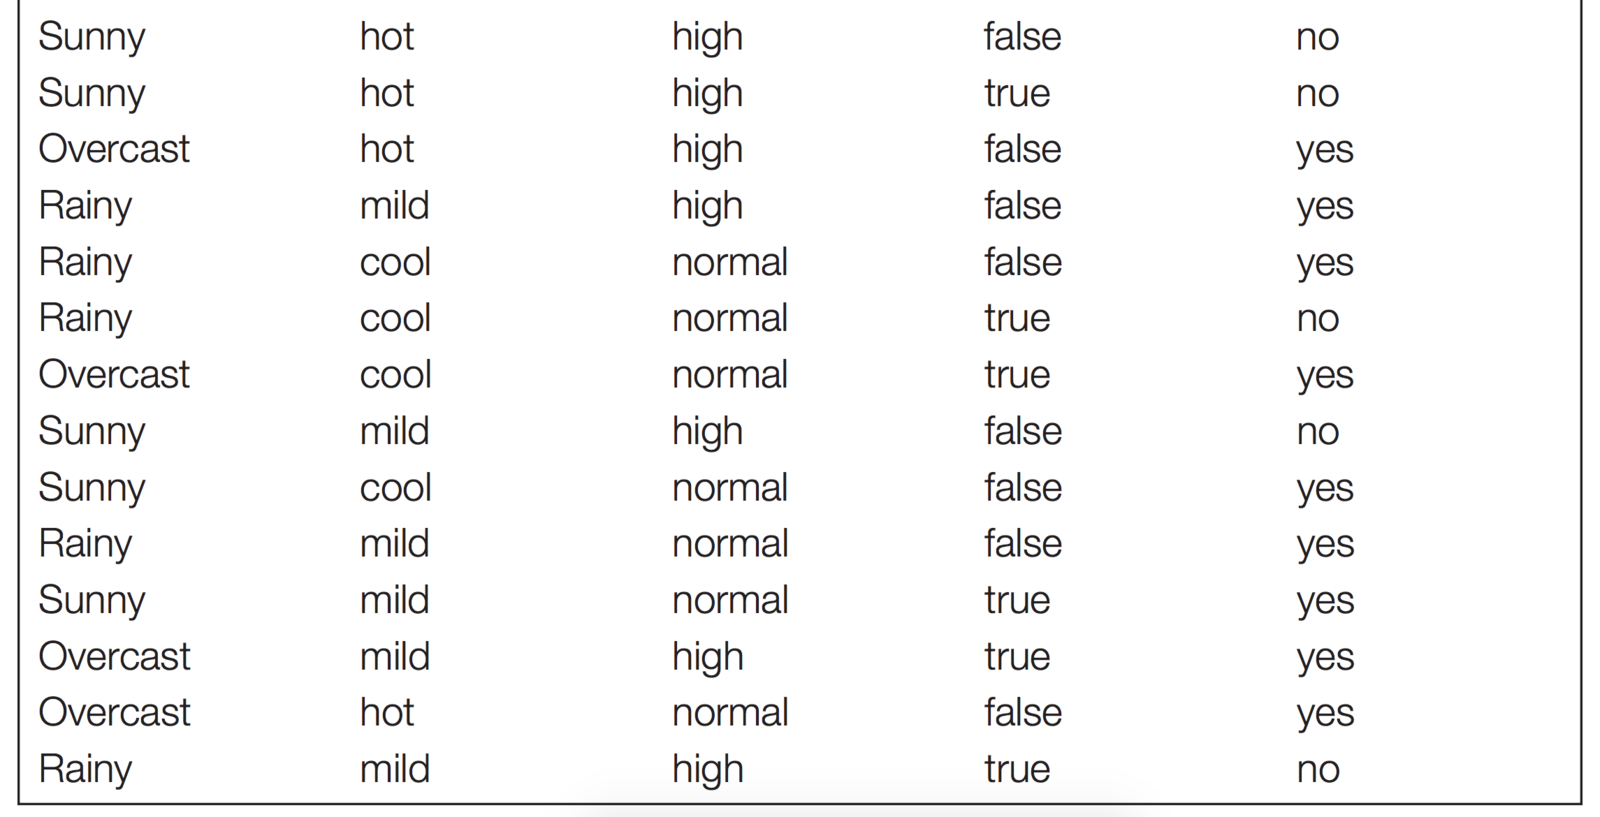
outlook
temp.
humidity
windy
skip class
Let's say I want to predict if a student will come to class...
outlook
temp.
humidity
windy
skip class
Let's say I want to predict if a student will come to class...
outcome
outlook
temp.
humidity
windy
skip class
Let's say I want to predict if a student will come to class...
outcome
attributes or features
each row is an instance
outlook
temp.
humidity
windy
skip class
Write 3 rules to classify observations as skipping/attending class
(if FEATURE(s) is VALUE, OUTCOME is VALUE)
outcome
attributes or features

this is a bit cumbersome....
this is awesome!
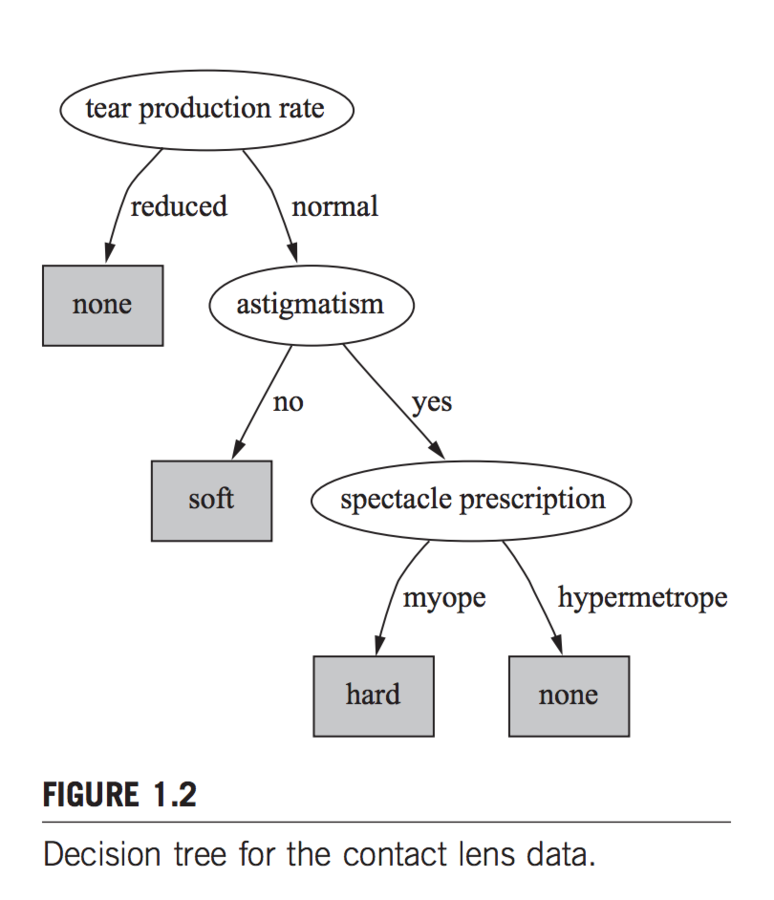
Node tests an attribute
Terminal node (leaf) assigns a classification
but how do we do it?
pick attributes that produce the most "pure" branches
repeat....
repeat....
Classification in R
# One of many libraries for classification / ML
library(rpart)

# Read in data
homes <- read.csv('part_1_data.csv')

# Use rpart to fit a model: predict `in_sf` using all variables
basic_fit <- rpart(in_sf ~ ., data = homes, method="class")
# How well did the model perform?
predicted <- predict(basic_fit, homes, type='class')
accuracy <- length(which(data[,'in_sf'] == predicted)) / length(predicted) * 100
Wrapping those tasks in functions
# Function to compare values
assess_fit <- function(model, data = homes, outcome = 'in_sf') {
  predicted <- predict(model, data, type='class')
  accuracy <- length(which(data[,outcome] == predicted)) / length(predicted) * 100
  return(paste0(accuracy, '% accurate!'))
}

# Use rpart to fit a model: predict `in_sf` using all other variables
basic_fit <- rpart(in_sf ~ ., data = homes, method="class")

# How well did we do?
assess_fit(basic_fit)

# Get a perfect fit: increase complexity, allow small splits
perfect_fit <- rpart(in_sf ~ ., data = homes, method="class",
                 control=rpart.control(cp = 0, minsplit=2))

assess_fit(perfect_fit)
What about testing/training data?
# Testing/training data:
sample_size <- floor(.25 * nrow(homes))
train_indicies <- sample(seq_len(nrow(homes)), size = sample_size)
training_data <- data[train_indicies,]
test_data <- data[-train_indicies,]

# Train on training data, test on testing data: basic fit
basic_fit <- rpart(in_sf ~ ., data = training_data, method="class")
assess_fit(basic_fit, data=test_data)
Seeing the tree!
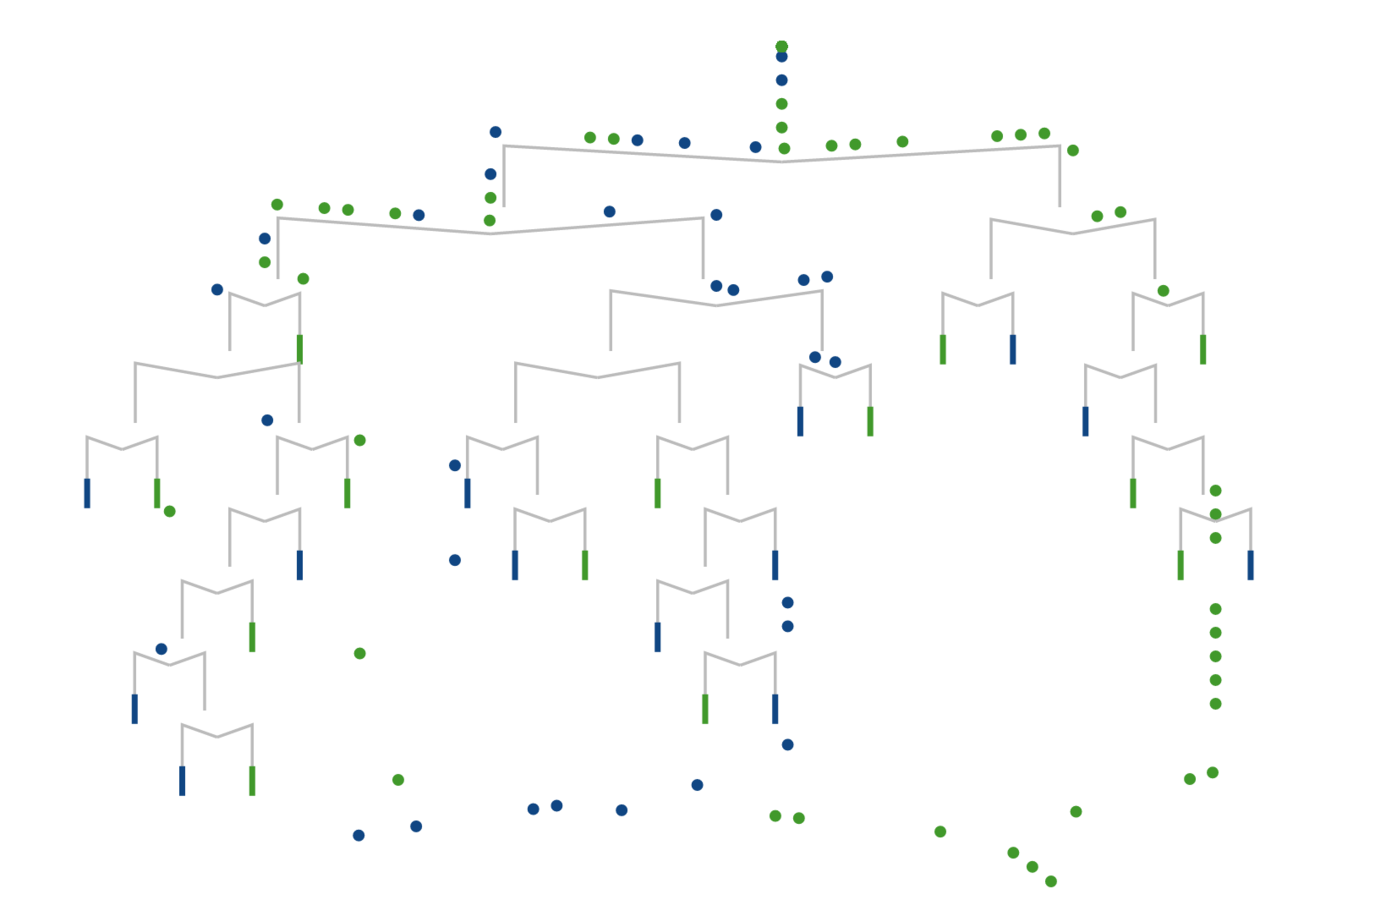
# Visualize the tree using the base graphics package
png('visuals/tree_structure.png', width=900, height=900)
plot(basic_fit)
text(basic_fit, use.n = TRUE)
dev.off()

# Visualize basic fit
png('visuals/basic_fit.png', width=900, height=900)
fancyRpartPlot(basic_fit)
dev.off()
{could we build an interactive machine learning interface with Shiny....?}
Parameterizing the function
simple_tree <- function(predictors) {
  # Write out forumula
  predictors <- paste( predictors, collapse = "+")
  print(predictors)
  formula <- as.formula(paste0('in_sf ~ ', predictors))

  # Set test / training data
  sample_size <- floor(.25 * nrow(homes))
  train_indicies <- sample(seq_len(nrow(homes)), size = sample_size)
  training_data <- homes[train_indicies,]
  test_data <- homes[-train_indicies,]

  # Use rpart to fit a model: predict `in_sf` using other variables
  fit <- rpart(formula, data = training_data, method="class")

  # List of info to return
  info <- list()
  info$accuracy <- assess_fit(fit, data=test_data)
  p <- fancyRpartPlot(fit, sub='')
  info$tree <- p
  return(info)
}
server.R: reactive expressions
shinyServer(function(input, output){
  # Use a reactive expression so that you only run the code once
  getResults <- reactive ({
    return(simple_tree(input$features))
  })
  output$plot <- renderPlot({
    results <- getResults()
    return(results$plot)
  })
  output$accuracy <- renderText({
    results <- getResults()
    return(results$accuracy)
  })
})
ui.R
# Create UI
library(shiny)
shinyUI(fluidPage(
  # UI for the traffic simulation
  titlePanel('Housing Tree'),

  # Controls
  sidebarLayout(
    sidebarPanel(
      checkboxGroupInput("features", label = h3("Features to Use"),
           choices = colnames(homes)[2:ncol(homes)],
           selected = colnames(homes)[2:ncol(homes)])
    ),
    # Render plot
    mainPanel(
      plotOutput("plot"),
      textOutput('accuracy')
    )
  )
))
Assignments
Final project due next Friday!
Peer Evaluation due by Monday (3/14)
machine-learning
By Michael Freeman


