JavaScript
차트 라이브러리 비교 2016
JavaScript
Index
- D3.js
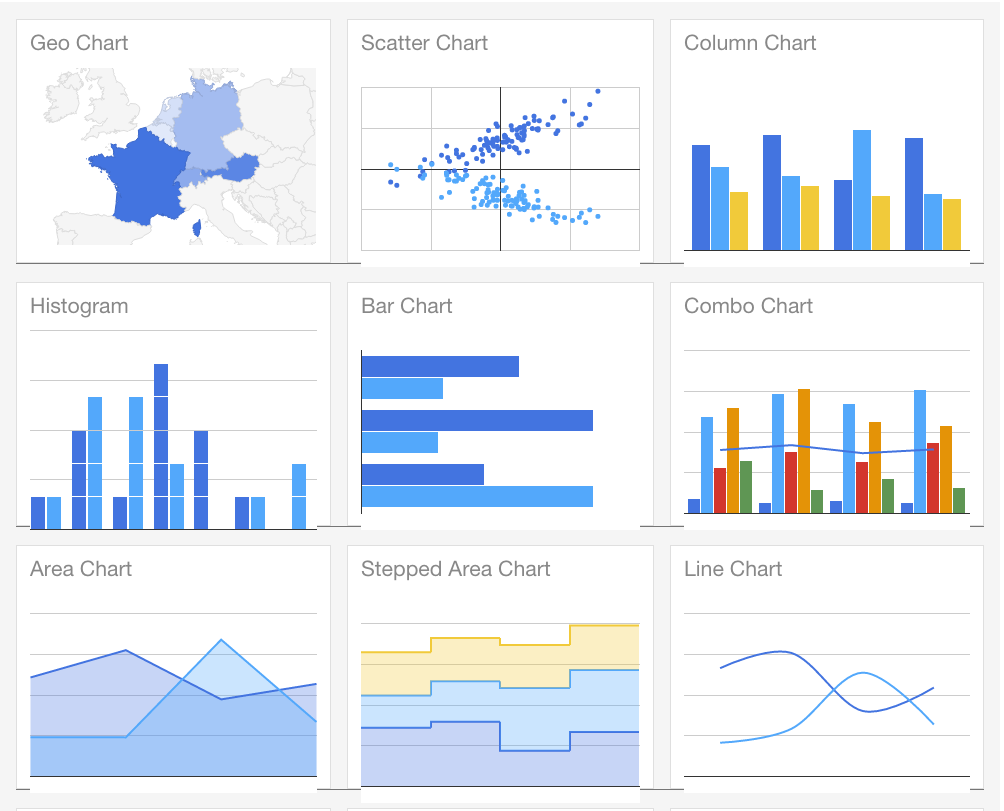
- Google Charts
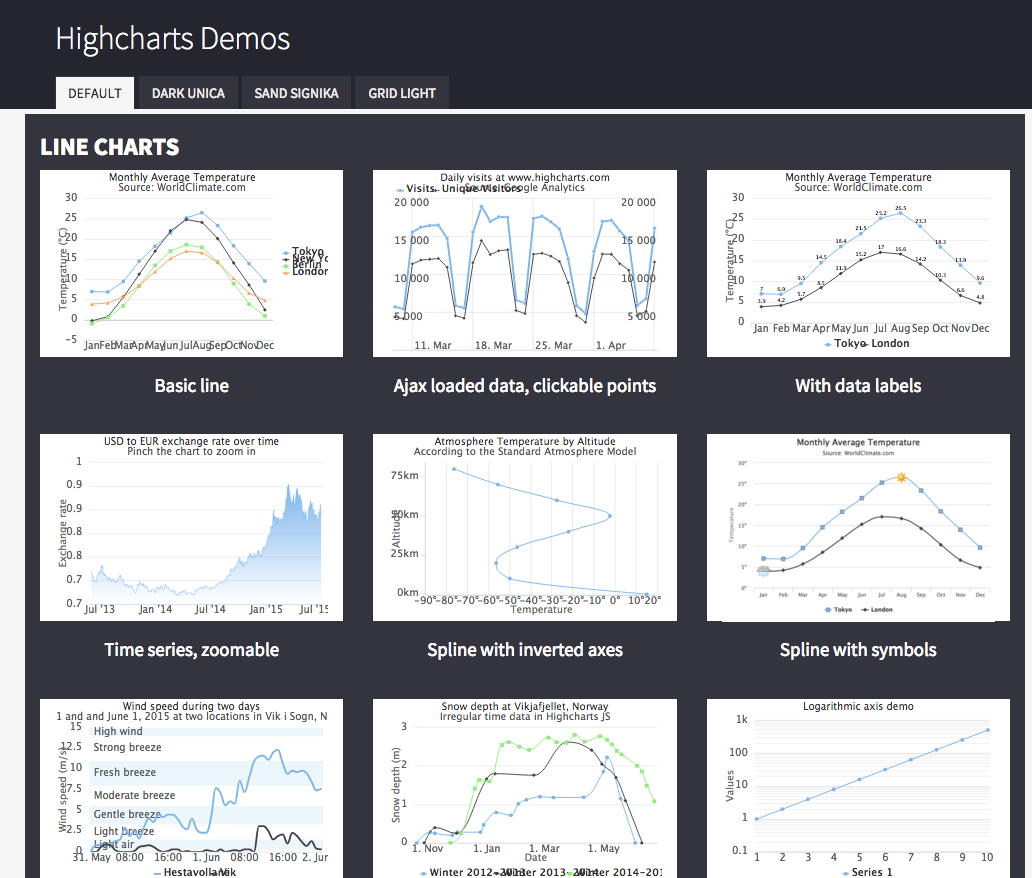
- HighCharts
- Chart.js
- 기타
- 결론
Check list
- Cross Browser Compatibility
- Cross Device Compatibility
- Input Data Format
- Customizability
- Range of Available Charts
- Learning Curve
- Plugins / wrappers for Frameworks
- Exporting
- Pricing and Licensing Terms
- Open Source or Commercial
http://www.fusioncharts.com/javascript-charts-guide/
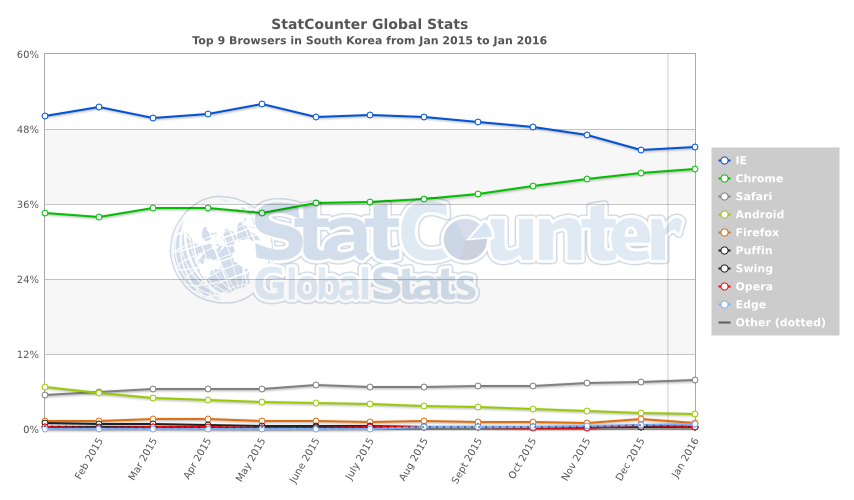
http://gs.statcounter.com/
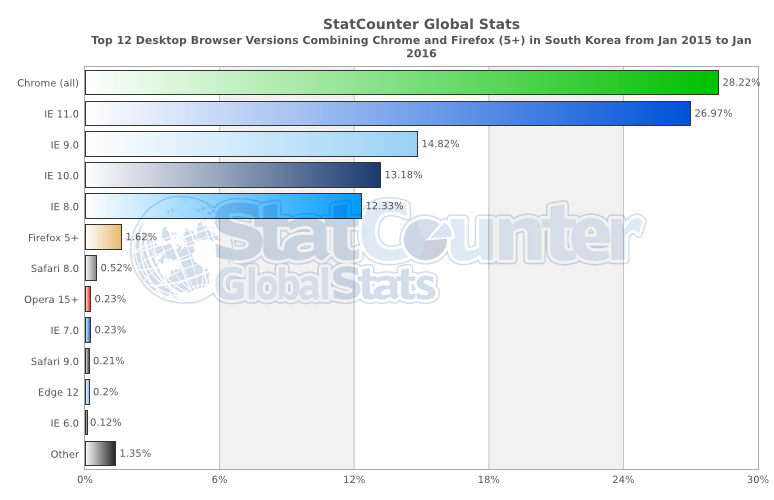
http://gs.statcounter.com/
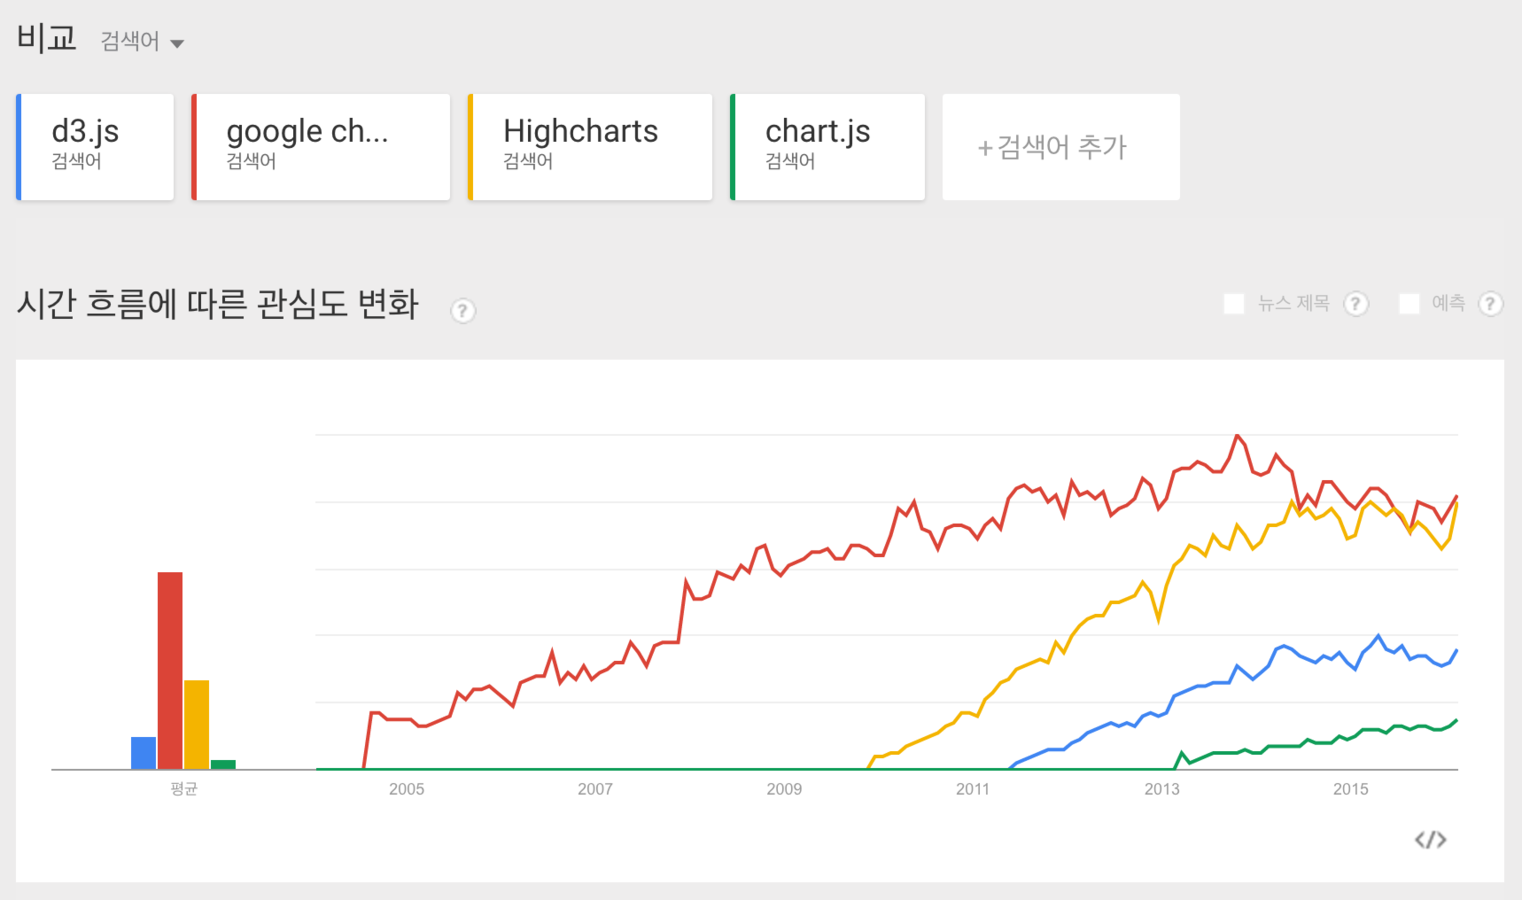
https://www.google.com/trends/?hl=ko
D3.js
http://stackoverflow.com/questions/27347798/comparison-between-d3-js-and-chart-js-only-for-charts
| Input data format | JSON, XML |
| Open source | O |
| Licensing | BSD-3 |
| Rendering tech | SVG |
D3.js
http://stackoverflow.com/questions/27347798/comparison-between-d3-js-and-chart-js-only-for-charts
가파른 학습 곡선
데이터시각화 / 조작 툴
SVG 기반
Canvas 기반
D3.js
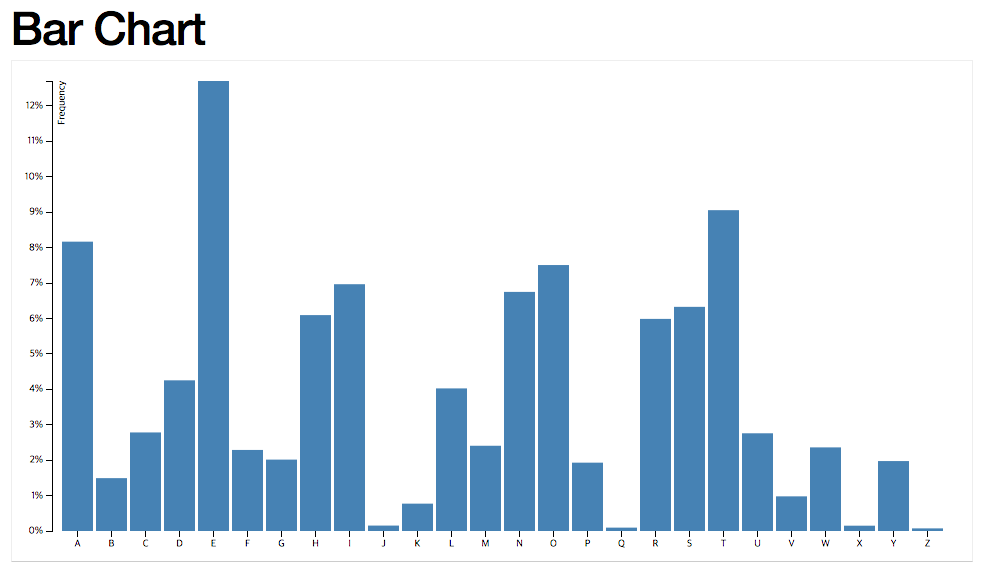
https://bl.ocks.org/mbostock/3885304
var margin = {top: 20, right: 20, bottom: 30, left: 40},
    width = 960 - margin.left - margin.right,
    height = 500 - margin.top - margin.bottom;

var x = d3.scale.ordinal()
    .rangeRoundBands([0, width], .1);

var y = d3.scale.linear()
    .range([height, 0]);

var xAxis = d3.svg.axis()
    .scale(x)
    .orient("bottom");

var yAxis = d3.svg.axis()
    .scale(y)
    .orient("left")
    .ticks(10, "%");

var svg = d3.select("body").append("svg")
    .attr("width", width + margin.left + margin.right)
    .attr("height", height + margin.top + margin.bottom)
  .append("g")
    .attr("transform", "translate(" + margin.left + ","
                                + margin.top + ")");
d3.tsv("data.tsv", type, function(error, data) {
  if (error) throw error;

  x.domain(data.map(function(d) { return d.letter; }));
  y.domain([0, d3.max(data, function(d) { return d.frequency; })]);

  svg.append("g")
      .attr("class", "x axis")
      .attr("transform", "translate(0," + height + ")")
      .call(xAxis);

  svg.append("g")
      .attr("class", "y axis")
      .call(yAxis)
    .append("text")
      .attr("transform", "rotate(-90)")
      .attr("y", 6)
      .attr("dy", ".71em")
      .style("text-anchor", "end")
      .text("Frequency");

  svg.selectAll(".bar")
      .data(data)
    .enter().append("rect")
      .attr("class", "bar")
      .attr("x", function(d) { return x(d.letter); })
      .attr("width", x.rangeBand())
      .attr("y", function(d) { return y(d.frequency); })
      .attr("height", function(d) { return height - y(d.frequency); });
});

function type(d) {
  d.frequency = +d.frequency;
  return d;
}
D3.js
D3.js
http://bl.ocks.org/mbostock/1353700
http://bl.ocks.org/mbostock/4063550
https://bost.ocks.org/mike/fisheye/
http://bl.ocks.org/kerryrodden/7090426
데이터 시각화용 jQuery
Google charts
| Input data format | JS API, JSON, CSV, Google Spreadsheets |
| Open source | X |
| Licensing | Google controls API (code samples-Apache 2.0) |
| Rendering tech | SVG, VML |
Google charts
google api 서버에 접속필요
offline 사용 불가
api docu 상세
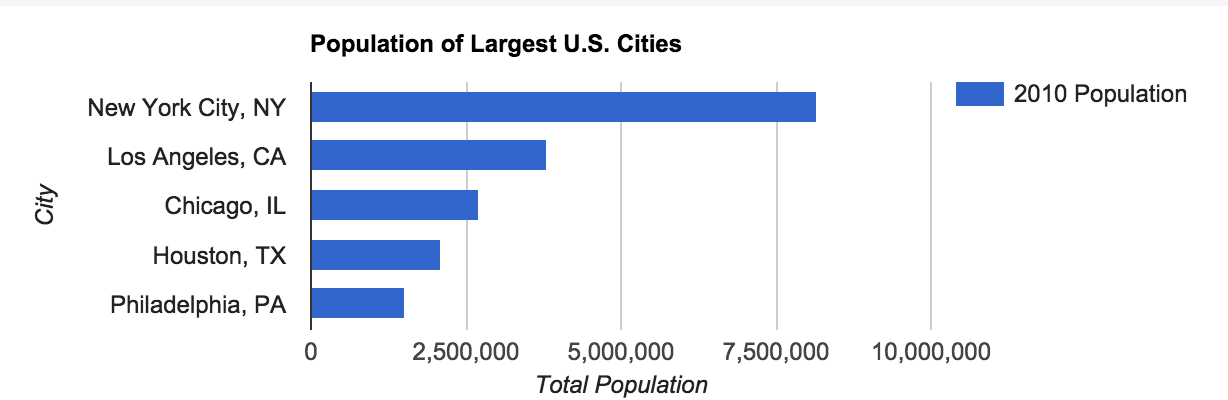
Google charts
Google charts
google.charts.load('current', {packages: ['corechart', 'bar']});
google.charts.setOnLoadCallback(drawBasic);

function drawBasic() {

      var data = google.visualization.arrayToDataTable([
        ['City', '2010 Population',],
        ['New York City, NY', 8175000],
        ['Los Angeles, CA', 3792000],
        ['Chicago, IL', 2695000],
        ['Houston, TX', 2099000],
        ['Philadelphia, PA', 1526000]
      ]);

      var options = {
        title: 'Population of Largest U.S. Cities',
        chartArea: {width: '50%'},
        hAxis: {
          title: 'Total Population',
          minValue: 0
        },
        vAxis: {
          title: 'City'
        }
      };

      var chart = new google.visualization.BarChart(document.getElementById('chart_div'));

      chart.draw(data, options);
    }
Google charts
HighCharts
| Input data format | JS API, JSON, CSV, Google Spreadsheets, HTML table |
| Open source | O |
| Licensing | Non-commercial or commercial CC-by nc 3.0 |
| Rendering tech | SVG, VML |
HighCharts
large and active community
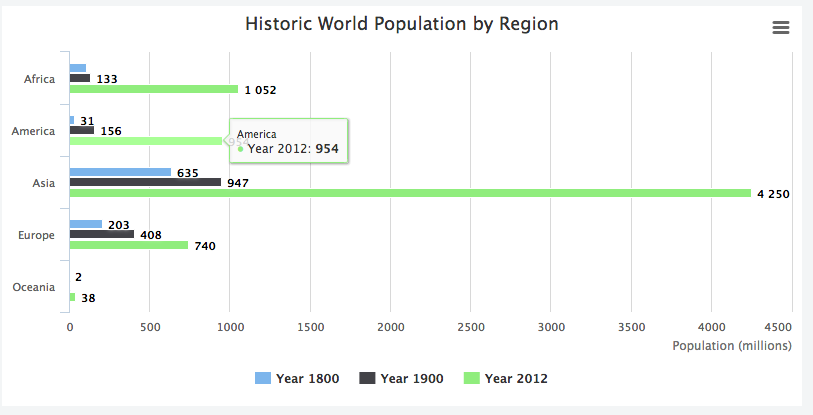
HighCharts
HighCharts
$(function () {
    $('#container').highcharts({
        chart: {
            type: 'bar'
        },
        title: {
            text: 'Historic World Population by Region'
        },
        xAxis: {
            categories: ['Africa', 'America', 'Asia', 'Europe', 'Oceania'],
            title: {
                text: null
            }
        },
        yAxis: {
            min: 0,
            title: {
                text: 'Population (millions)',
                align: 'high'
            },
            labels: {
                overflow: 'justify'
            }
        },
        plotOptions: {
            bar: {
                dataLabels: {
                    enabled: true
                }
            }
        },
        credits: {
            enabled: false
        },
        series: [{
            name: 'Year 1800',
            data: [107, 31, 635, 203, 2]
        }, {
            name: 'Year 1900',
            data: [133, 156, 947, 408, 6]
        }, {
            name: 'Year 2012',
            data: [1052, 954, 4250, 740, 38]
        }]
    });
});
http://www.highcharts.com/demo/bar-basic
HighCharts
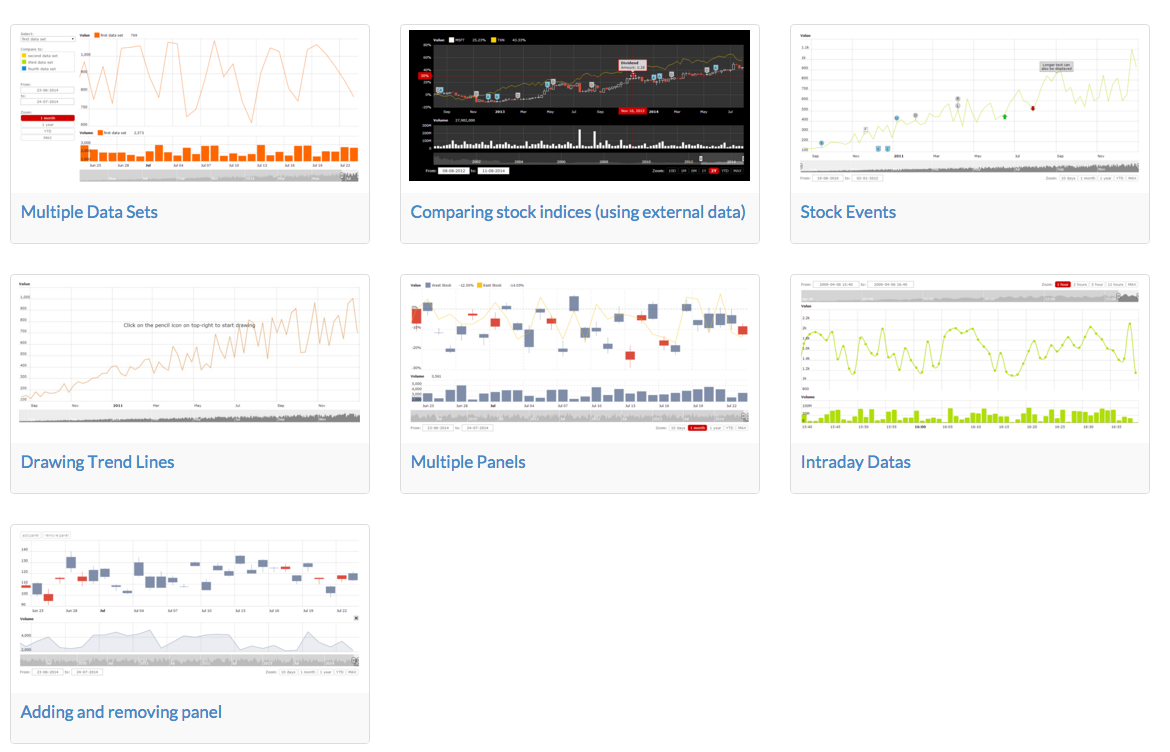
HighCharts-(HighStock)
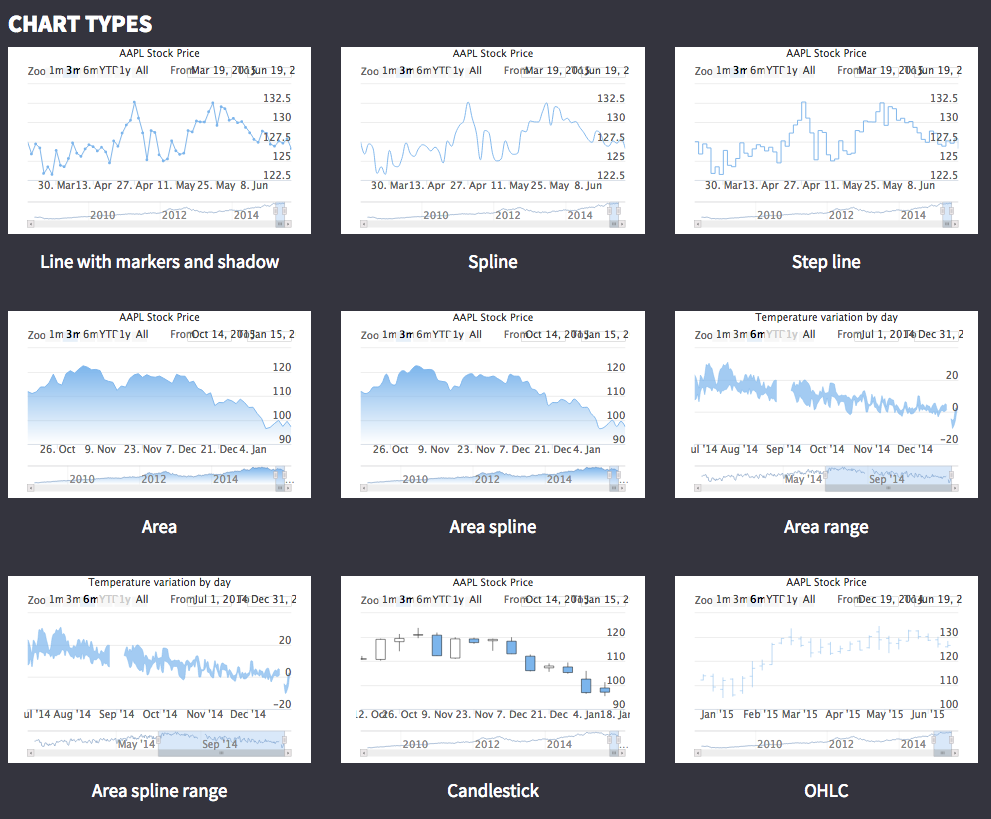
HighCharts-(HighMaps)
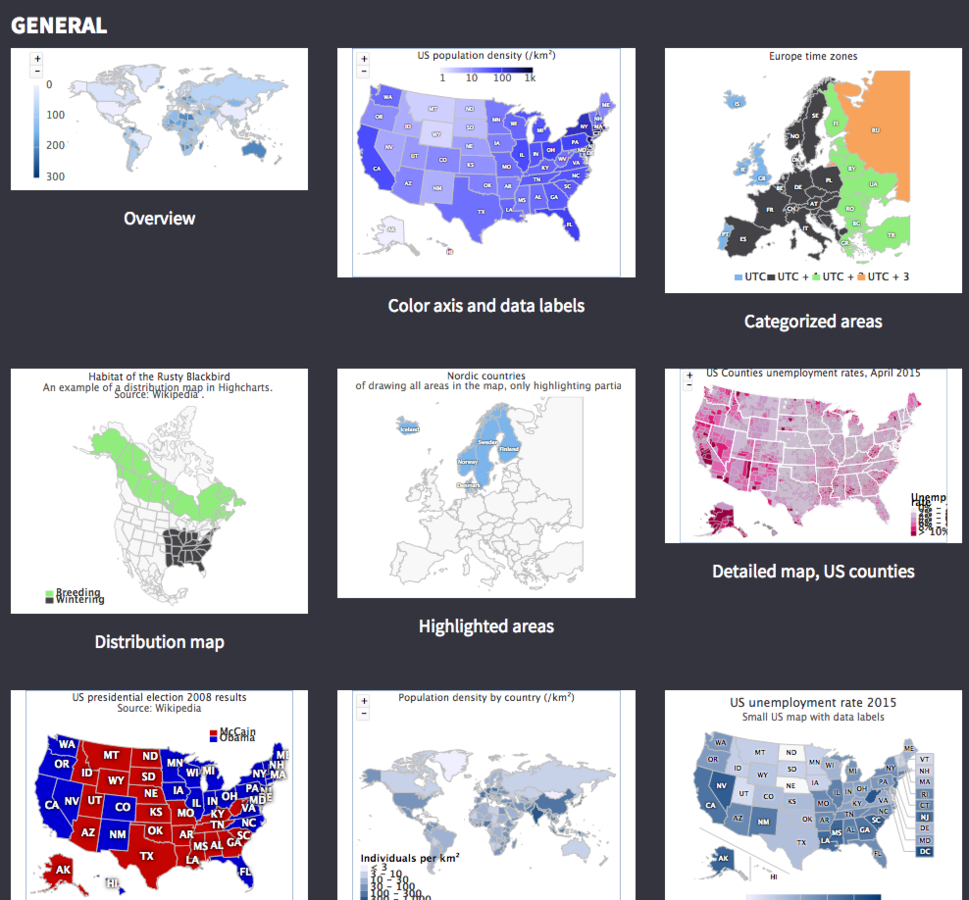
Chart.js
| Input data format | Canvas |
| Open source | O |
| Licensing | MIT license |
| Rendering tech | Canvas |
Chart.js
가볍고 빠름
11kb gzipped
옵션이 부족
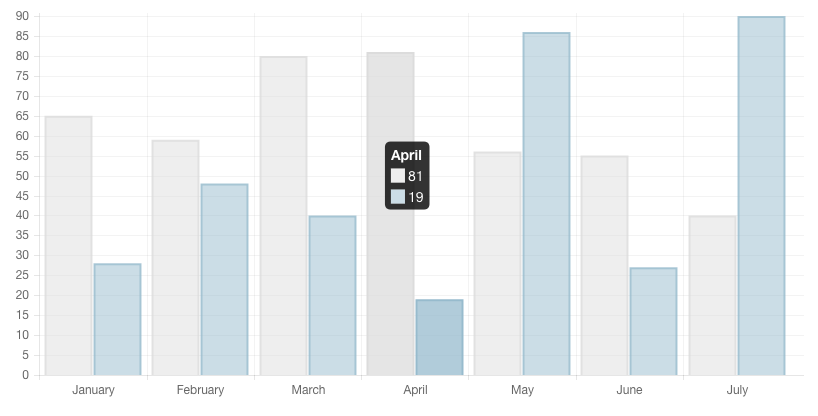
Chart.js
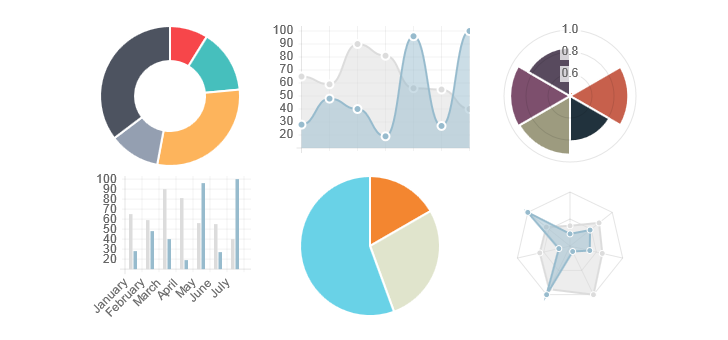
Chart.js
var myBarChart = new Chart(ctx).Bar(data, options);

var data = {
    labels: ["January", "February", "March", "April", "May", "June", "July"],
    datasets: [
        {
            label: "My First dataset",
            fillColor: "rgba(220,220,220,0.5)",
            strokeColor: "rgba(220,220,220,0.8)",
            highlightFill: "rgba(220,220,220,0.75)",
            highlightStroke: "rgba(220,220,220,1)",
            data: [65, 59, 80, 81, 56, 55, 40]
        },
        {
            label: "My Second dataset",
            fillColor: "rgba(151,187,205,0.5)",
            strokeColor: "rgba(151,187,205,0.8)",
            highlightFill: "rgba(151,187,205,0.75)",
            highlightStroke: "rgba(151,187,205,1)",
            data: [28, 48, 40, 19, 86, 27, 90]
        }
    ]
};
Chart.js
기타
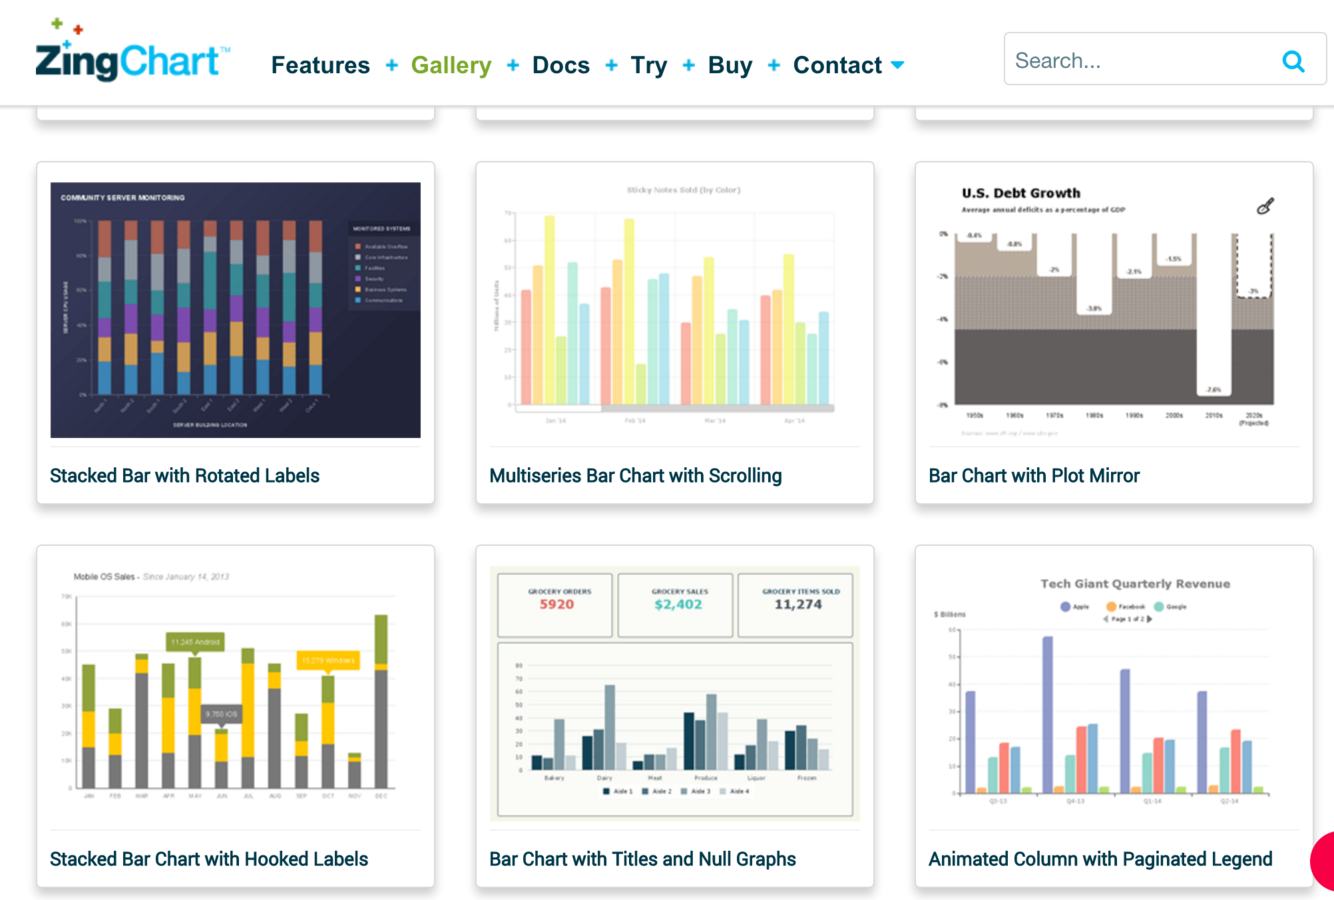
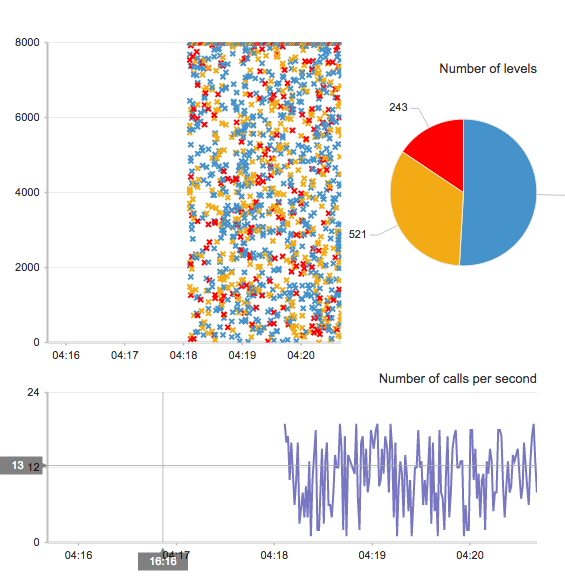
ZingChart
100k+ 빅데이터. with interactivity.
Canvas, SVG, and VML
기타
amChart
free
상업 용도로 사용 가능(branded)
https://www.amcharts.com/
기타
JUI
opensource
jQuery based(1.8+)
jui.io/
기타
d3 based
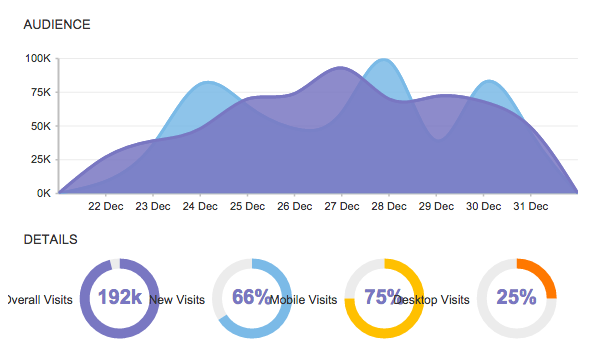
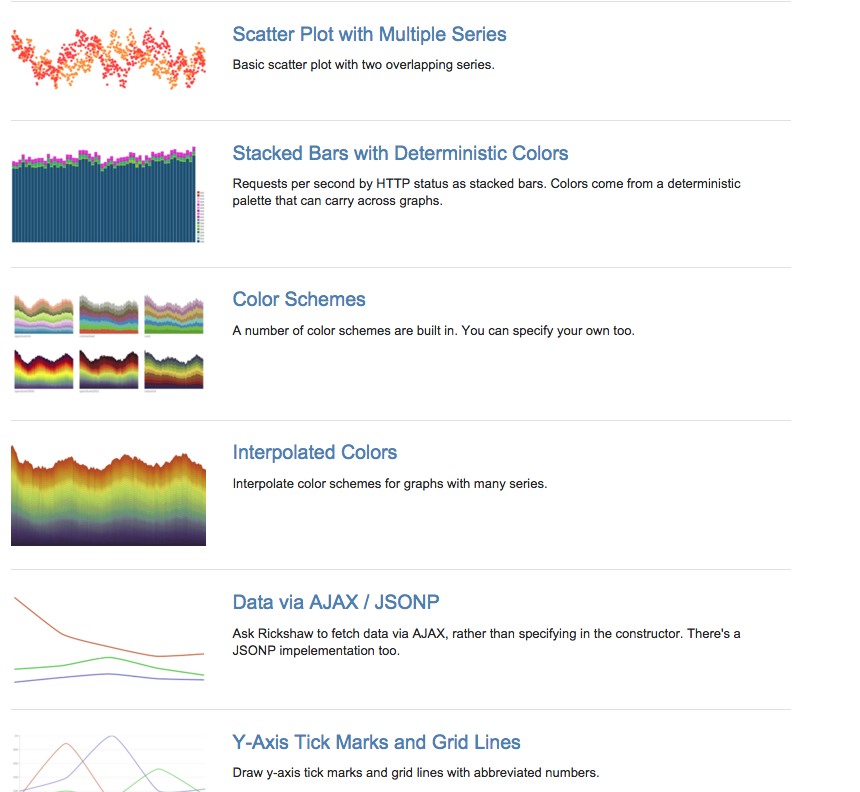
http://code.shutterstock.com/rickshaw/
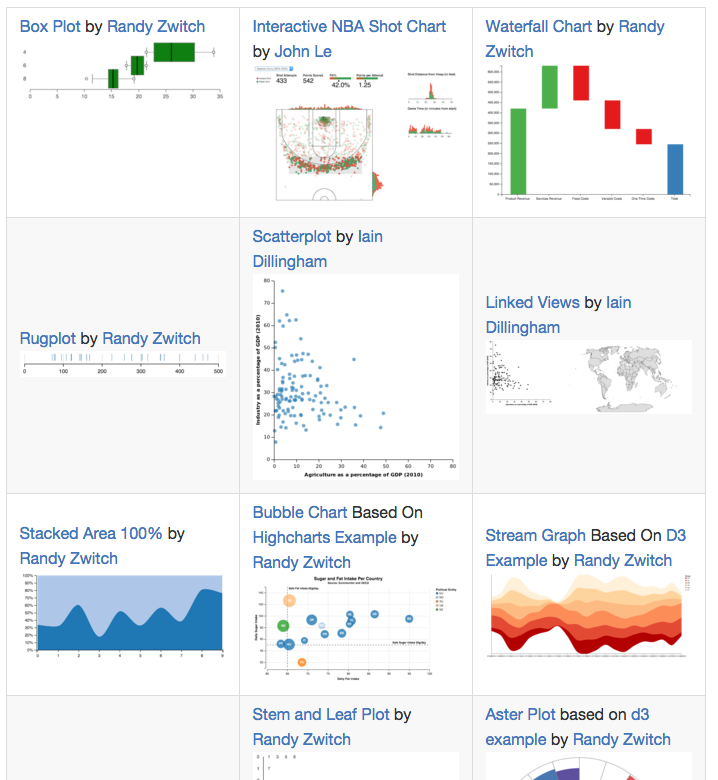
https://github.com/vega/vega
기타
d3 based
http://forio.com/contour/
http://nvd3.org/
http://c3js.org/
...
기타
Online cart building tools
http://www.chartblocks.com/
https://cloud.highcharts.com/
https://live.amcharts.com/
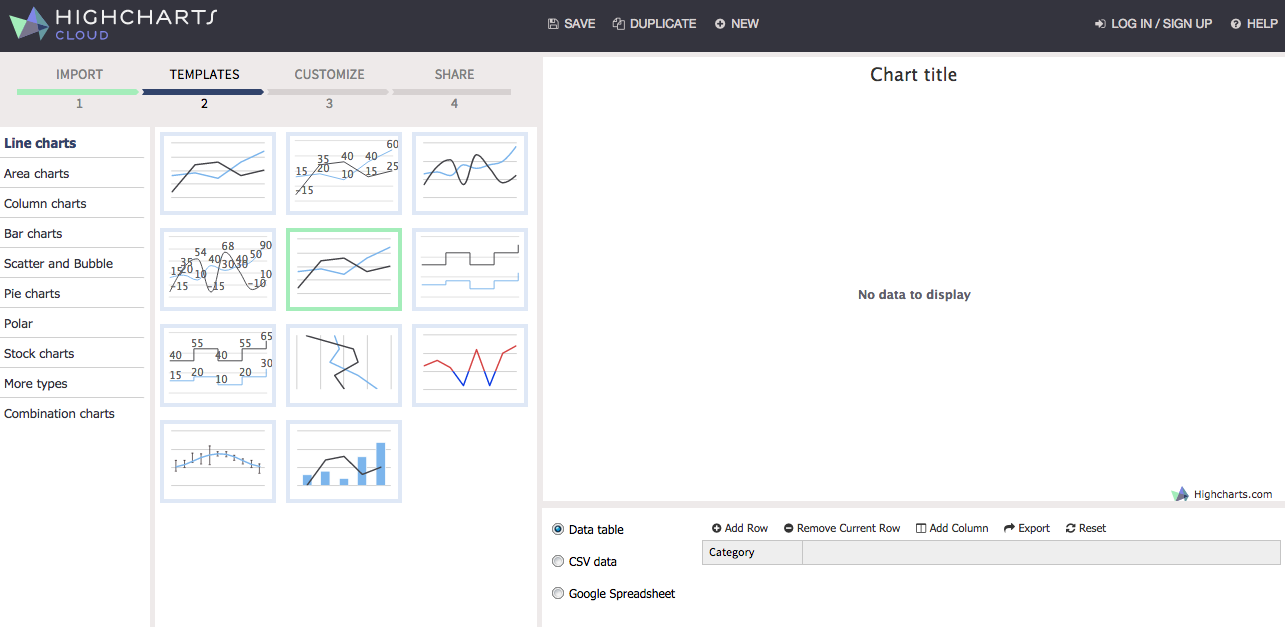
결론..?
1. 용도에 맞게 잘쓰자
2. FOSS 의 강력함

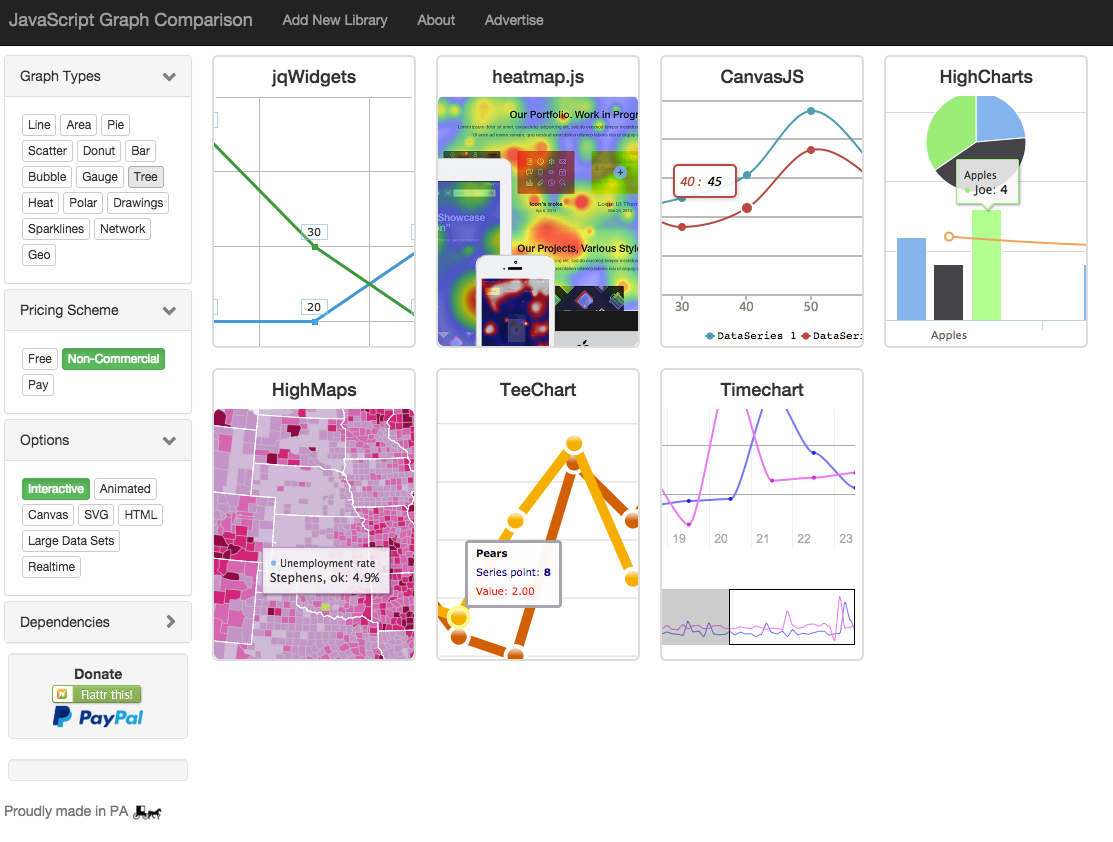
데모 사이트
http://www.jsgraphs.com/
Reference
- http://www.slant.co/topics/3890/~javascript-charting-libraries
- https://www.reddit.com/r/webdev/comments/2cbz2a/what_javascript_html5_libraries_do_you_prefer_for/
- https://news.ycombinator.com/item?id=8261157
- https://www.reddit.com/r/javascript/comments/26yk5r/javascript_charting_libraries_a_replacement_for/
Q&A
감사합니다.
Chart-library-comparison
By Ming Kim


