Scaling with node
Thierry Nilles
streamroot.io
@thierrynilles
Our experience on growth


What we Do
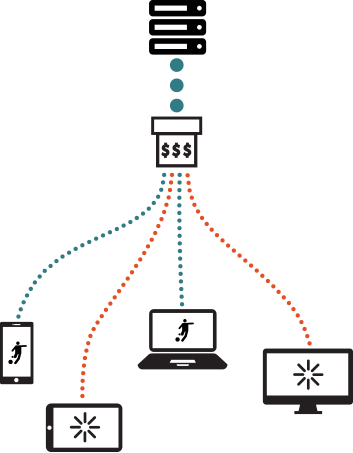
Classic CDN
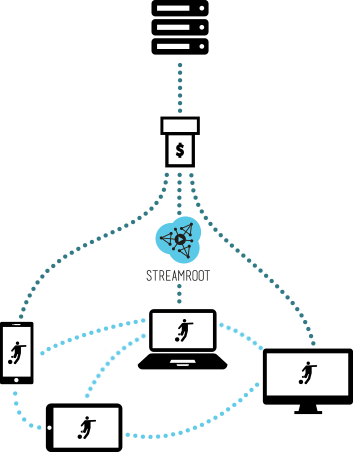
with Streamroot
DEmo
demo.streamroot.io
A server? For P2P?
We need to keep track of viewers
So that we can connect them together
First Attempt
The big picture
Tracker
Redis
socket.io
Issues
Tracker going down!
~1000

viewers
So we scaled
Horizontally
Tracker
Tracker
Tracker
HAProxy
Redis
Wait... Trackers should
Talk to each other
Tracker
Tracker
Tracker
Redis
No problem
Use redis built-in pubSUB!
"This guy wants to talk"
got it
got it
Autoscaling
Home-made
Didn't use amazon
Autoscaling
— Why?
— Scales only on simple metrics (cpu, memory)
— What to use instead?
— Custom autoscaling which is based on # of connections per sec
+ # of messages per sec
How we did it
Tracker
Tracker
Tracker
Monitoring agent
Periodically checks trackers' health
Tracker
Runs on node too
Launch new instances
... or terminate them if needed
The only downsiDe
IT
COSTS
MONEY!
$
$
$
CPU Profiling
Fine optimizations
Saving money + time
Setting up the profiler
var agent = require('strong-agent');
agent.metrics.startCpuProfiling();

// Run some code here

setTimeout(function() {
    var data = agent.metrics.stopCpuProfiling();
    fs.writeFileSync('./CPU-' + Date.now() + '.cpuprofile', data);
}, 1000 * 30);
Analyze over 30 seconds
JSON File
How to read
this generated data with chrome
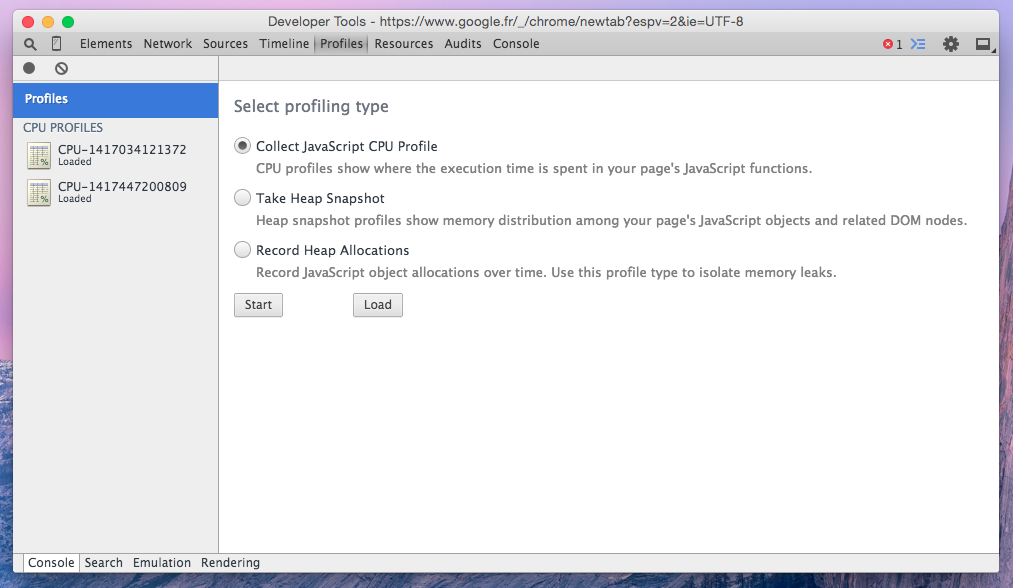
Chrome profiles
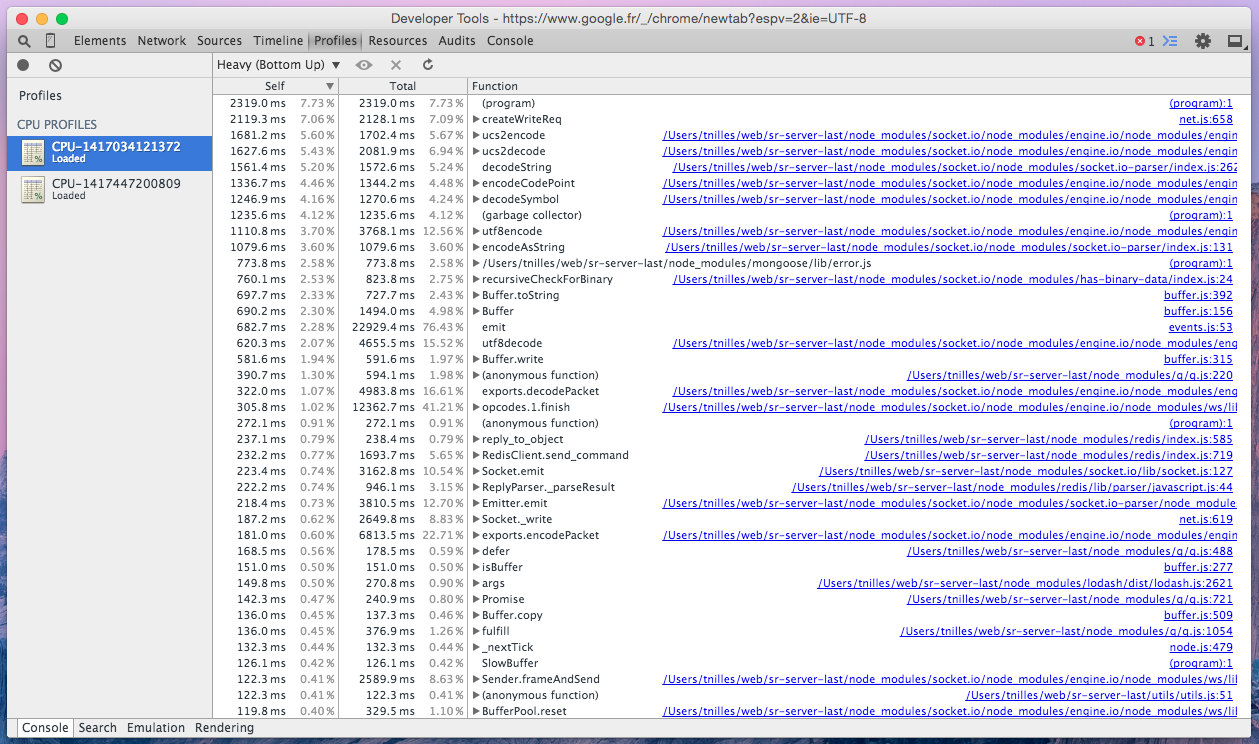
(program) = native code + Idle
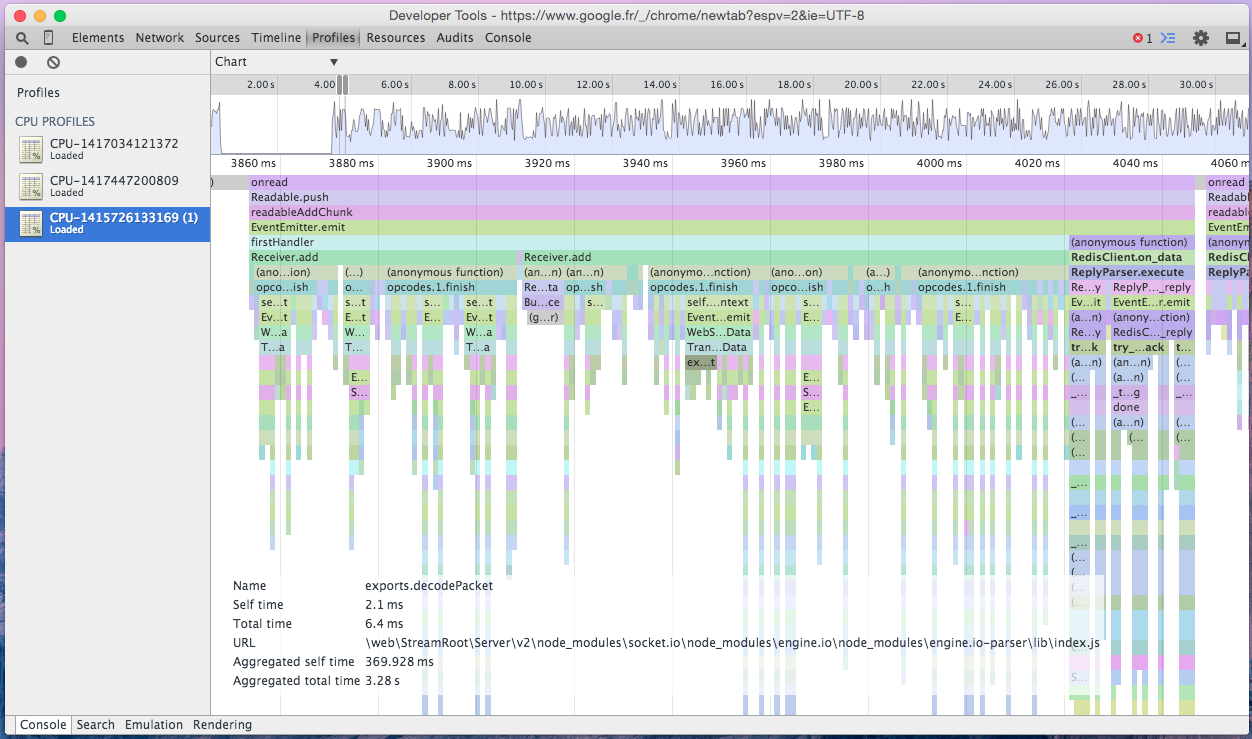
Flame chart
Testing Methodology
Wrote a client simulator
1. Configured it with the following parameters:
Number of clients to emulate: 500
Connections per sec: 3
2. Run the test with strong agent
3. Run another test increasing the # of connections per sec
4. Repeat until it starts to slow down
What takes time?
What takes time overall:
Our messages size
Is quite big
v=0
o=- 8762946660211567753 2 IN IP4 127.0.0.1
s=-
t=0 0
a=group:BUNDLE audio data
a=msid-semantic: WMS
m=audio 1 RTP/SAVPF 111 103 104 0 8 106 105 13 126
c=IN IP4 0.0.0.0
a=rtcp:1 IN IP4 0.0.0.0
a=ice-ufrag:PMG42memfIKiWttR
a=ice-pwd:GhKvhH7GxwXCISLVpcFQL4/Z
a=ice-options:google-ice
a=fingerprint:sha-256 57:6D:FB:99:A0:20:74:50:AB:56:00:90:75:0B:07:53:4E:47:C7:A5:72:6A:7B:8B:2B:32:87:E9:6D:14:F4:06
a=setup:actpass
a=mid:audio
a=extmap:1 urn:ietf:params:rtp-hdrext:ssrc-audio-level
a=extmap:3 http://www.webrtc.org/experiments/rtp-hdrext/abs-send-time
a=recvonly
a=rtcp-mux
a=rtpmap:111 opus/48000/2
...
*for each viewer, several times
Reducing
The messages size
Group the messages together
Send less data
&
Group the messages
Chrome does ICE trickling — around 12 messages
Can be grouped into one bigger message
Results
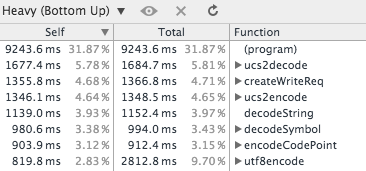
Without optimization
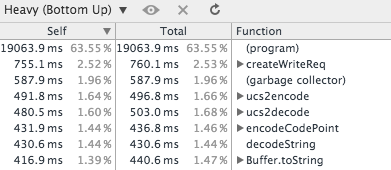
With optimization
31.87% Idle + Native
63.55% Idle + Native
Group the messages
Messages/Sec
84
168
Nice!
*On my computer
Send less data
We optimized message length
Results
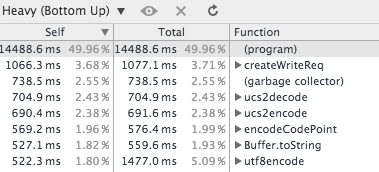
Without optimization
With optimization
31.87% Idle + Native
49.96% Idle + Native
Send less DATA
Messages/Sec
84
112
Total
Messages/Sec
84
196
*On my computer
We tried
To send binary
{
    meta: 'foo',
    data: 89,
    heavy: myBigObject
}
VS
3,308 ms
241 ms
{
    meta: 'foo',
    data: 89,
    heavy: [ArrayBuffer]
}
on ucs2encode() + ucs2decode() (used by socket.io)
Beware of local optimizations!
Results
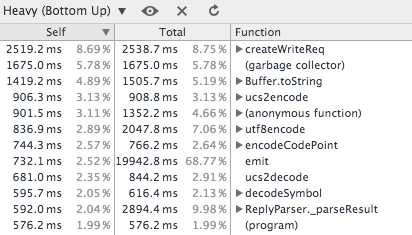
Without optimization
With "optimization"
31.87% Idle + Native
1.99% Idle + Native
Binary messages
Messages/Sec
84
84
huh?
*On my computer
Next steps
Find the next bottleneck
Clusterize by client/video/region
Optimize slow node modules
Thank you!
How to scale in node
By Thierry Nilles
How to scale in node
Slides from the December 3rd nodejs meetup in Boston