JVM GC
and
Profiling
By - Prakash Balodi
Agenda
- Intro to JVM memory Management
- Garbage collection on the JVM
- Tuning the garbage collector
- Garbage collection Myths
I Am
Independent consultant
(Clojure, FP and Linux enthusiast)
Prakash Balodi
JVM Memory Management
- JVM does automatic memory management
- The application code does not need to acquire and release native memory on its own
- A primary reason why JVM has a big Library ecosystem (Imagine mangaing memory for all the libs you use! )
JVM Memory Management - How
- JVM divides memory in Heap and Metaspace
- Objects are stored in heap
- Classes, Internal Data structures are stored in Metaspace (Permgen till JDK 1.7)
- Metaspace grows as per the required usage (No more out of Permgen space errors :D )
JVM Memory Layout
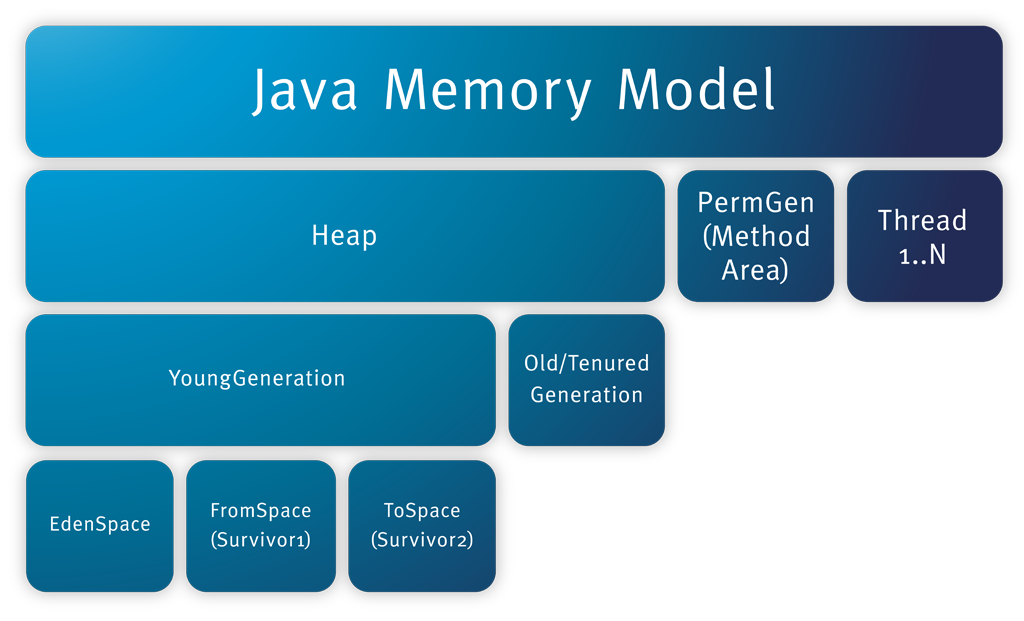
Replaced with
Metaspace now!
Garbage Collection
A Garbage collector is an important part of Automatic Memory Management in JVM
Mainly responsible for–
- Ensuring that any referenced objects remain in memory
- Recovering memory used by objects that are no longer reachable from references in executing code
Garbage Collection
True Memory leaks are not possible with Garbage collection, however not recovering Unused objects can result in -
- Poor response times
- Decrease in Throughput (Frequent GC pauses!)
- OutOfMemoryError and JVM Crashes
Garbage Collection - Key terms
- Concurrent Collector - performs GC work concurrently with the application’s execution.
- Parallel Collector - uses multiple CPUs to perform garbage collection.
- Incremental collector - performs a garbage collection operation in phases.
- Stop-the-World collector - performs garbage collection while the application is completely stopped
- Monolithic Collector - Performs Entire GC work in one go.
Generational Collection
Based on Weak Generational Hypothesis -
- Most Objects die young
- The ones that do not usually survive for a (very) long time
Generations = Separate pools for Differently aged Objects
Makes allocating new Objects and reclaiming memory pretty fast.
We can have different GC strategies for different generations.
Generational Collection in Hotspot JVM
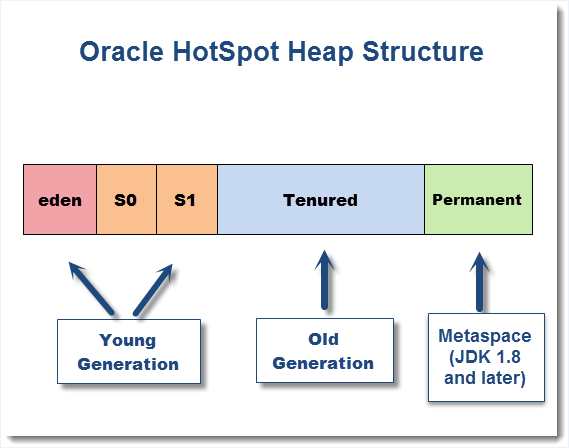
Generational Collection in Hotspot JVM
- New allocations are made in eden
- When eden is full, Objects are moved to Survivor space (S1) //Minor GC
- The cycle repeats, but next time S2 is filled with live objects of eden + S1
- Either S1 or S2 is always empty
- After several GC cycles, objects get moved to Old gen
- Old Gen is collected by Major GC
Tuning the GC
- Latency - Reducing the time for GC (Avg and Maximum GC pause times)
- Throughput - Percentage of time available to the application for execution
- Footprint - Tuning for the amount of memory used.
GC can be tuned for -
Known as Performance triangle, tuning one will effect the other, so set your goals first.
Tuning the GC
Enable GC information logs -
-XX:+PrintGCDetails -XX:+PrintGCDateStamps -XX:+PrintGCTimeStamps

-XX:PrintHeapAtGC -XX:PrintTenuringDistribution
Adjust the ratio between New and Old generations -
-XX:NewRatio (e.g. -XX:NewRatio=3 means ratio between the young and old gen is 1:3)Tuning the GC
- The bigger the younger generation, less often the garbage collection will happen.
- But should never be greater than the old space.
- For scaling a stateless request model - consider increasing younger generation size.
Tuning the GC
- Age of objects should be inversely proportional to the number of objects in that age.
- If your old generation space is increasing linearly. it may indicate a memory leak!
- Always Start by tuning the younger generation first
- Keep an eye on Survivor sizes
Common GC Myths
- Explicitly Setting references to NULL helps GC
- reality - No need, GC algos are smart enough
- System.gc() is okay to use
- reality - bad idea, can be bad for performance
- Creating New objects is expensive on JVM
- reality - Very fast, and cheap.
- Finalizers ~= Destructors
- Should only be used for JNI scenarios
- Release all resources in finally
Common GC Myths
- Minor GCs are not Stop the world Collections
- reality - All Minor GCs are stop the world. They however should take much less time than a Stop the world Major/Full GC.
Profiling
Profiling involves monitoring the JVM and getting insights about the application data
Different approaches for profiling -
- Sampling - Get Metrics at sample intervals
- Instrumentation - Insert Profiling code between the application code
Thanks!
- Java Performance - https://www.amazon.com/Java-Performance-Charlie-Hunt/dp/0137142528
- Understanding Java GC - https://youtu.be/Uj1_4shgXpk
- JVM GC Monitoring and tuning - https://www.slideshare.net/caroljmcdonald/java-garbage-collection-monitoring-and-tuning
-
Everything I Ever Learned About JVM Performance Tuning at Twitter - https://youtu.be/8wHx31mvSLY
JVM profiling and GC
By Prakash Balodi
JVM profiling and GC
Techfluence 2018


