ShipViz
Raquel Alegre
RSDG meeting, 2nd April 2019

ShipViz - Project overview
- RSDT 2015
- Shipping Group @ Energy Institute (The Bartlett Faculty of the Built Environment)
- Funder: European Climate Foundation
- Research on the behaviour of the maritime transport sector, including:
- Response to policy changes
- Identification of transport routes
- Environmental impact (GHG emission)
- Communication of outputs to the general public
- Technologies used: Carto, PostGIS, Python, JavaScript
ShipViz - Background
GHG and air pollutants from shipping constitute a significant proportion of global emissions:
- 2.2% of CO2 (carbon dioxide)
- 13% of NOx (nitrogen oxides)
- 12% of SOx (sulphur oxides)
These pose a serious threat to human health and the environment
IMO introduced in Aug 2012 "Regulations for the prevention of air pollution from ships" for ships equal or above 400 gross tonnage
- No explicit monitoring to observe results of policies in place
- Lack of evidence-based studies

ShipViz - Sample use case
The International Maritime Organisation introduced in 2012 a regulation for GHG Emission Control Areas (ECAs)
Identify the number of ships affected by these regulations and their effectiveness by analysing the speed, movement and type of ships sailing through them.
Data sources:
-
Dynamic Automatic Identification System (AIS) for collision avoidance and security
-
Station information (band, altitute sensor, channel, bandwidth, data length, ...)
- Message information (date, time, device, ...)
- Positional data (lat, lon, navigation status, maneuver, ...)
- CSV format
-
ShipViz data
Data sources:
- Static vessel information from a fleet register:
- Vessel information (draught, imo, mmsi, mother ship, vessel name, ...)
- Ship type information:
- passenger ship, fishing vessel, high speed craft...
- oil tanker, bulk carrier, cargo ship, offshore drilling unit, ...
- CSV format
ShipViz data

Data sources:
-
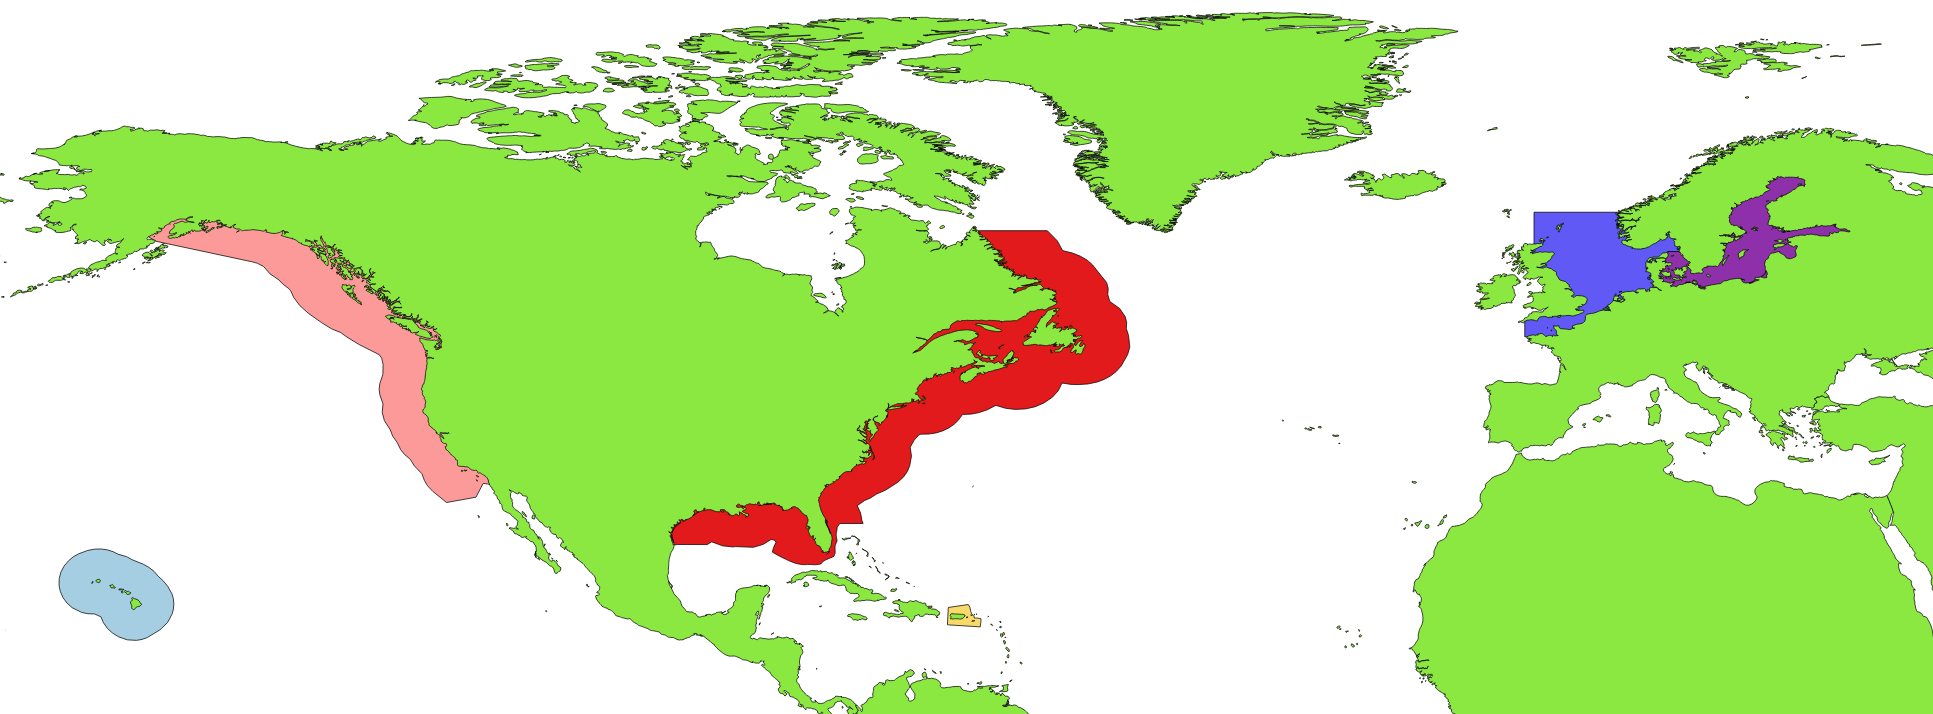
Maritime Policy data:
- Emission Control Areas
- List of (lat, lon) values describing the outer shape of the area ...
ShipViz data

on a series of PDF files!!!

ShipViz data
What made the data difficult to deal with:
- Highly sensitive data - license allowed data to be stored only at UCL premises and for internal use only
- Big volumes of data - one entry every second for every registered vessel throughout a whole year
- Geographical data - lat/lon coordinates
- PDF format and descriptions of ECAs in text format
What they needed from us
-
Develop a visualisation tool for ingestion, manipulation, analysis and visualization of geo-temporal data
- Time slider / animation capabilities
- Filtering options (type of vessel, type of fuel, area, ...)
- Interactive and responsive
- Import / Export data (CSV, KML, SHP...)
- Secure due to data provider restrictions
- Easy for the Shipping Group to maintain and build on top
- Produces nice visualisations to inform their community
- Input SQL queries
- ... All these to be completed in around 30 days of work
RSDG work on ShipViz
ShipViz codebase
- Some Python and MATLAB tools for data analysis and visualisation
- Didn't deal with geo-temporal data
- Only worked with a small amount of data
- Time consuming: ingest + extract + process + plot
- Required some software development skills
- Some but limited SQL expertise in the team
ShipViz codebase
-
PostgreSQL
- Open Source relational database
- Several hundreds of millions of data points
- Treats latitudes and longitudes as doubles
- A standard ShipViz query took around 60 minutes
- Team considering moving to Neo4j to speed up
RSDG work - Database
-
PostGIS
- Spatial database extension for PostgreSQL
- Adds spatial indexing
- R-trees
- Adds support for spatial data types
- Point, Line, Polygon...
- Adds support for reprojections
- Extends PostgreSQL with geo-queries:

- A standard ShipViz query takes now around 5 minutes!!
-
PostGIS - Indexing with R-trees
- Groups nearby objects and represent them with their minimum bounding rectangle


-
PostGIS - Indexing with R-trees
- Groups nearby objects and represent them with their minimum bounding rectangle


RSDG work - GIS tools
- PostGIS + QGIS

- Open Source
- Plugins can be developed in Python to add functionality
- Good performance with large dataset
- But: very limited temporal visualisation
RSDG work - GIS tools
- PostGIS + GeoServer/Mapserver + OpenLayers/Leaflet
- Traditional solution, but:

- Tricky to make it performant with so much data
- ... All the Javascript
- Not enough time to develop all requirements
RSDG work - GIS tools
-
ESRI GIS / ArcGIS
-
Non-Open Source
- Next!
-
Non-Open Source
RSDG work - GIS tools
- PostGIS + MapBox + TileMill
- Good performance with large amounts of data
- Out of the box solution
- Ticks some requirements with no extra work

- However:
- Unstable release at the time
- Focus on tiling design, not so much interaction with data
- No temporal data animation at the time
RSDG work - GIS tools
- PostGIS + GeoServer + WebGL
RSDG work - GIS tools
-
Carto
- Out of the box solution that ticked most requirements
- However:
- Data security requirements not met since data would be save in the cloud
- Standard online version only allows up to 250MB of data for free
- Luckily:
- Since it's Open Source, you can install the full stack of Carto locally as well!
RSDG work - Carto

- DB + Server + Client traditional GIS application architecture
- Can be used:
- Online with limitations
- Local full stack - (almost) no limitations
- Can be used as a unit or in bits:
- Carto python/R/Java libraries to connect with Carto's PostGIS DB
- D3/Plotly/ChartJS can visualise Carto data
- Set up and run instance of Carto with restricted access at Energy Institute's premises

- Set up and run instance of Carto with restricted access at Energy Institute's premises
-
Ingest all data in PostGIS:
- Point data is straight forward
- ECAs were challenging: PDF -> Shapefile -> GML Polygon data -> PostGIS, remove continent shapes, add buffer areas

SELECT cartodb_id,
ST_Transform(ST_Buffer(the_geom,1), 3857) as the_geom_webmercator
FROM ecas_no_continent
- Set up and run instance of Carto with restricted access at Energy Institute's premises
- Ingest all data in PostGIS:
- Point data is straight forward
- ECAs were challenging: PDF -> Shapefile -> GML Polygon data -> PostGIS
-
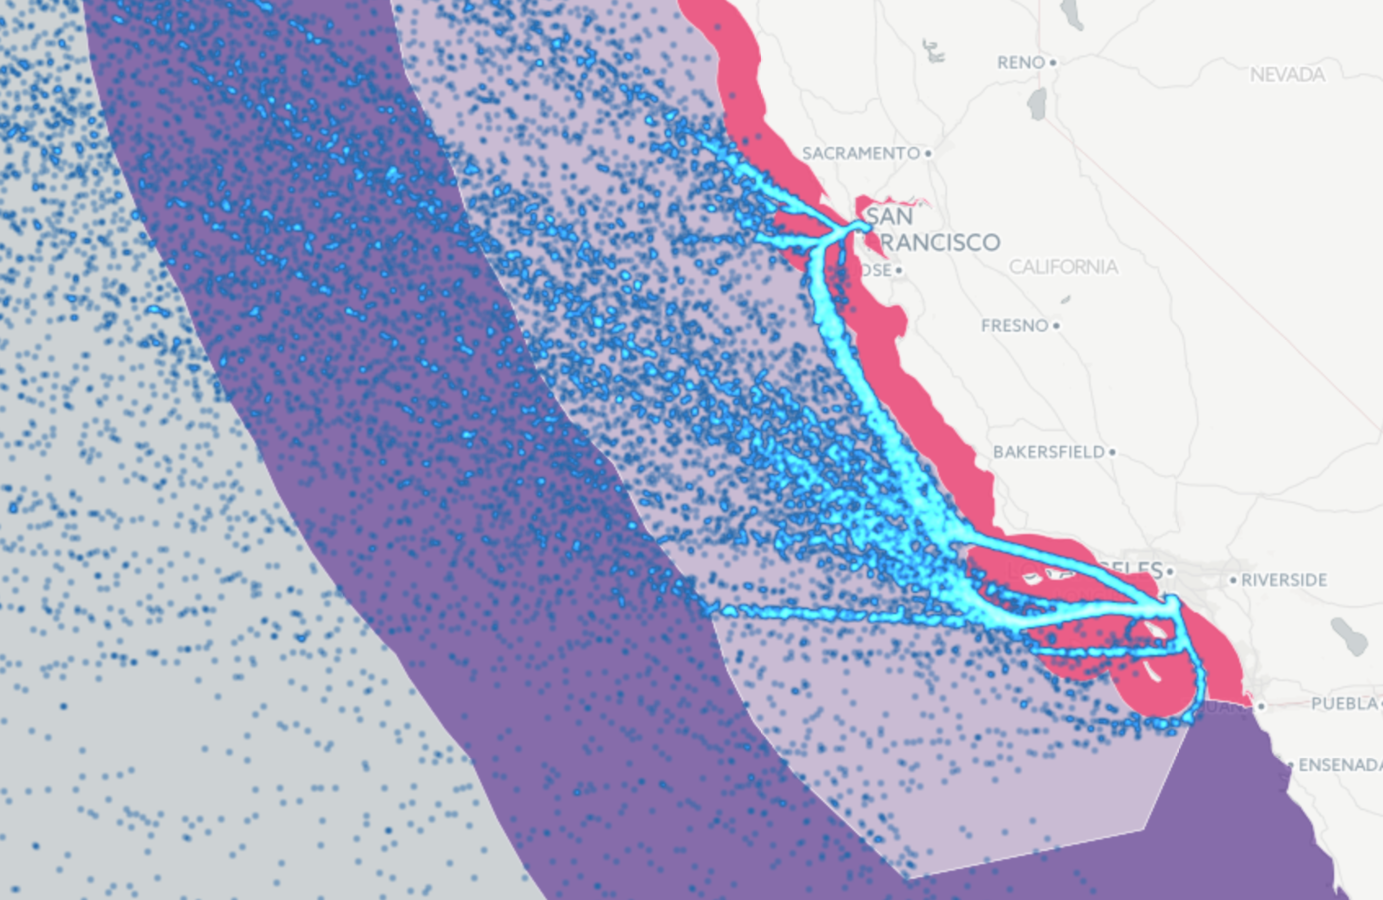
Resample data hourly and select messages where:
- produced by relevant ship types
- content is not noisy
- vessel crossed ECAs borders

20% data points in CartoDB

400K points: ~1% of the data points in CartoDB
- Set up and run instance of Carto with restricted access at Energy Institute's premises
- Ingest all data in PostGIS:
- Point data is straight forward
- ECAs were challenging: PDF -> Shapefile -> GML Polygon data -> PostGIS
- Resample data hourly and select messages where:
- produced by relevant ship types
- content is not noisy
- vessel crossed ECAs borders
- Calculate speed for each vessel before and after crossing the ECAs borders
- Compute average relative difference before and after ECA regulation was in place (i.e. Jan-Jul vs Aug-Dec)
- Categorise vessels by size and analyse results
Demo!
Were Emission Control Areas effective?


Conclusion
- The Carto instance was running during and beyond the life of the project at a server installed at the Energy Institute
- However...
- Paper published in 2016 with RSDG as co-authors
- Good reputation brought more income from the Energy Institute in 2017 (GloTraM) and 2018/2019 (Veda-TMC).

The End
ShipViz work
By Raquel Alegre
ShipViz work
Presentation about work done on ShipViz (Energy Institute) by Raquel Alegre for one of the events at the series of UCL's Technical Socials - March 2016


