Where Have All the Prospects Gone?
Rich Majerus

View slides on your device: https://goo.gl/2DUJCb
Fundraising Work is Spatial
How do you work with spatial data?
Alumni Relations:
We are planning an event in Boston. Can we get a list of all of our rated prospects there?
New Major Gifts Director:
I want to realign our team's portfolios. How are our prospects distributed across the country?
Major Gift Officer:
I'm in L.A. and need an extra visit or two. Who should I reach out to?

# load leaflet library
library(leaflet)

# initialize html widget
# add default map tile
leaflet() %>%
    addTiles()
# load tidyverse
library(tidyverse)

# load ipeds data on all four-year colleges
colleges <- read_csv("https://raw.githubusercontent.com/majerus/NEDRA2018/master/four_year_colleges_2017.csv")

# load leaflet library
library(leaflet)

# pipe college data into chain of R functions
colleges %>%
  # initialize htmlwidget
  leaflet() %>%
  # add map tile
  addTiles() %>%
  # add circles to mark the location of each four-year college
  addCircleMarkers()
colleges %>%
  leaflet() %>%
  addTiles() %>%
  addCircleMarkers(
    # add college names as labels that appear on hover
    label = ~institution.name,
    # cluster markers
    clusterOptions = markerClusterOptions())
library(ggmap)
geocode("Colby College")
Information from URL:
http://maps.googleapis.com/maps/api/geocode/json?address=Colby%20College&sensor=false

       lon      lat
 -69.66264 44.56387
lon             lat
-69.66264       44.56387

type            address
establishment   4000 mayflower hill dr, waterville, me 04901, usa

level_2         level_1
Kennebec County Maine

country         postal_code
United States   04901
geocode(location = "Colby College",
output = "more",
source = "google")
leaflet() %>%
  addTiles() %>%
  addPopups(lng = -69.66264,
            lat = 44.56387,
            popup = "Colby College!")
Unlocking our Data
with Visualization

Source Data for Visualization
Same Data Served Data Shared Data


Approach #1: Same Data
Approach #2: Served Data


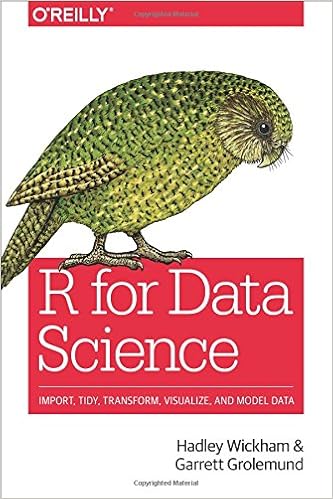
R is a free open-source statistical software.
RStudio is an interface to using R.

Shiny transforms R code into web applications
How this works...
Data
Application Code
Place to deploy apps
What you will need...
Database
Data warehouse
Excel, json, csv, etc.
User interface code
Server code
Shinyapps.io
Open source server
Professional server
RStudio Connect
Approach #3: Shared Data
Approach #3: Shared Data
- Linked interactive visualizations
- Filtering and personalization capability
- No server required
Where to go from here...


Rich Majerus
www.richmajerus.com
rmajerus@colby.edu
@richmajerus
Credits
Madebyoliver from Flaticon licensed by Creative Commons BY 3.0
smashicons from Flaticon licensed by Creative Commons BY 3.0
Freepik from Flaticon licensed by Creative Commons BY 3.0
Freepik from Flaticon licensed by Creative Commons BY 3.0
Dave Gandy from Flaticon licensed by Creative Commons BY 3.0
smashicons from Flaticon licensed by Creative Commons BY 3.0
photos from unsplash.com
Where Have All the Prospects Gone?
By Rich Majerus


