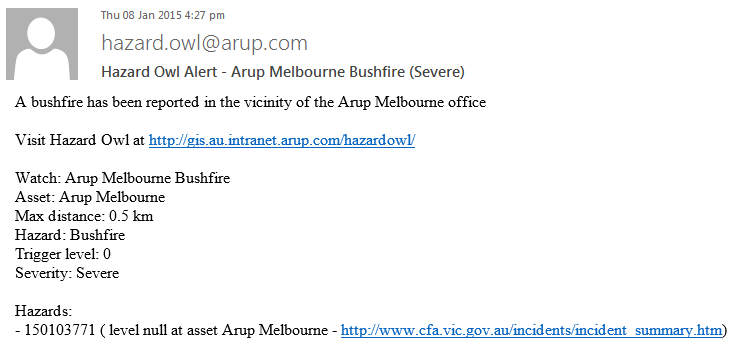
Hazard Owl
Watching assets for the
impact of natural hazards
Roland Martin
Senior GIS Consultant
Arup

Coming up...
- What's a hazard?
- Why do they matter?
- What can we do about them?
- What's the Hazard Owl?
- How does the front end work?
- How does the back end work?
smokeybear.com
- A global, integrated, multidisciplinary firm of professionals working together to tackle complex planning, infrastructure and building design challenges
- 11,000 engineers, designers, planners, management consultants and economists
- 90 offices in 37 countries
- Full service from concept through completion
- Dedicated to delivering value through expertise, global resources and local delivery


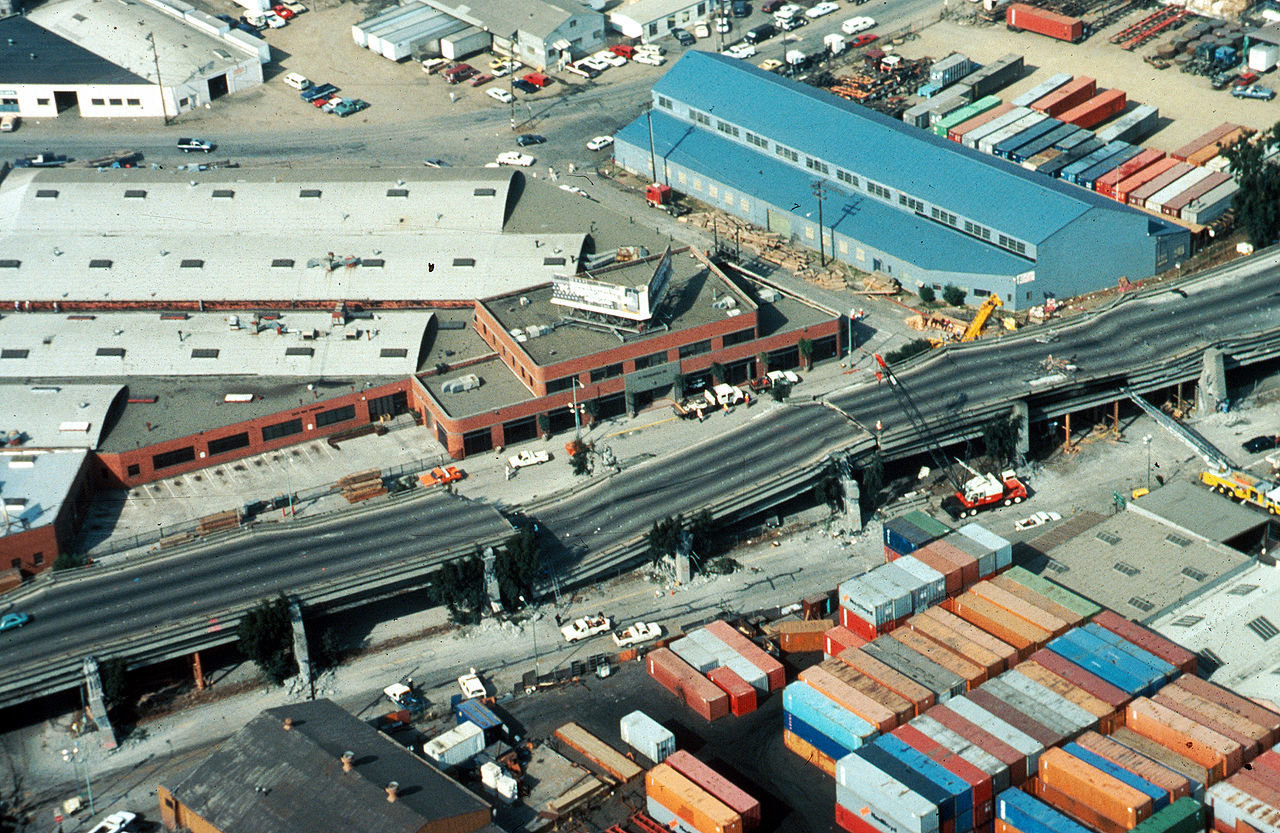
Everything we work on - whether a building, a bridge, a railway or an airport - must meet particular standards for seismic design.
USGS
Wikipedia
How do we manage our response?
What is a natural hazard?
But first...
What is a natural hazard?
Earthquake
Tsunami
Volcano
Hurricane / Cyclone / Typhoon
Bushfire
Flood
Storm
What makes it a natural hazard?
Extreme event + People
=
Natural hazard
We can't prevent natural hazards
But we can...
- Reduce their impacts
- Plan ahead and be prepared
- Recover more quickly
Risk
=
Hazard
x
Vulnerability
x
Consequences
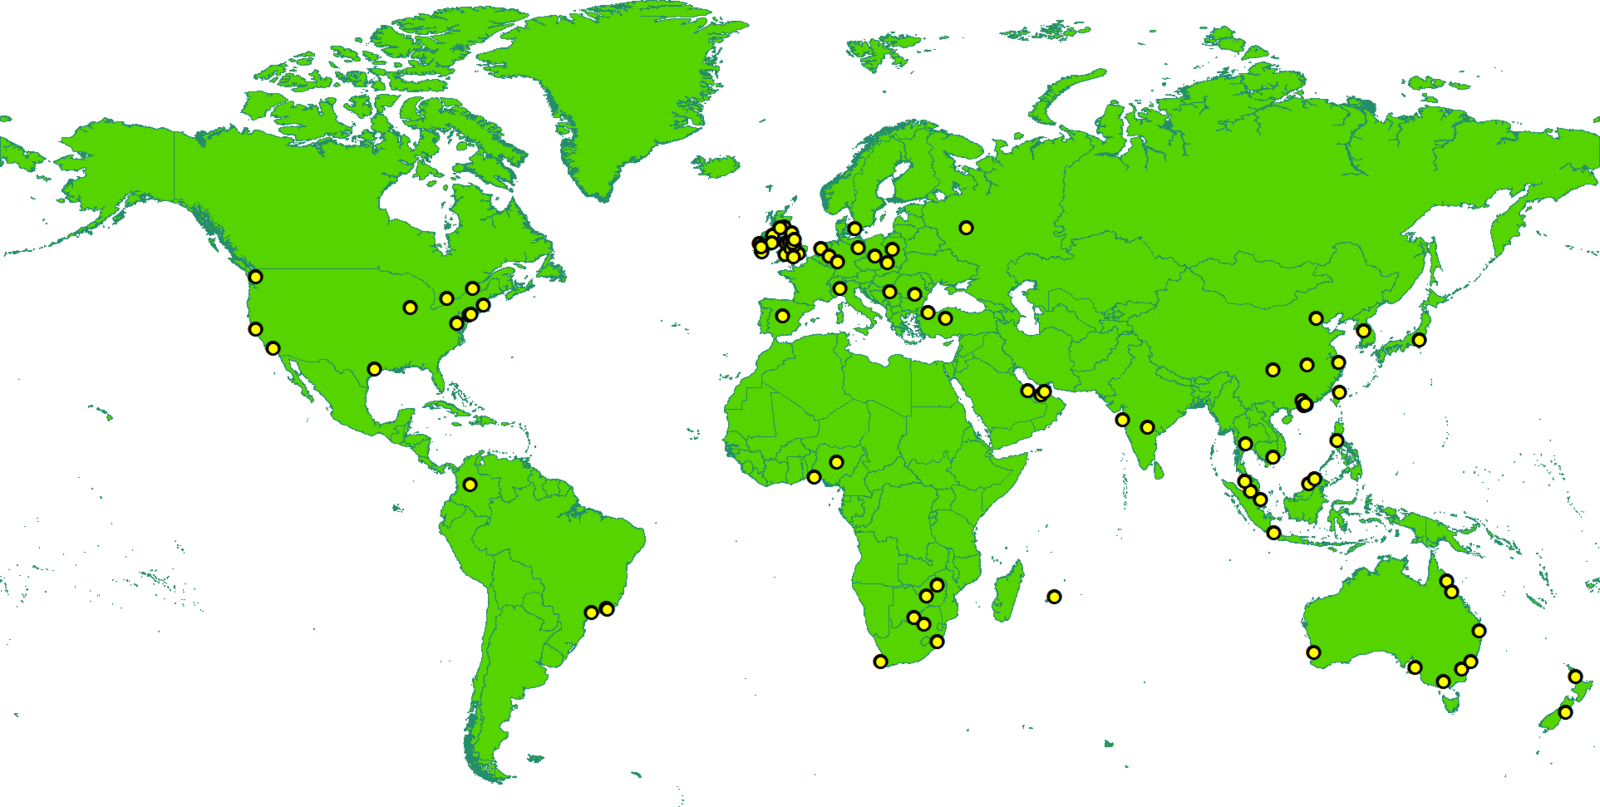
Data Feeds
Data Feeds
- Bushfires
- NASA (MODIS)
- New South Wales Rural Fire Service
- Queensland Rural Fire Service
- South Australian Country Fire Service
- Tasmania Fire Service
- Victoria Country Fire Service
Data Feeds
- Earthquakes
- British Geological Survey
- EMSC-CSEM
- Geoscience Australia
- GNS Science - Te Pü Ao (New Zealand)
- Incorporated Research Institutions for Seismology
- Natural Resources Canada
- USGS Shakemap
Data Feeds
- Tropical Cyclones, Hurricanes, and Typhoons
- Joint Typhoon Warning Center
- National Hurricane Center
- Tropical Weather Forecasts (National Weather Service)
- Tsunamis (National Weather Service)
- Volcanoes (Smithsonian Institution)
The system typically registers betwen 5,000 and 10,000 hazards worldwide at any given time
That's roughly one and a half million hazards every year
Some feeds are easy to read
- GeoRSS
- Clean KML
- Esri Shapefile
Others present greater challenges
- Raw HTML
- Dirty KML
- Complex APIs
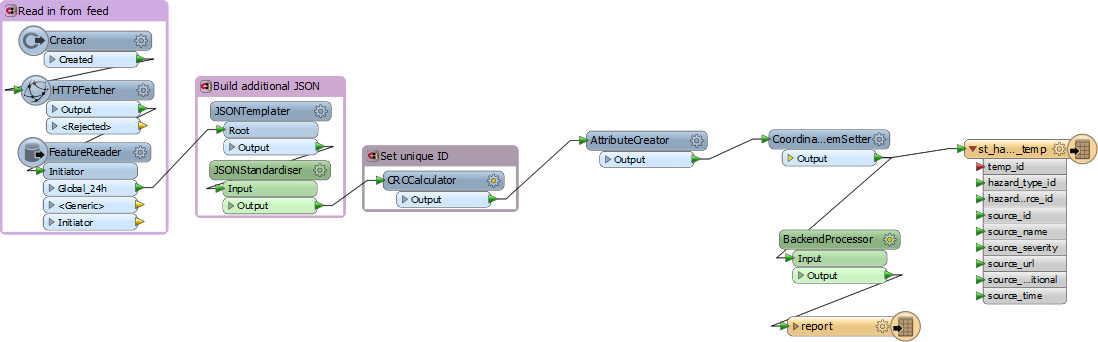
FME Server
What is FME?
-
Spatial ETL tool
-
Reads and writes hundreds of spatial and non-spatial data types
-
Enables almost unlimited combinations of data transformation
-
Simple, intuitive interface which requires no coding
Why use it for Hazard Owl?
-
Handles all relevant data types (GeoRSS, shapefile, KML, plain text, PostGIS)
-
Reliable, with a strong user base
-
Simple interface for building complex processes
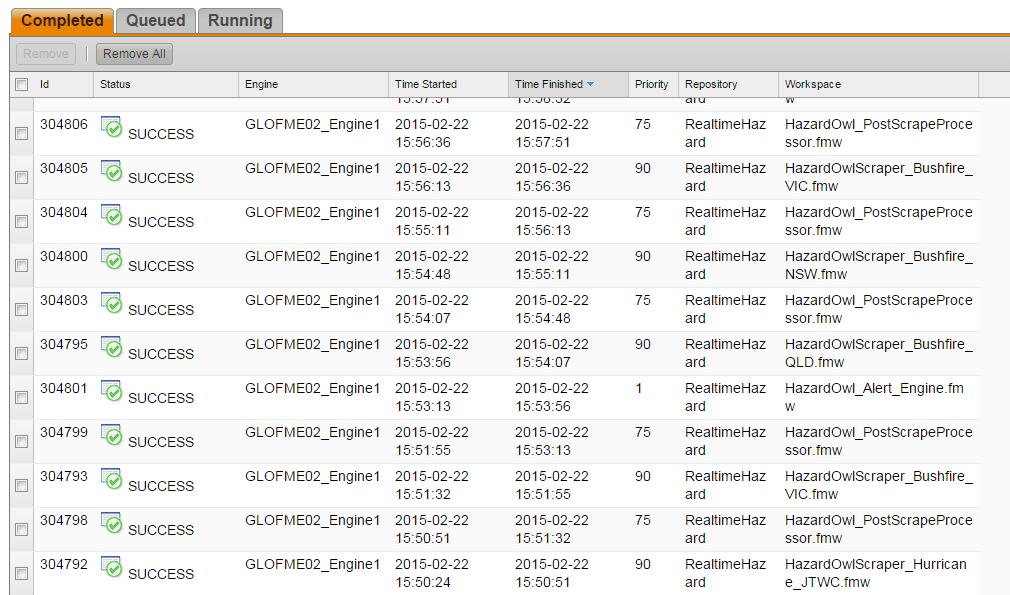
FME Server
-
Web-based interface for FME
-
Allows workspaces to be scheduled
-
Includes simple email tools
The database
Why PostGIS?
-
Speed and simplicity
-
The JSON data type, allowing you to build a semi-structured database
-
Functions for generating GeoJSON from queries
Database Elements
-
Hazards - reported hazard events from incoming feeds
- Type - i.e. "earthquake", "bushfire", etc
- Source - i.e. "USGS", "CGS", etc
- Parameter - i.e. "magnitude at source"
-
Assets - locations we're interested in
- Type - i.e. "office", "bridge", etc
- Watches - which hazards to watch near assets
-
Triggers - different levels at which alerts are triggered by watches
- Alert level - i.e. "moderate", "danger!"
-
Alerts - watches which have gone above a trigger level
- Alert emails - emails which have been sent to users
Database Schema
Assets
Watches
Triggers
1:M
1:M
Hazards
Alerts
1:M
1:M
1:M
Database API
- Uses a custom web API, developed using PHP
- Calls are similar to:
var url = 'api/query.php?action=get_hazards&hazard_type=1';

$.post("api/submit.php?action=add_watch", $('#form').serialize())
.done(function(data) {
    if (data == 1)
	map.closePopup();
});
Leaflet
Why Leaflet?
- Simple, generally intuitive interface for users
- Fast, free of unnecessary clutter
- Performs well with large datasets
- Easily extensible
Tilestache
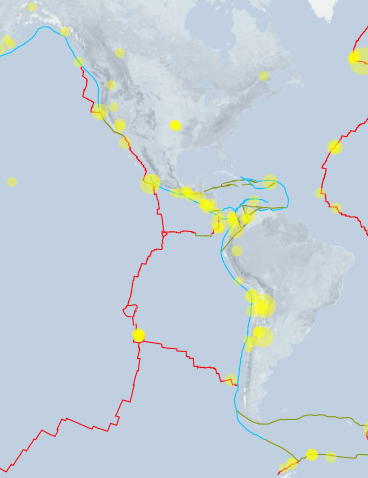
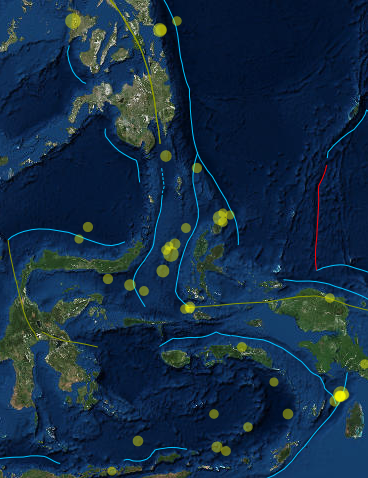
Seismic Plate Boundaries
- Data doesn't change regularly
- Symbolized based on plate type
- Displayed as tiled raster base layer using Tilestache
Tilestache
- Open source technology similar to Mapbox
- Dynamically generates and caches basemap tiles
- Very fast and simple to use
- Enables you to generate basemap tiles without paying for a subscription or uploading data
- Fiddly to set up on Apache for Windows
Watching hazards
Adding assets, watches, and triggers
Users cannot add hazards or alerts
Watches can be added by clicking the "watch for hazards at this location" button. Triggers are added using the same form
Assets can be added using the digitizing tools in the map interface
What happens then?
1. A hazard approaches an asset
2. If there is a watch in place for that hazard and asset, the severity is compared against the triggers
3. If a trigger level is exceeded, an alert is generated, and sent via email to the user
What happens then?
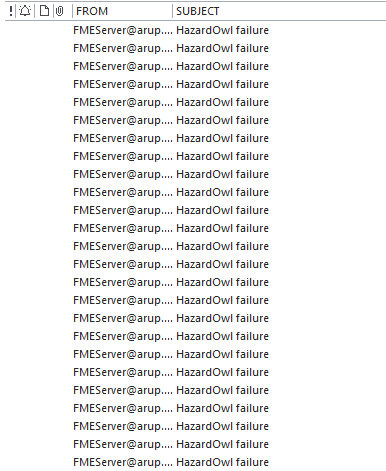
All systems fail occasionally
We set up FME Server to email us automatically if anything goes wrong - for instance if a server is unexpectedly turned off for maintenance.
Still to be added...
- Proper design
- More basemap layers
- Interface to add new assets
- Administration interface
- Ability to "play back" hazards
- ...
What we've seen...
- What's a hazard?
- Why do they matter?
- What can we do about them?
- What's the Hazard Owl?
- How does the front end work?
- How does the back end work?
smokeybear.com
Thank you!
roland.martin@arup.com
Hazard Owl
By rollo