
Use cases for multiagent simulation in passenger and freight transport
Sebastian Hörl
10 May 2023
CentraleSupélec
IRT SystemX
- Research institute situated in Paris
- Focus on fostering digital transition in a range of fields from transport, cybersecurity to circular economy
- Transferring research results and tools into active application by development and provision of industry platforms
- Various collaborative projects with multiple French companies (Renault, SNCF, ...) and academic partners (Université Paris Saclay, CentraleSupélec, Université Gustave Eiffel)
- Participation in European projects
MATSim @ IRT SystemX
- On-demand mobility simulation
- First/last mile mobility simulation
Passenger transport
Freight transport
- First/last mile delivery
- VRP Solvers
- Development of electric VRP for JSprit

http://www.loc.gov/pictures/item/2016800172/
The street in 1900
The street today
https://commons.wikimedia.org/wiki/File:Atlanta_75.85.jpg
- Autonomous Mobility
- Mobility as a Service
- Mobility on Demand
- Electrification
- Aerial Mobility
Julius Bär / Farner
The street of tomorrow?
I. Transport simulation
Classic transport planning
- Zones
- Flows
- Peak hours
- User groups
Aggregated
Agent-based models


0:00 - 8:00
08:30 - 17:00
17:30 - 0:00
0:00 - 9:00
10:00 - 17:30
17:45 - 21:00
22:00 - 0:00


- Discrete locations
- Individual travelers
- Individual behaviour
- Whole day analysis
Disaggregated
Icons on this and following slides: https://fontawesome.com
MATSim


- Flexible, extensible and well-tested open-source transport simulation framework
- Used by many research groups and companies all over the world
- Extensions for parking behaviour, signal control, location choice, freight, ...
matsim-org/matsim-libs


MATSim
Synthetic demand
MATSim
Mobility simulation
Synthetic demand
MATSim
Decision-making
10:00 - 17:30
17:45 - 21:00
22:00 - 0:00
Mobility simulation
Synthetic demand
MATSim
Decision-making
Mobility simulation
Synthetic demand
MATSim
Decision-making
Mobility simulation
Analysis
Synthetic demand
Scenarios
https://pixabay.com/en/zurich-historic-center-churches-933732/
II. AMoD in Zurich
Cost structures?
User preferences?
System impact?
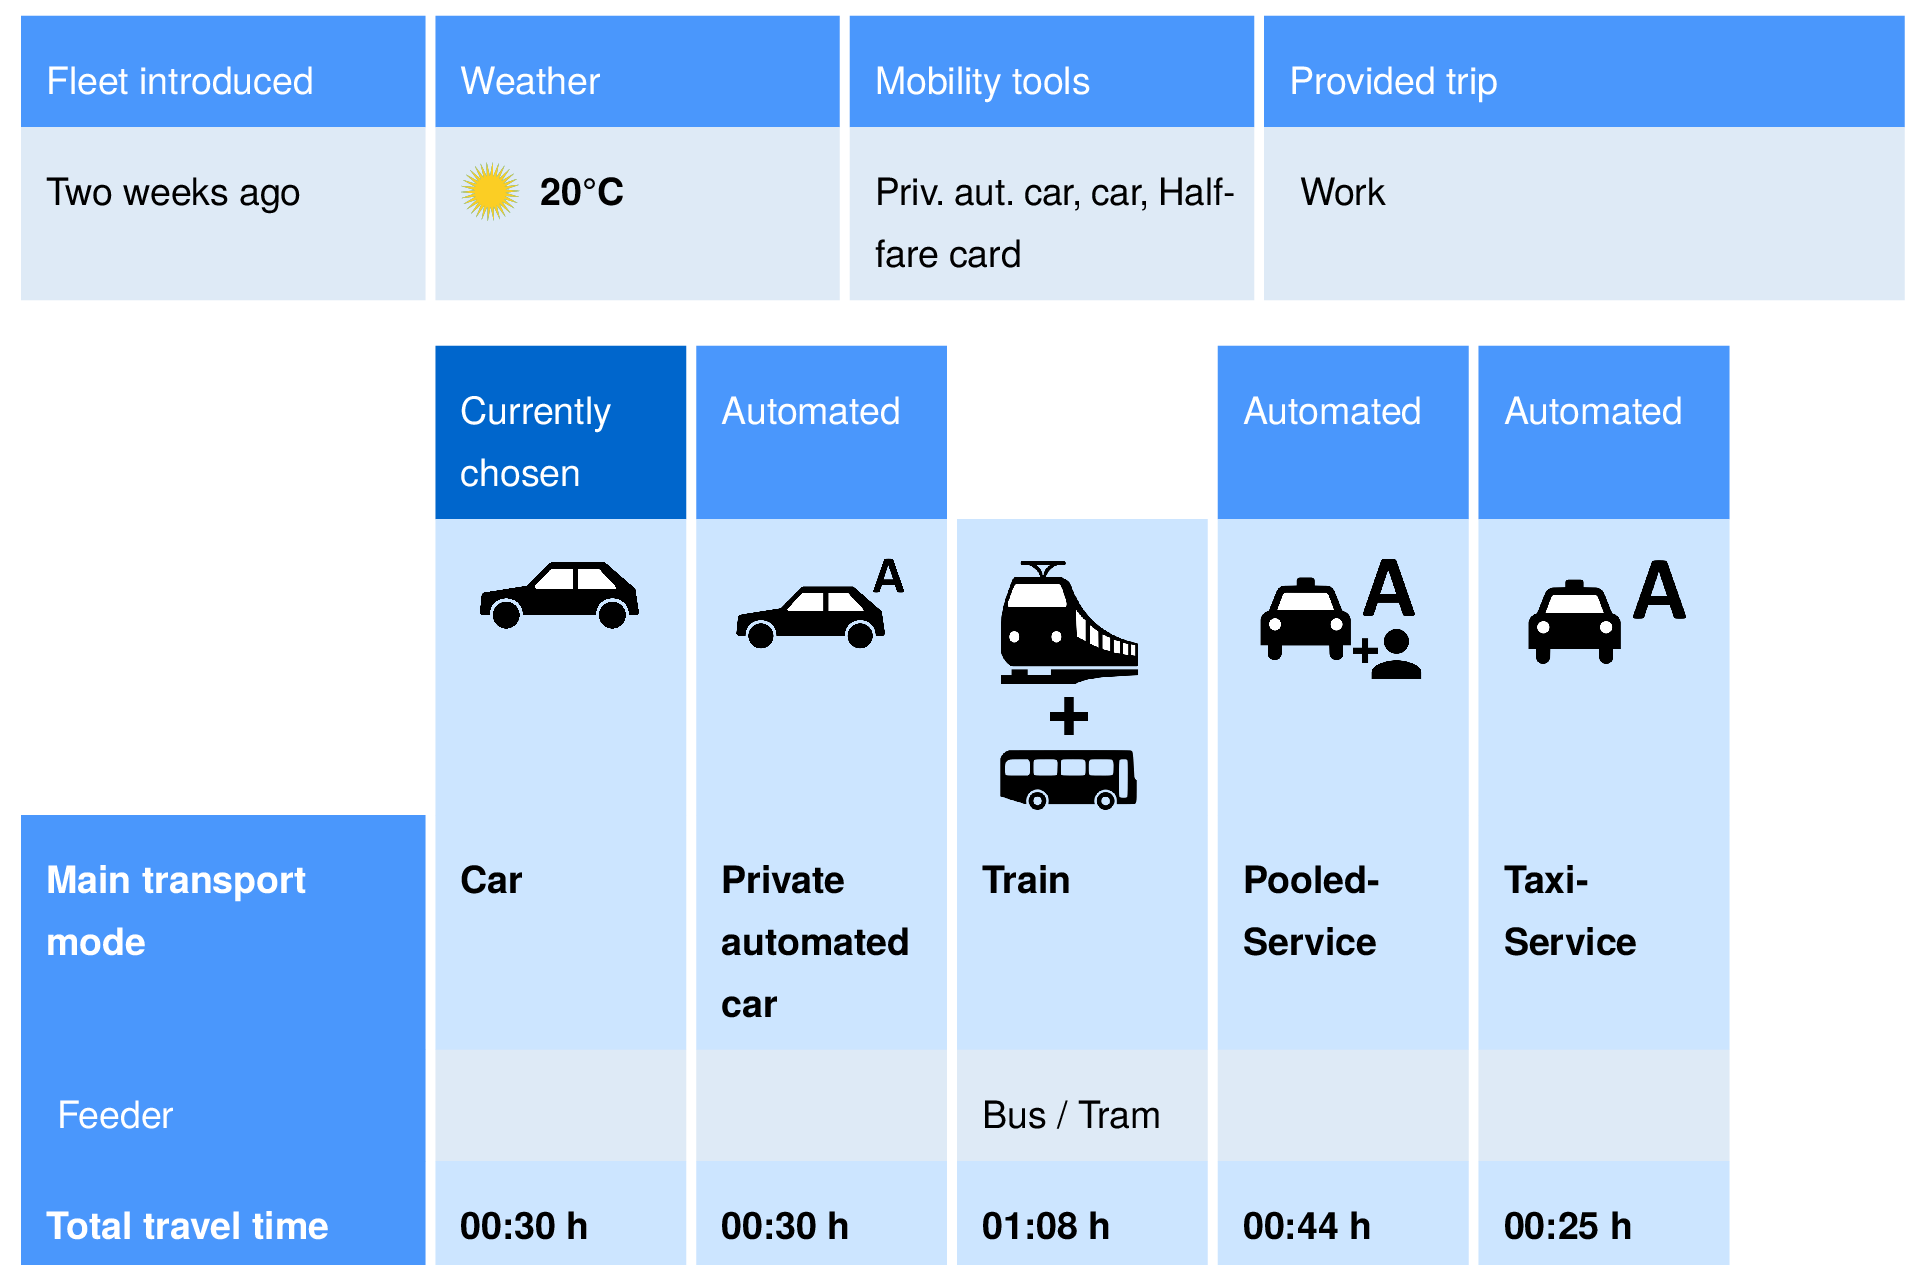
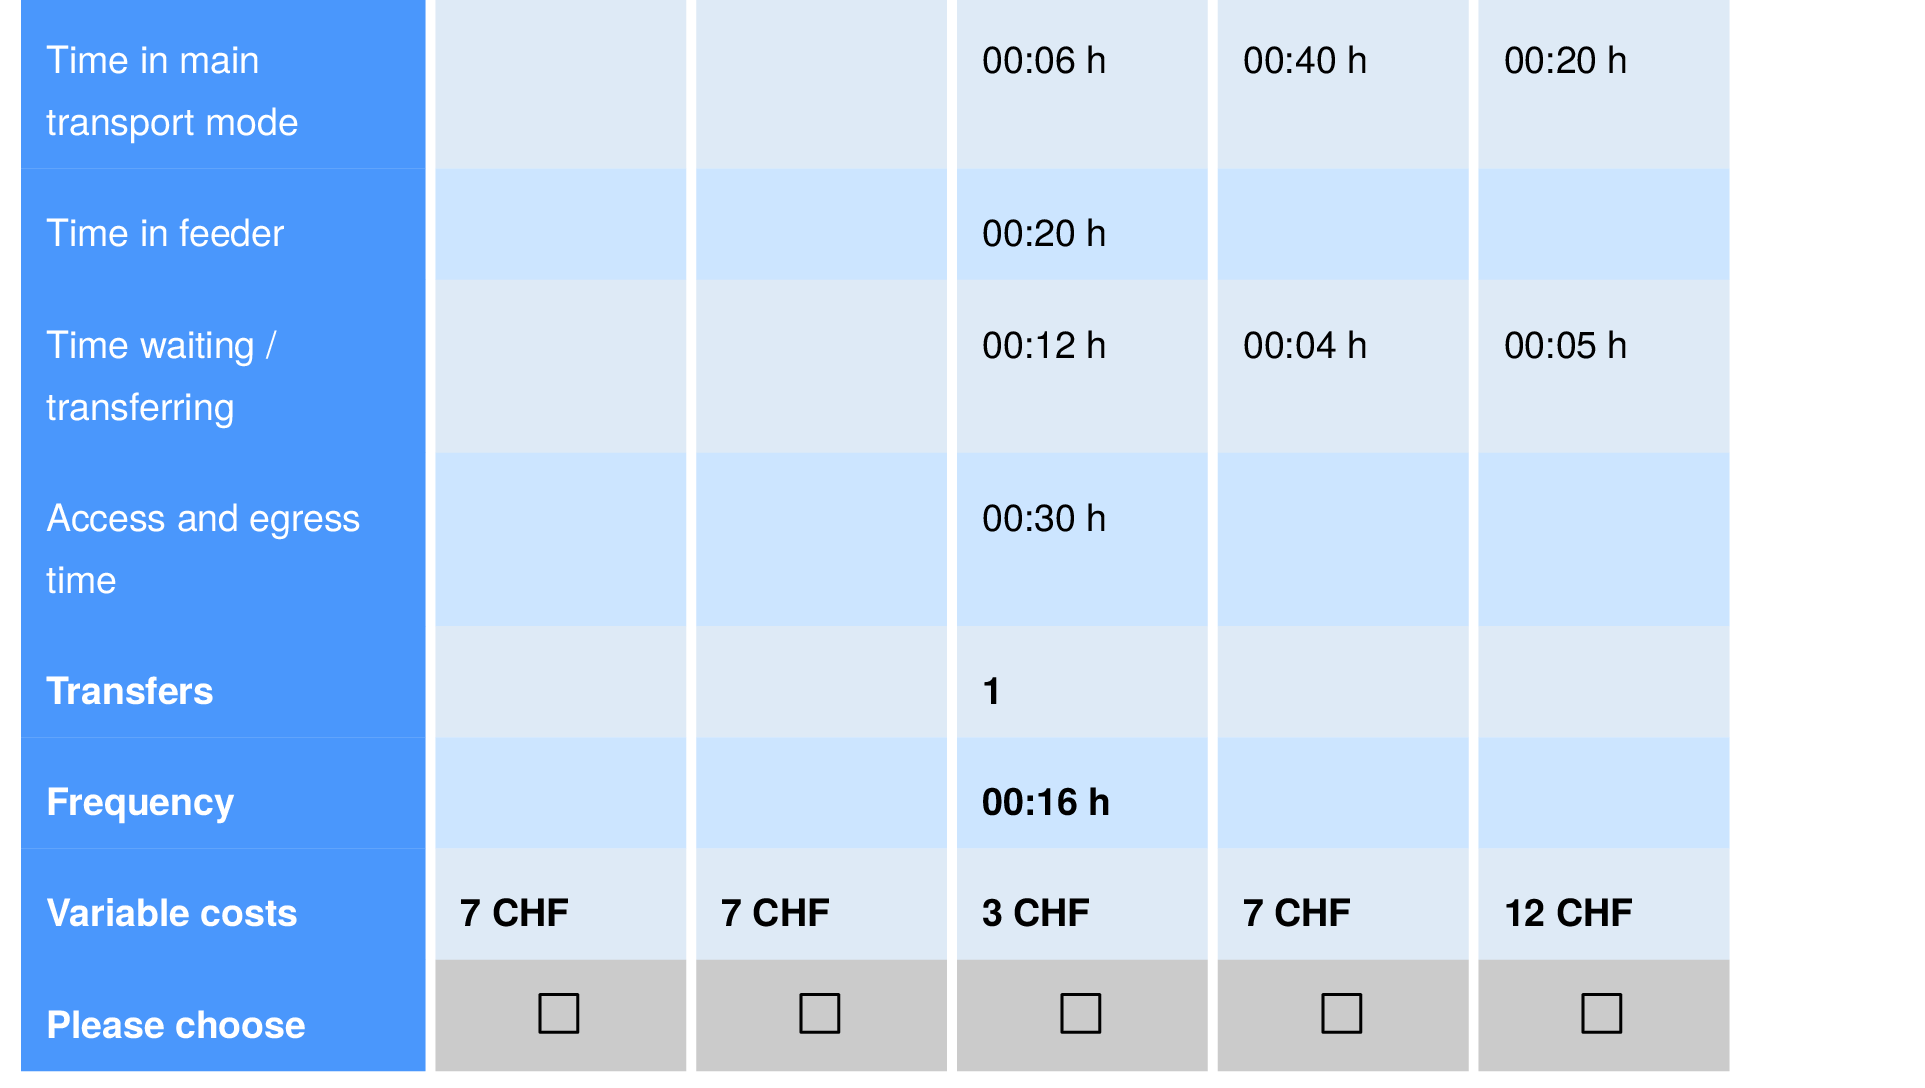
Cost Calculator for automated mobility
Stated preference survey
MATSim simulation
1
2
3
What do we know about automated taxis?
What do we know about automated taxis?

Bösch, P.M., F. Becker, H. Becker and K.W. Axhausen (2018) Cost-based analysis of autonomous mobility services, Transport Policy, 64, 76-91
What do we know about automated taxis?
Felix Becker, Institute for Transport Planning and Systems, ETH Zurich.
VTTS


13 CHF/h
AMoD
Taxi
19 CHF/h
Conventional
Car
12 CHF/h
Public
Transport
AMoD
Car by Adrien Coquet from the Noun Project
Bus by Simon Farkas from the Noun Project
Wait by ibrandify from the Noun Project
VTTS
13 CHF/h
AMoD
Taxi
19 CHF/h
Conventional
Car
12 CHF/h
Public
Transport

21 CHF/h
32 CHF/h
AMoD
Car by Adrien Coquet from the Noun Project
Bus by Simon Farkas from the Noun Project
Wait by ibrandify from the Noun Project
Model structure
Cost calculator
Plan modification
Discrete Mode Choice Extension
Mobility simulation
Prediction
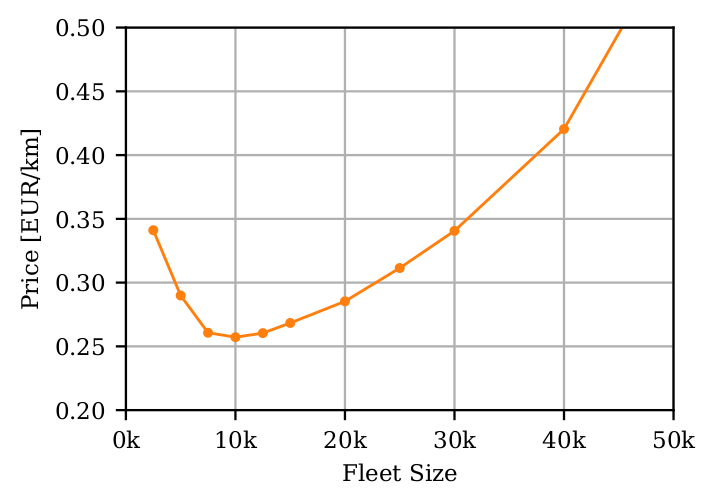
Price
Trips
- Utilization
- Empty distance, ...
- Travel times
- Wait times, ...
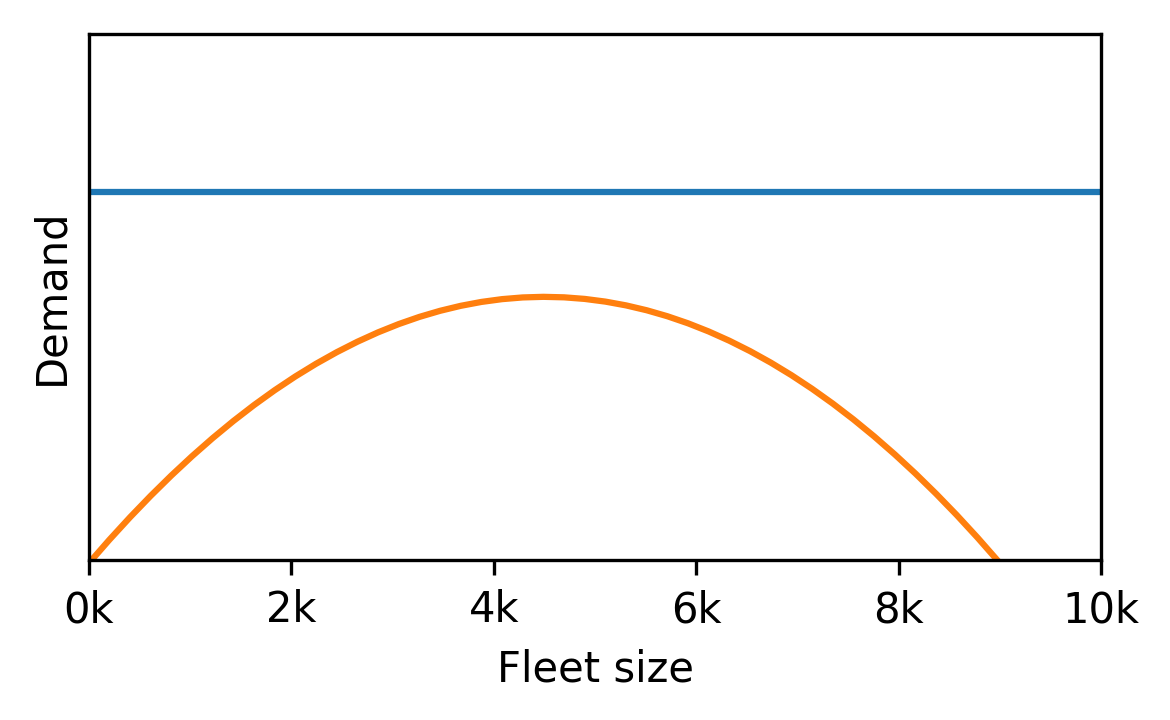
Fleet sizing with dynamic demand
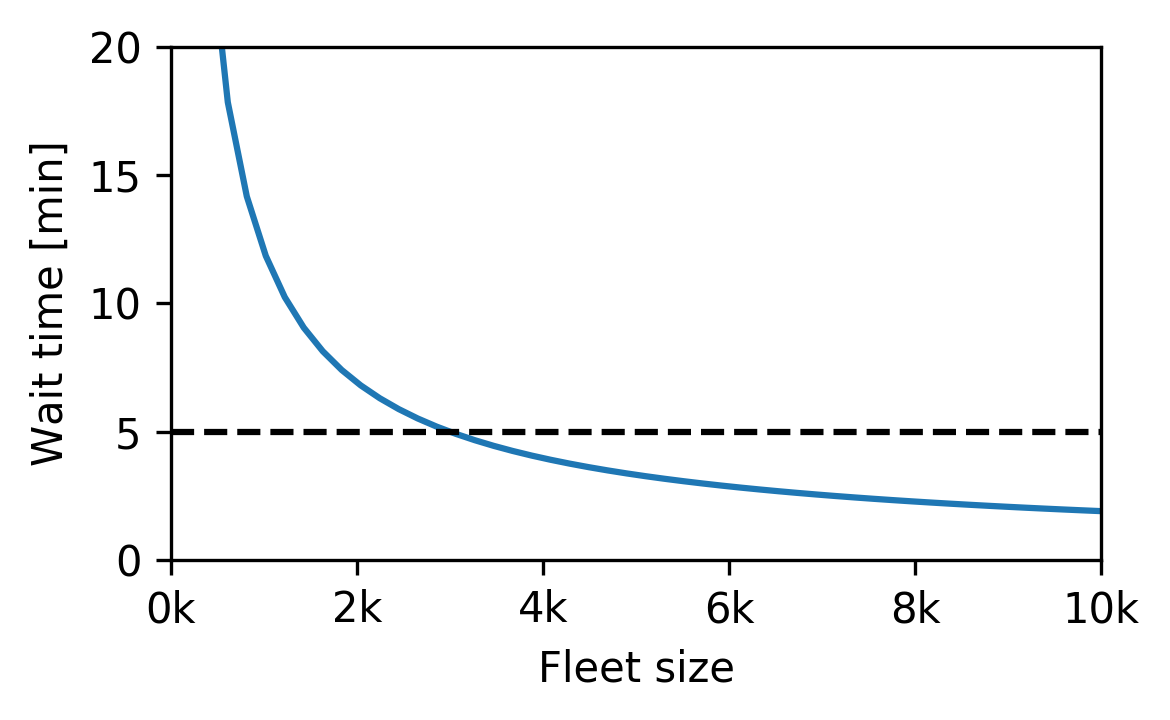
Fleet sizing with dynamic demand

Fleet sizing with dynamic demand
Visualisation
Automated taxi
Pickup
Dropoff
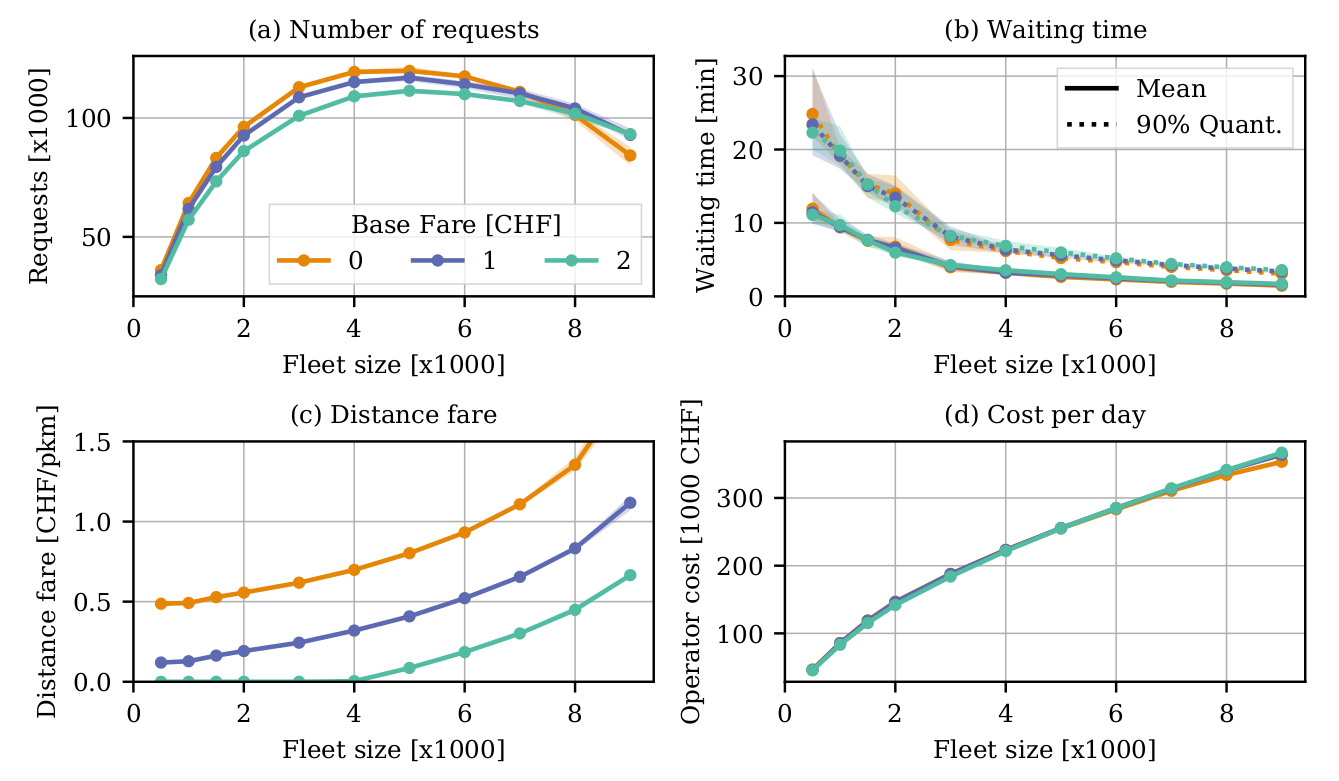
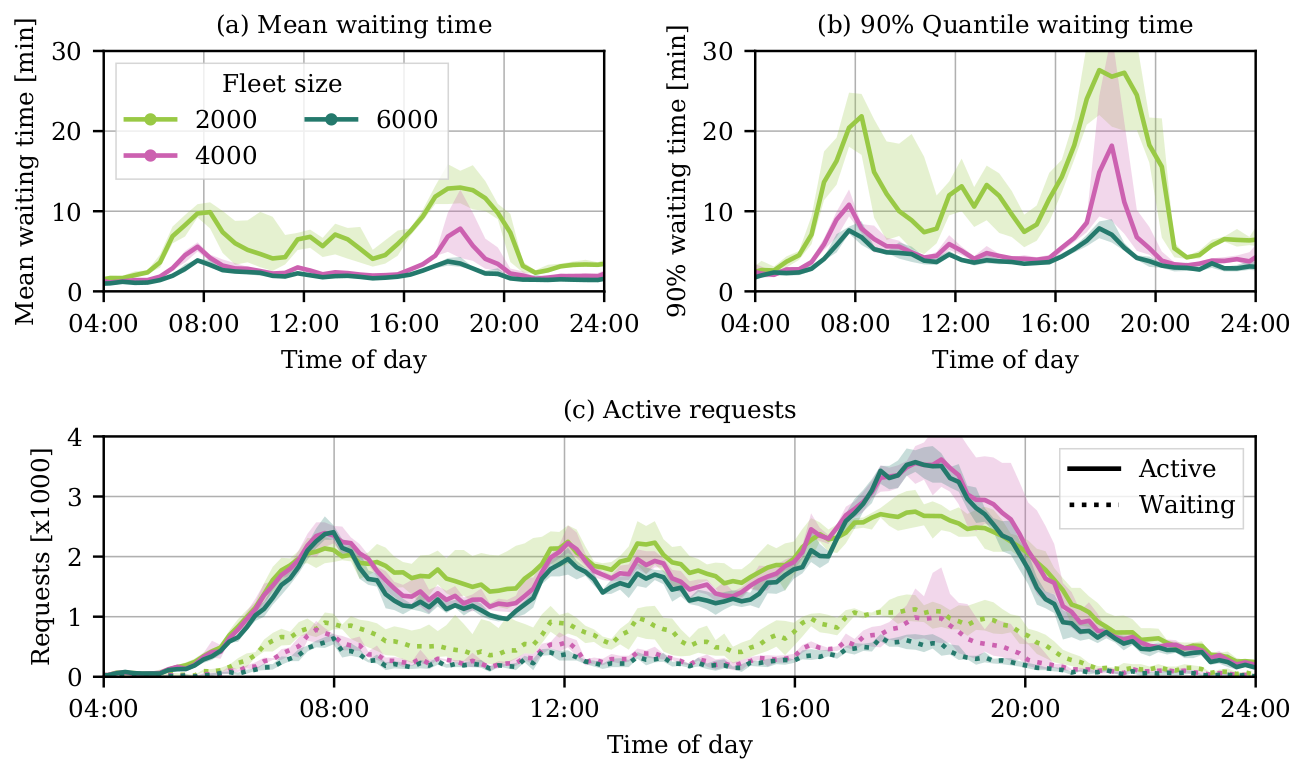
Hörl, S., F. Becker and K.W. Axhausen (2020) Automated Mobility on Demand: A comprehensive simulation study of cost, behaviour and system impact for Zurich
Hörl, S., F. Becker and K.W. Axhausen (2020) Automated Mobility on Demand: A comprehensive simulation study of cost, behaviour and system impact for Zurich
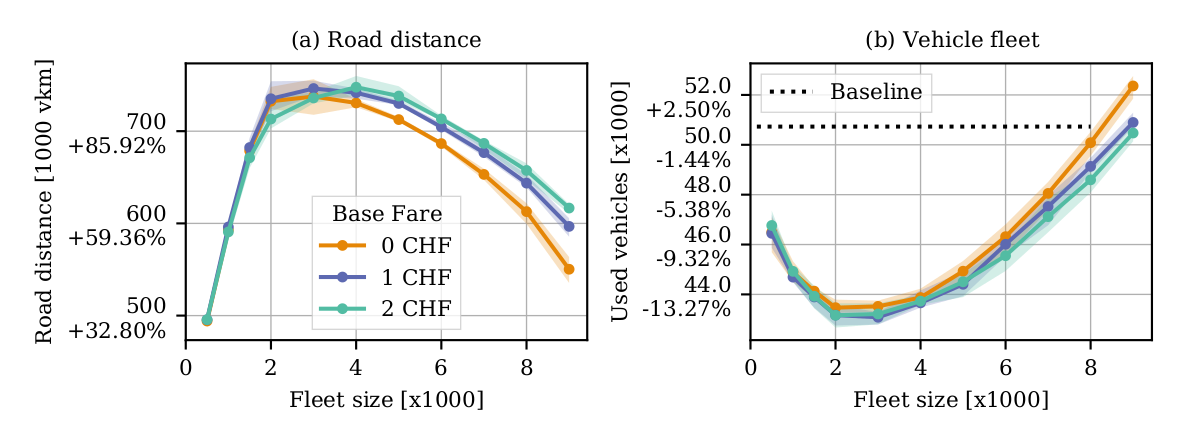
13% reduction in vehicles
100% increase in VKT
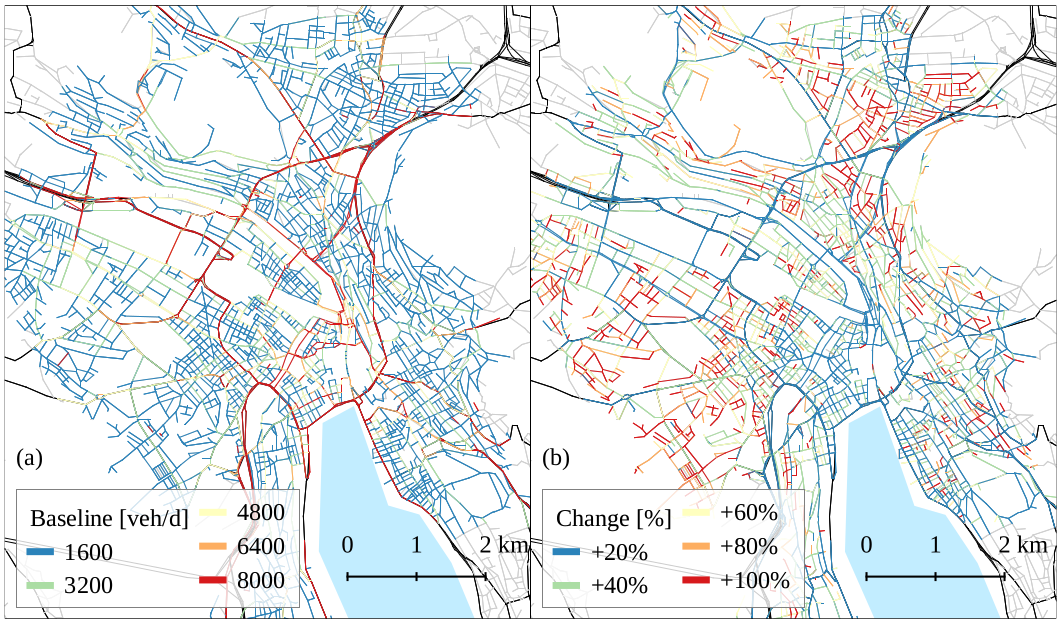
Hörl, S., F. Becker and K.W. Axhausen (2020) Automated Mobility on Demand: A comprehensive simulation study of cost, behaviour and system impact for Zurich
100% increase in VKT
Hörl, S., F. Becker and K.W. Axhausen (2020) Automated Mobility on Demand: A comprehensive simulation study of cost, behaviour and system impact for Zurich
Other aspects
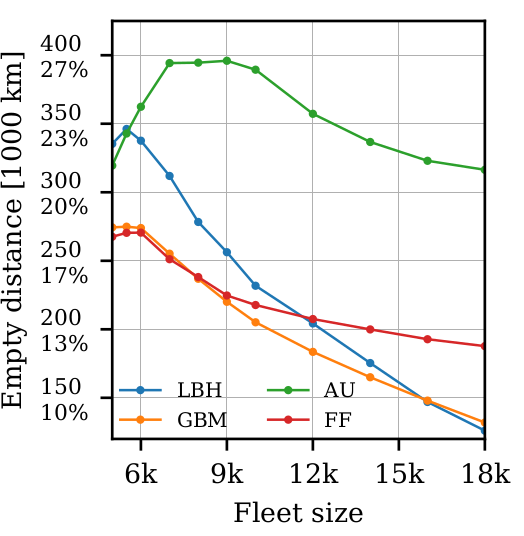
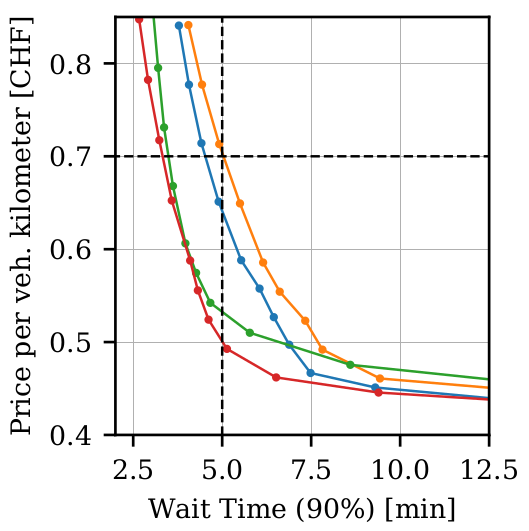
Hörl, S., C. Ruch, F. Becker, E. Frazzoli and K.W. Axhausen (2019) Fleet operational policies for automated mobility: a simulation assessment for Zurich, Transportation Research: Part C, 102, 20-32.
Fleet control


Operational constraints
Spatial constraints
Intermodality
Pooling
III. Demand data
https://pixabay.com/en/paris-eiffel-tower-night-city-view-3296269/
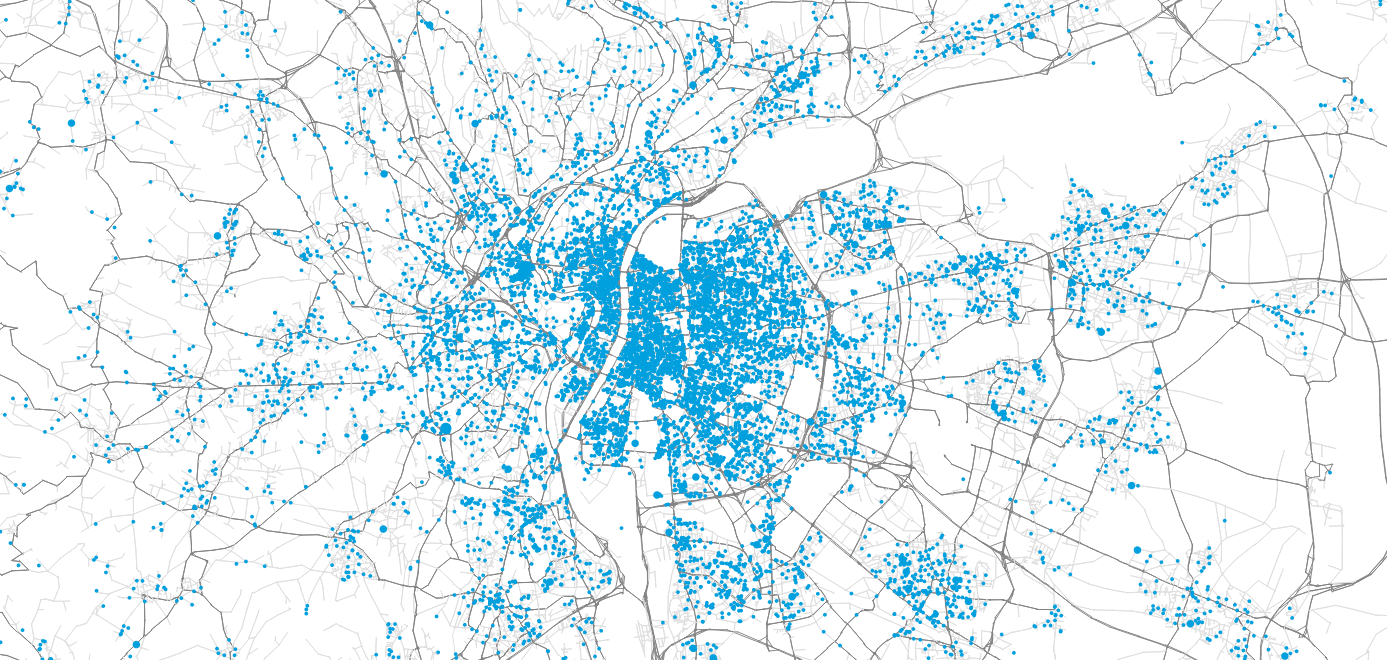
Synthetic travel demand

Population census (RP)
Population census (RP)
Income data (FiLoSoFi)

Synthetic travel demand
Population census (RP)
Income data (FiLoSoFi)
Commuting data (RP-MOB)
Synthetic travel demand
Population census (RP)
Income data (FiLoSoFi)
Commuting data (RP-MOB)

Household travel survey (EDGT)
0:00 - 8:00
08:30 - 17:00
17:30 - 0:00
0:00 - 9:00
10:00 - 17:30
17:45 - 21:00
22:00 - 0:00
Synthetic travel demand
Population census (RP)
Income data (FiLoSoFi)
Commuting data (RP-MOB)
Household travel survey (EDGT)
Enterprise census (SIRENE)


Address database (BD-TOPO)
Synthetic travel demand
Population census (RP)
Income data (FiLoSoFi)
Commuting data (RP-MOB)
Household travel survey (EDGT)
Enterprise census (SIRENE)
Address database (BD-TOPO)
Person ID
Age
Gender
Home (X,Y)
1
43
male
(65345, ...)
2
24
female
(65345, ...)
3
9
female
(65345, ...)
Synthetic travel demand
Population census (RP)
Income data (FiLoSoFi)
Commuting data (RP-MOB)
Household travel survey (EDGT)
Enterprise census (SIRENE)
Address database (BD-TOPO)
Person ID
Activity
Start
End
Loc.
523
home
08:00
(x,y)
523
work
08:55
18:12
(x,y)
523
shop
19:10
19:25
(x,y)
523
home
19:40
(x,y)
Synthetic travel demand
Population census (RP)
Income data (FiLoSoFi)
Commuting data (RP-MOB)
Household travel survey (EDGT)
Enterprise census (SIRENE)
OpenStreetMap
GTFS (SYTRAL / SNCF)
Address database (BD-TOPO)
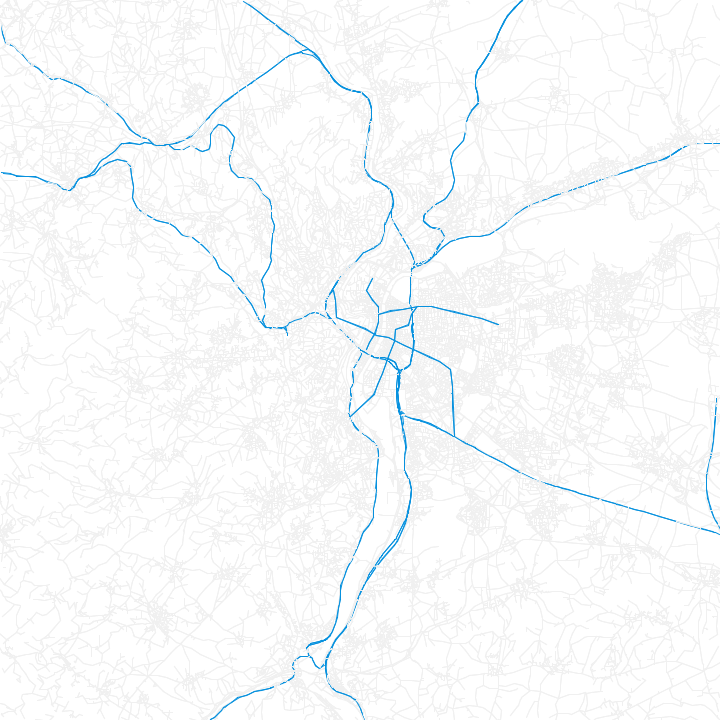
Synthetic travel demand
Population census (RP)
Income data (FiLoSoFi)
Commuting data (RP-MOB)
Household travel survey (EDGT)
Enterprise census (SIRENE)
OpenStreetMap
GTFS (SYTRAL / SNCF)
Address database (BD-TOPO)
Synthetic travel demand
Population census (RP)
Income data (FiLoSoFi)
Commuting data (RP-MOB)
National HTS (ENTD)
Enterprise census (SIRENE)
OpenStreetMap
GTFS (SYTRAL / SNCF)
Address database (BD-TOPO)
Synthetic travel demand
EDGT
Population census (RP)
Income data (FiLoSoFi)
Commuting data (RP-MOB)
Enterprise census (SIRENE)
OpenStreetMap
GTFS (SYTRAL / SNCF)
Address database (BD-TOPO)
Synthetic travel demand
Open
Data

Open
Software
+
=
Reproducible research
Integrated testing
National HTS (ENTD)
EDGT
Population census (RP)
Income data (FiLoSoFi)
Commuting data (RP-MOB)
Enterprise census (SIRENE)
OpenStreetMap
GTFS (SYTRAL / SNCF)
Address database (BD-TOPO)
Synthetic travel demand
Open
Data
Open
Software
+
=
Reproducible research
Integrated testing
National HTS (ENTD)
EDGT
Current use cases

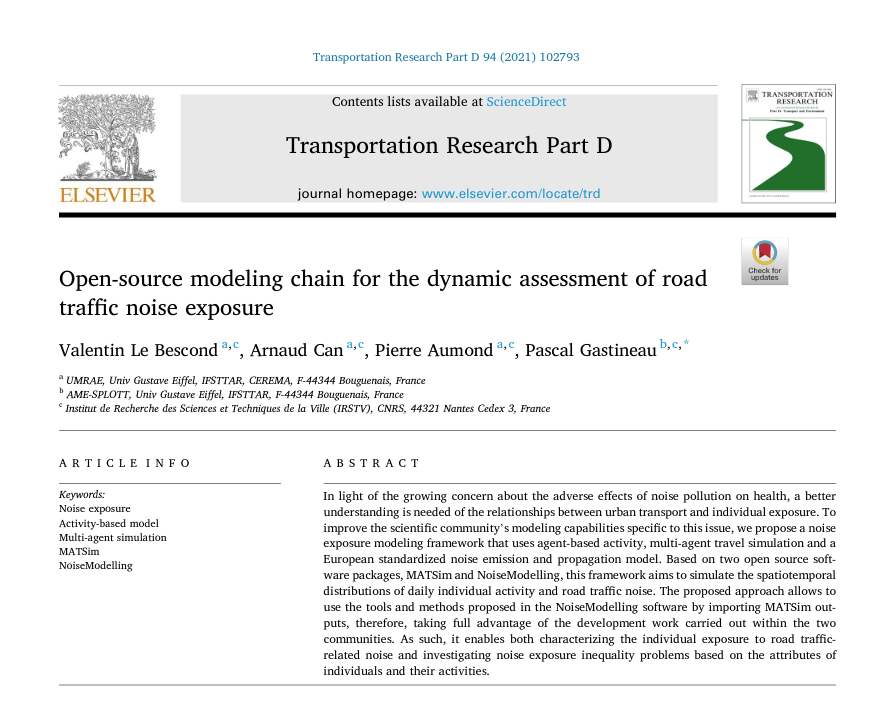
Nantes
- Noise modeling
Current use cases
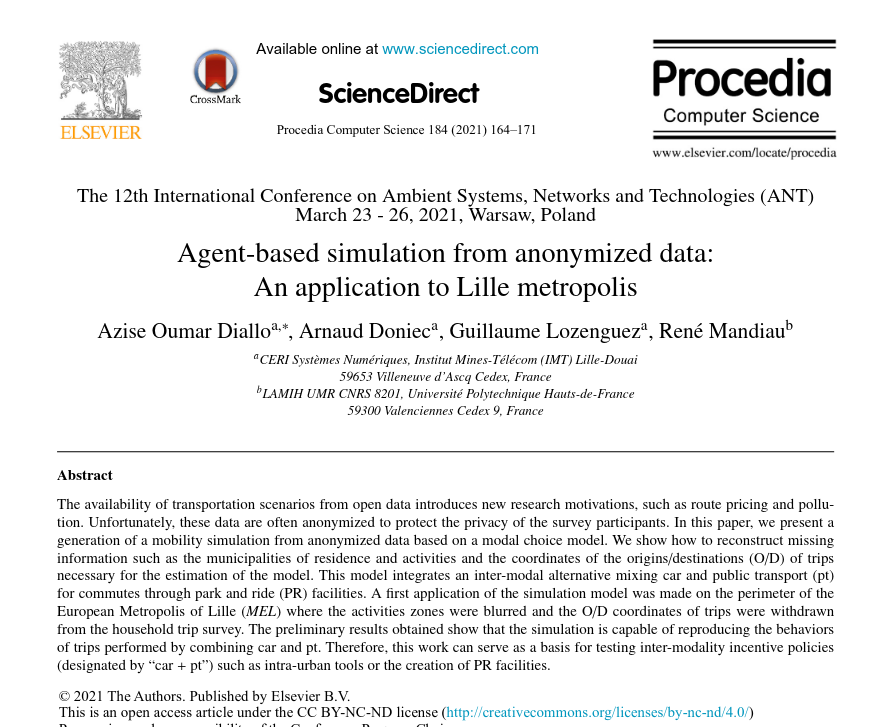
Lille
- Park & ride applications
- Road pricing

Current use cases
Toulouse
- Placement and use of shared offices
Current use cases
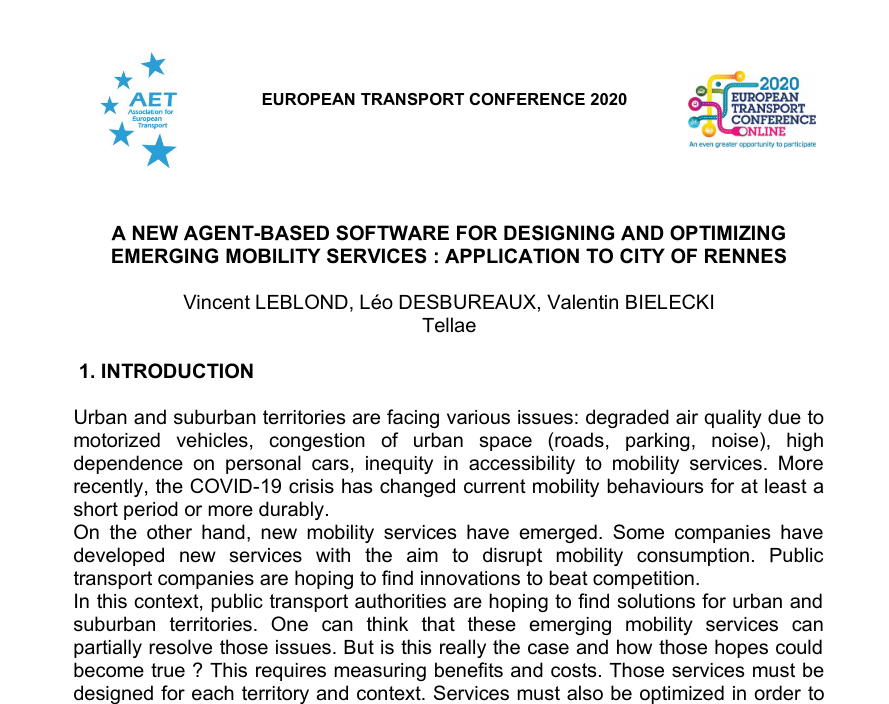
Rennes
- Micromobility simulation

Current use cases
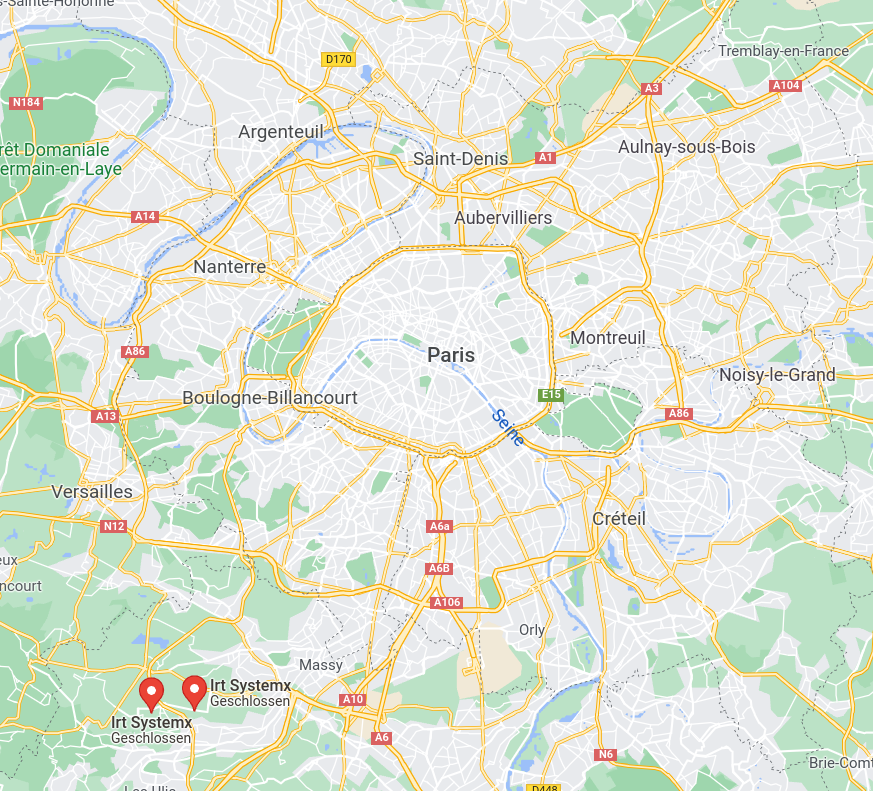
Paris / Île-de-France
- Scenario development for sustainable urban transformation
- New mobility services
Mahdi Zargayouna (GRETTIA / Univ. Gustave Eiffel)
Nicolas Coulombel (LVMT / ENPC)
Current use cases

Paris / Île-de-France
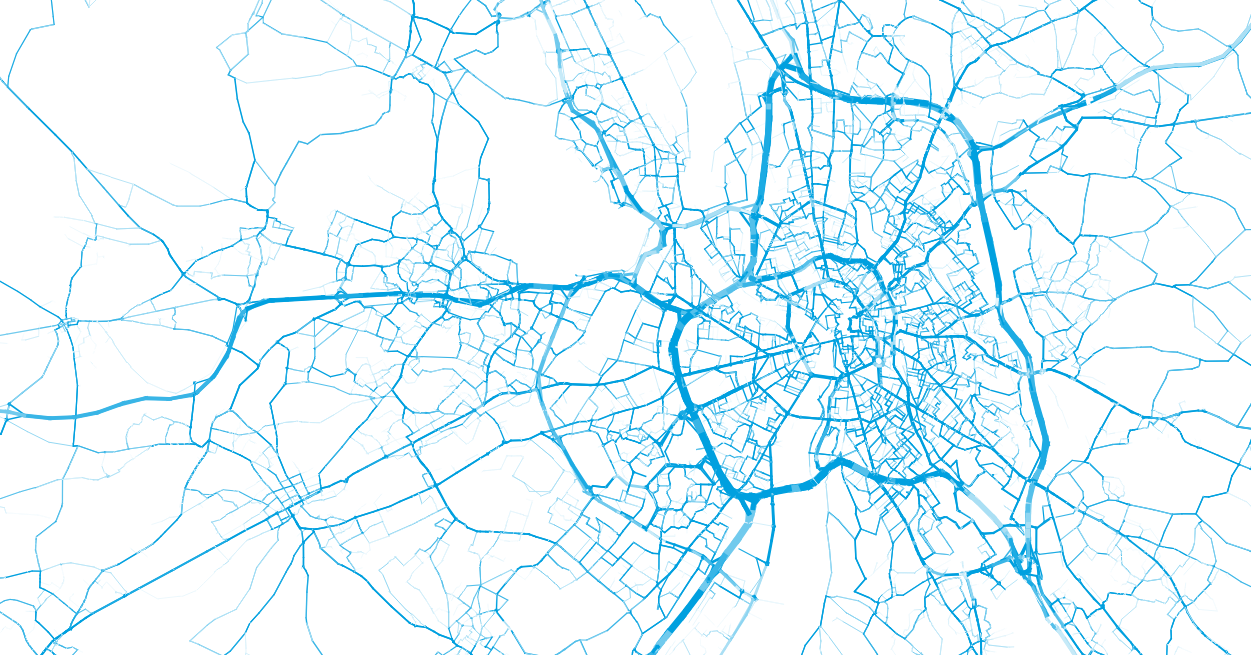
- Cycling simulation
Current use cases
Paris / Île-de-France
- Simulation of dynamic mobility services
- Fleet control through reinforcement learning
Current use cases
Lyon (IRT SystemX)
- Low-emission first/last mile logistics
Current use cases
Current use cases

Balac, M., Hörl, S. (2021) Synthetic population for the state of California based on open-data: examples of San Francisco Bay area and San Diego County, presented at 100th Annual Meeting of the Transportation Research Board, Washington, D.C.
Sallard, A., Balac, M., Hörl, S. (2021) Synthetic travel demand for the Greater São Paulo Metropolitan Region, based on open data, Under Review
Sao Paulo, San Francisco Bay area, Los Angeles five-county area, Switzerland, Montreal, Quebec City, Jakarta, Casablanca, ...
Emissions in Paris
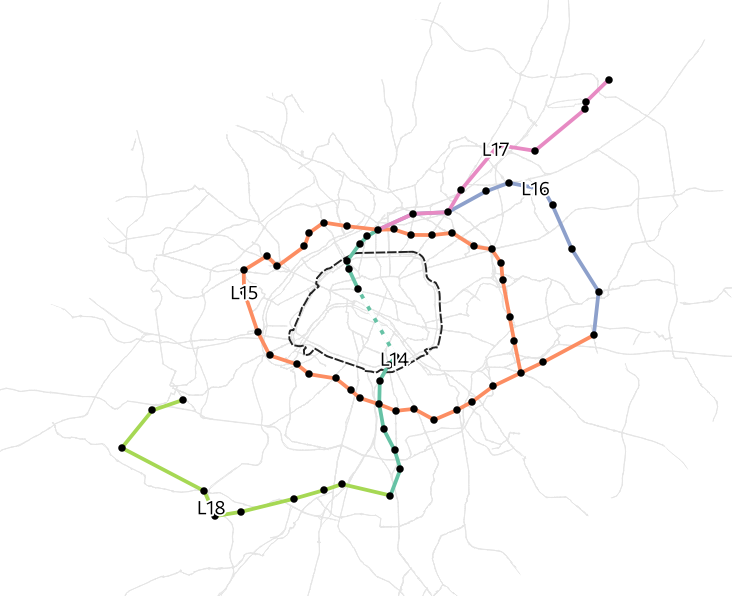
Grand Paris Express
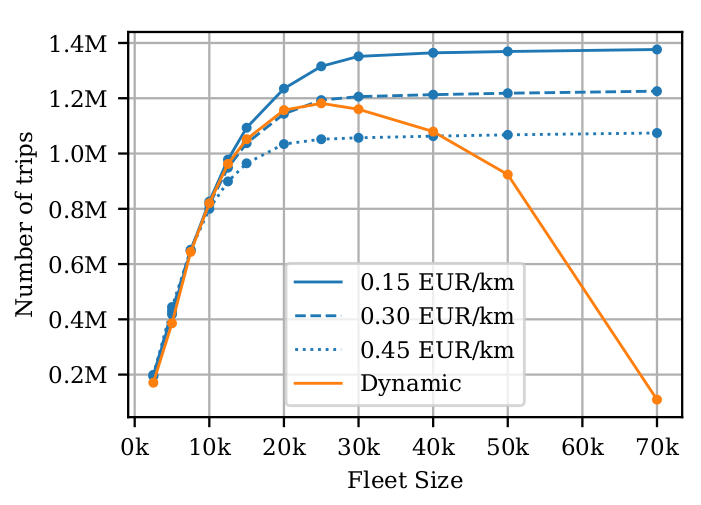
Automated taxis in Paris
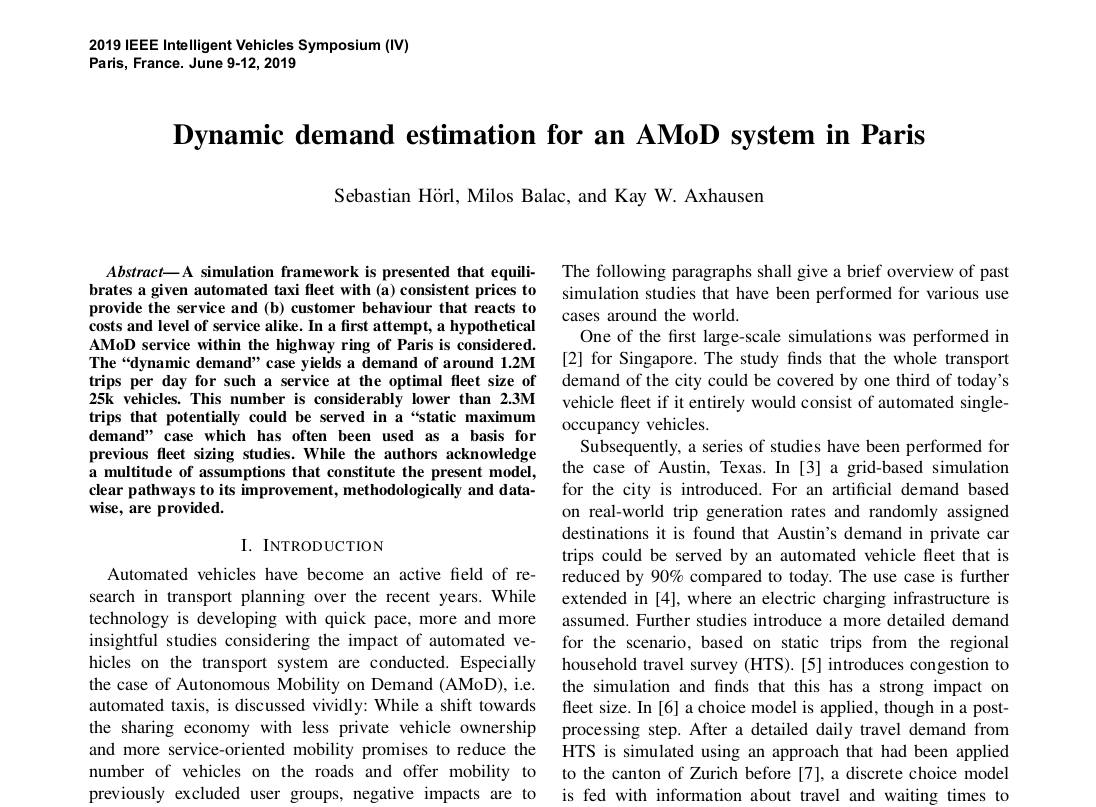
Automated taxis in Paris
IV. Logistics
LEAD Project
Low-emission Adaptive last-mile logistics supporting on-demand economy through Digital Twins
- H2020 Project from 2020 to 2023
- Six living labs with different innovative logistics concepts
- Lyon, The Hague, Madrid, Budapest, Porto, Oslo
- One partner for implementation and one for research each
- Development of a generic modeling library for last-mile logistics scenario simulation and analysis
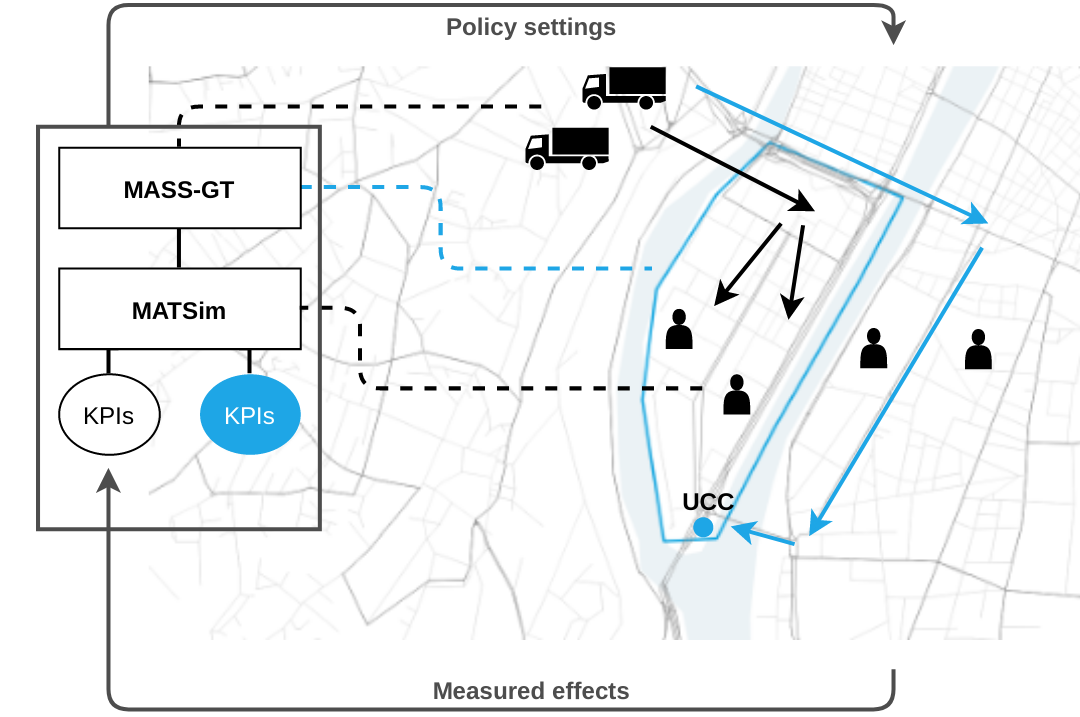
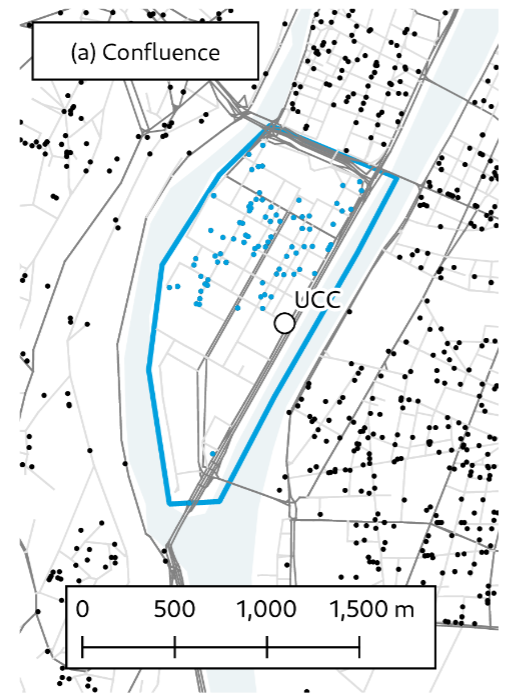
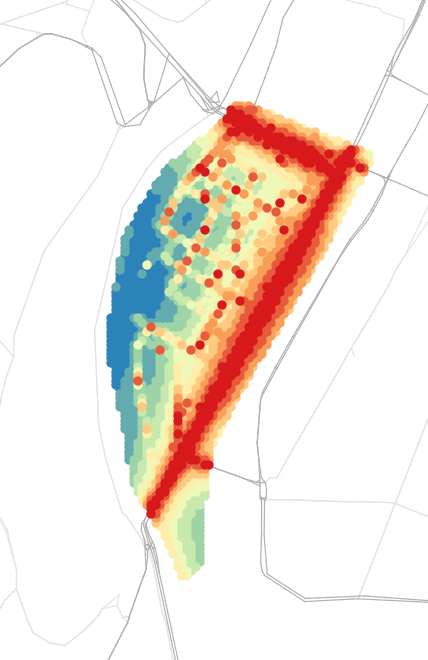
Lyon Living Lab
- Peninsula Confluence between Saône and Rhône
- Interesting use case as there are limited access points
- Implementation of an urban consolidation center (UCC) to collect the flow of goods and organize last-mile distribution
- using cargo-bikes
- using electric robots
- and others
- Analysis and modeling through
- Flow estimation through cameras
- Simulation of future scenarios
- Focus on parcel deliveries due to data availability
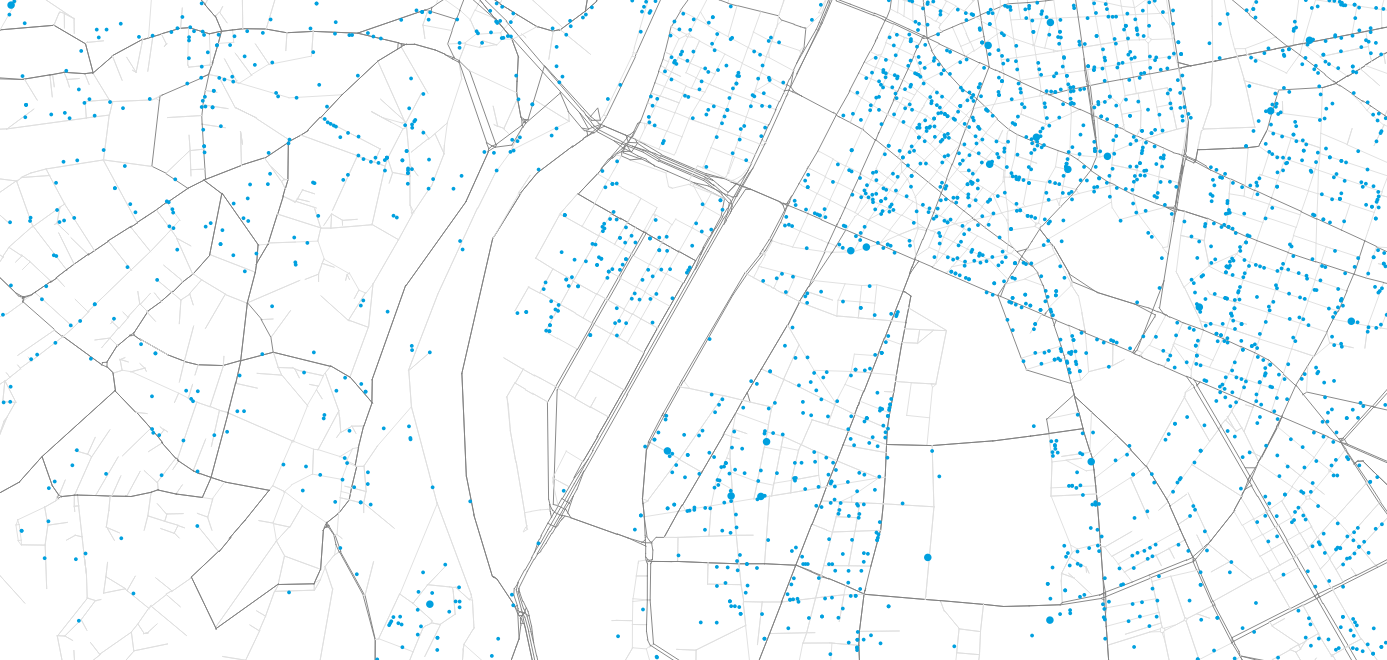
Modeling methodology

Agent-based simulation of Lyon
Demand in parcel deliveries
Distribution by operators
KPI Calculation
- Main question: What is the impact on traffic and population of implementing an Urban Consolidation Center in Confluence?
- Focus on B2C parcel deliveries due to data availability
Methodology: Parcel demand
Synthetic population
+
Synthetic population
Out-of-home purchase survey
Achats découplés des ménages
Based on sociodemographic attributes of the households, parcels are generated for the city on an average day.
Gardrat, M., 2019. Méthodologie d’enquête: le découplage de l’achat et de la récupération des marchandises par les ménages. LAET, Lyon, France.
Methodology: Parcel demand
Synthetic population
Gardrat, M., 2019. Méthodologie d’enquête: le découplage de l’achat et de la récupération des marchandises par les ménages. LAET, Lyon, France.
+
Synthetic population
Out-of-home purchase survey
Achats découplés des ménages
Based on sociodemographic attributes of the households, parcels are generated for the city on an average day.
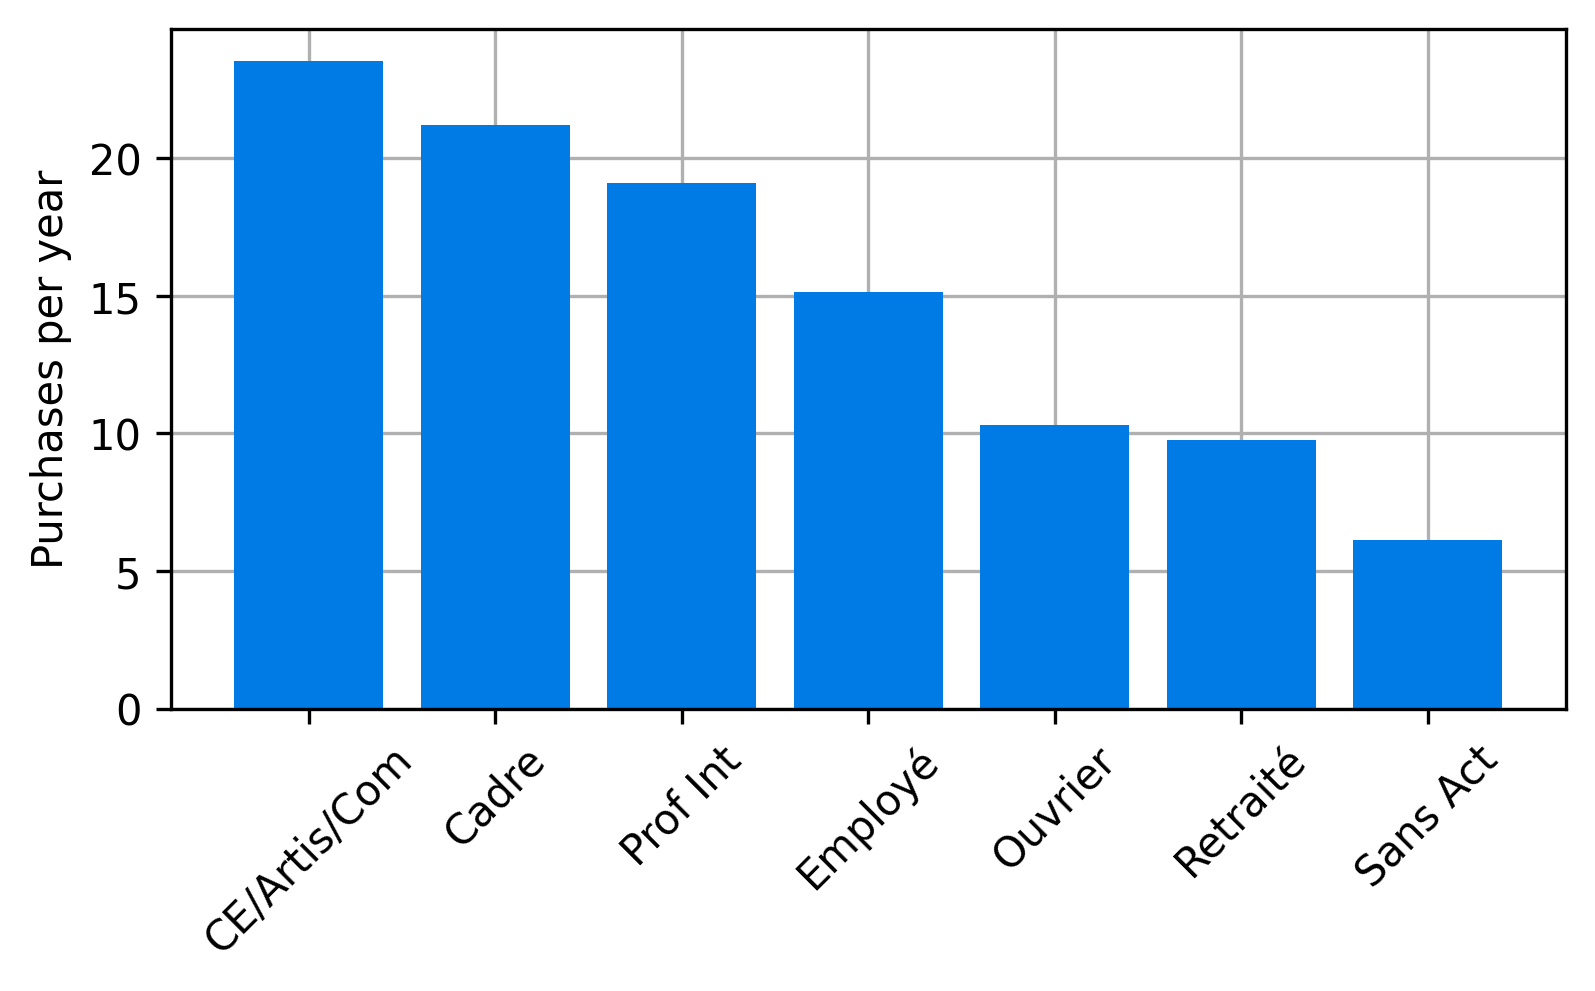
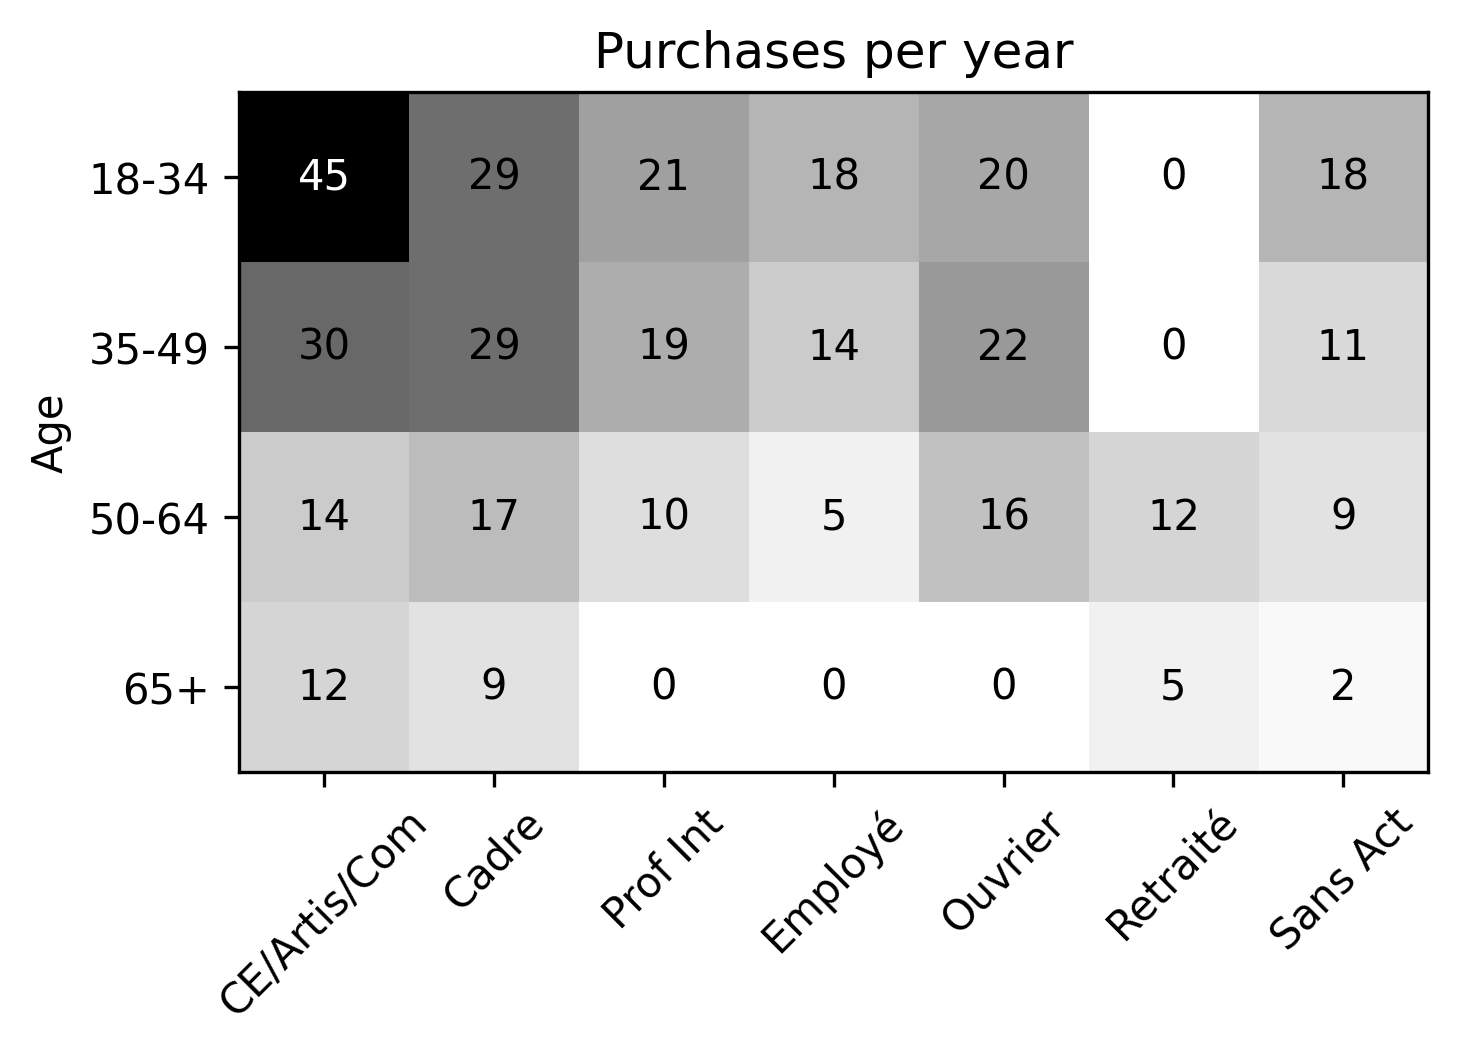
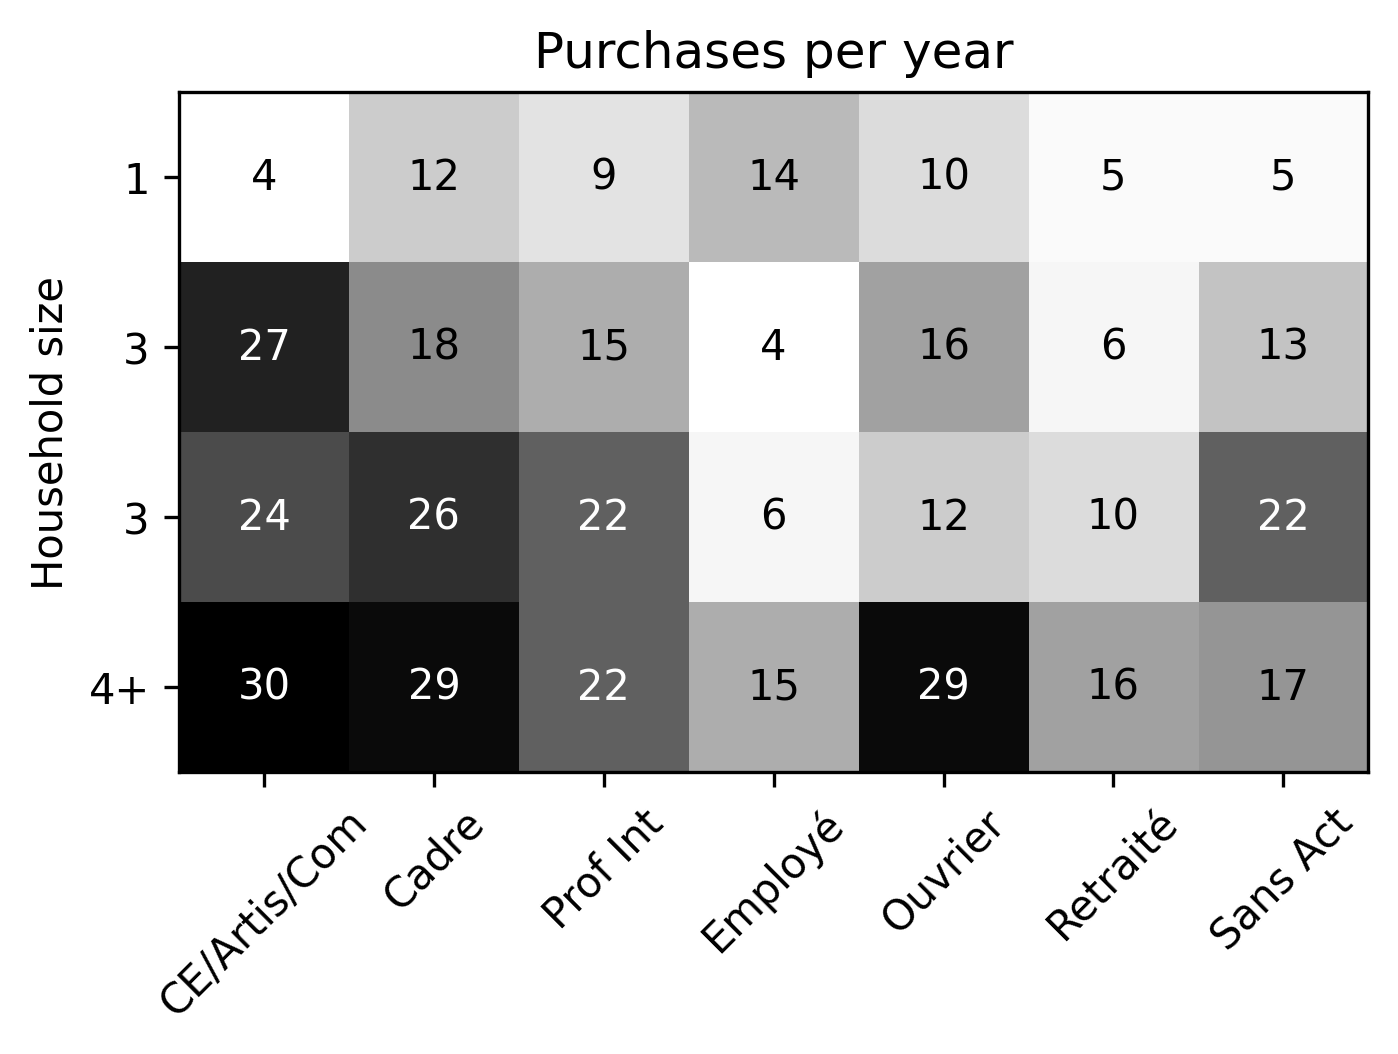
Iterative proportional fitting (IFP)
- Based on synthetic population, find average number of purchases delivered to a household defined by socioprofesional class, age of the reference person and household size per day.
\mu_{a,h,s} = d_{s} \cdot \frac{w_{a,h,s}}{365}
Methodology: Parcel demand
Synthetic population
Gardrat, M., 2019. Méthodologie d’enquête: le découplage de l’achat et de la récupération des marchandises par les ménages. LAET, Lyon, France.
+
Synthetic population
Out-of-home purchase survey
Achats découplés des ménages
Based on sociodemographic attributes of the households, parcels are generated for the city on an average day.
Maximum entropy approach
- We now the average number of parcels, but we do not now the distribution of the number of parcels for a household on an average day.
- We know it must be non-negative, and we know the mean.
- Without additional data, we assume maximum entropy distribution, which is Exponential in this case.
F(N \leq n) = \text{Pois}(\mu)
Methodology: Parcel demand
Synthetic population
Gardrat, M., 2019. Méthodologie d’enquête: le découplage de l’achat et de la récupération des marchandises par les ménages. LAET, Lyon, France.
+
Synthetic population
Out-of-home purchase survey
Achats découplés des ménages
Based on sociodemographic attributes of the households, parcels are generated for the city on an average day.
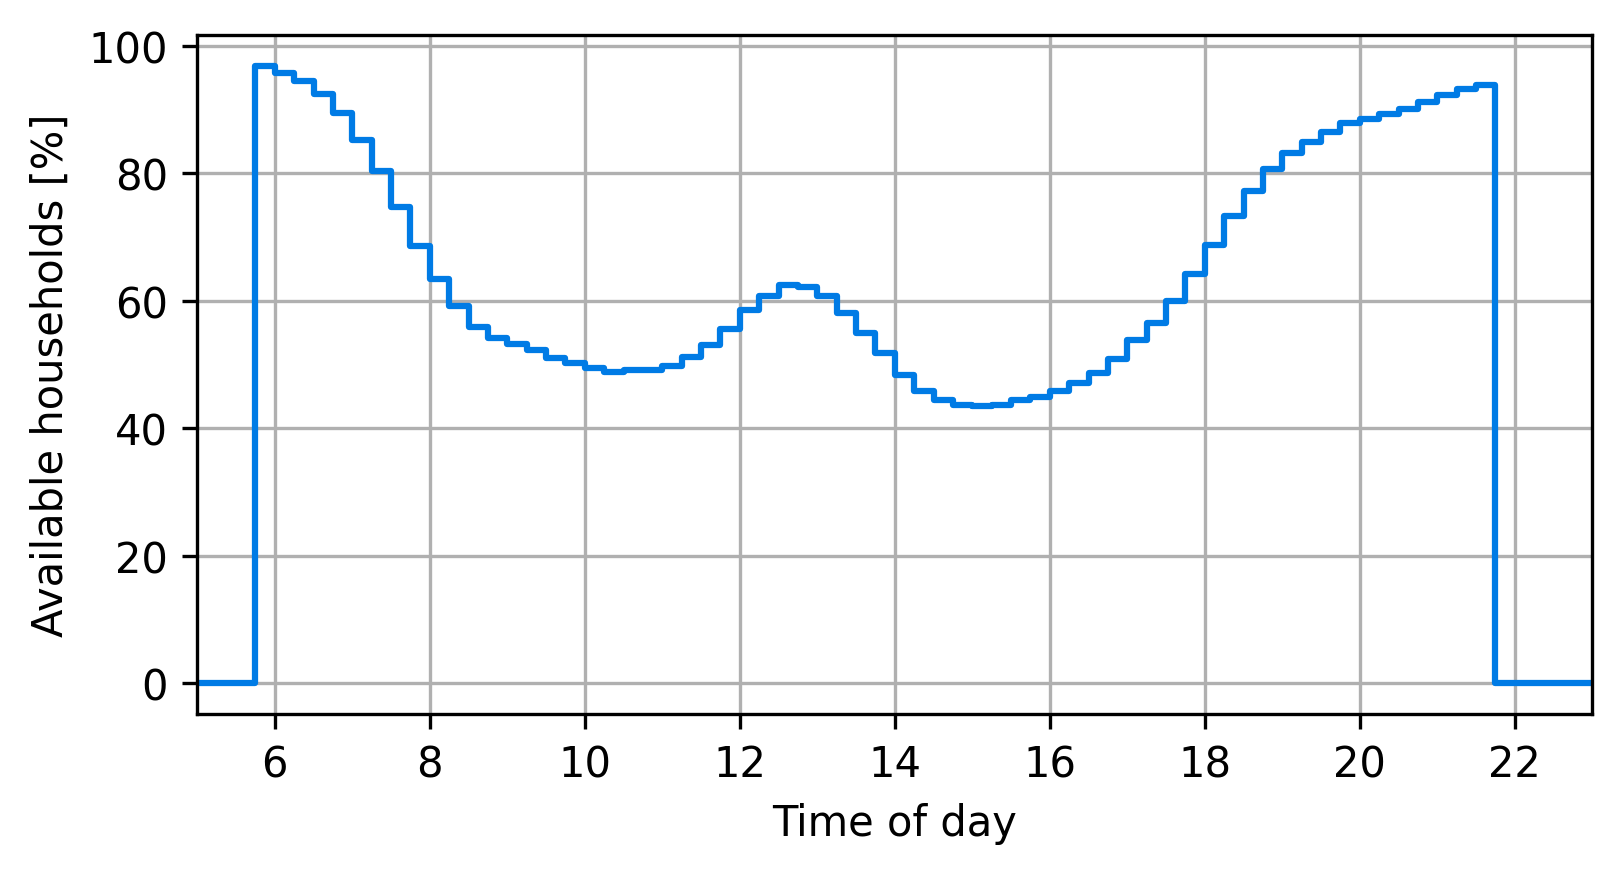
Presence of household members
Methodology: Route optimization
Using a heursitic routing solver, an optimal distribution scheme per distribution center is obtained to arrive at a lower bound estimate for the distance covered for the deliveries.

JSprit
First case study
Hörl, S. and J. Puchinger (2022) From synthetic population to parcel demand: Modeling pipeline and case study for last-mile deliveries in Lyon, TRA 2022, Lisbon.
Solve VRP-TW based on generated parcels and household presence
JSprit
First case study
Solve VRP-TW based on generated parcels and household presence
JSprit
Hörl, S. and J. Puchinger (2022) From synthetic population to parcel demand: Modeling pipeline and case study for last-mile deliveries in Lyon, TRA 2022, Lisbon.
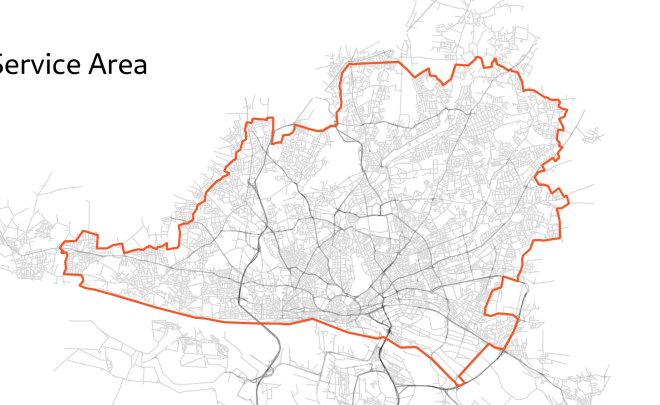
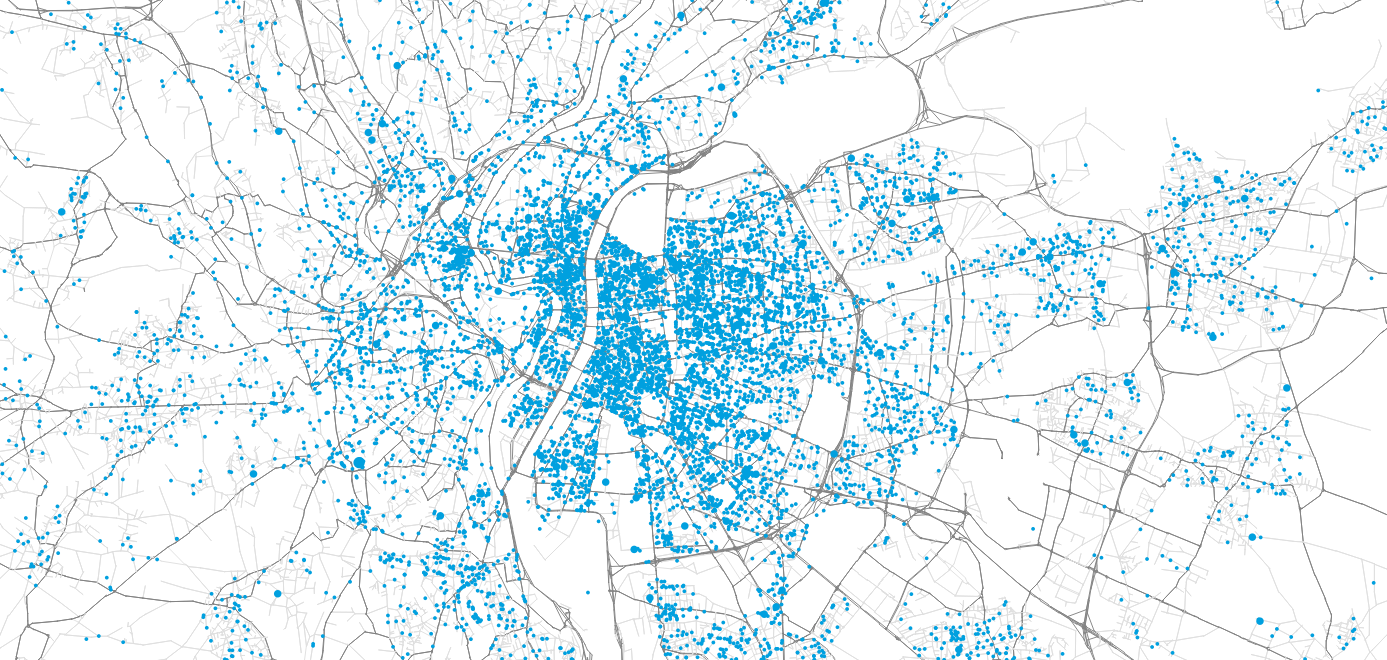
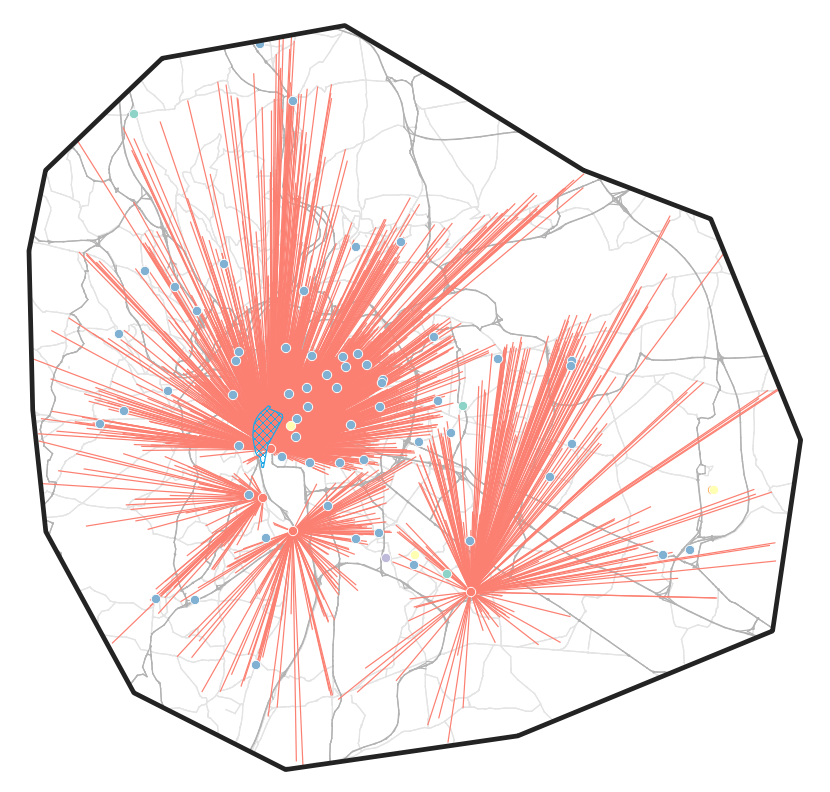
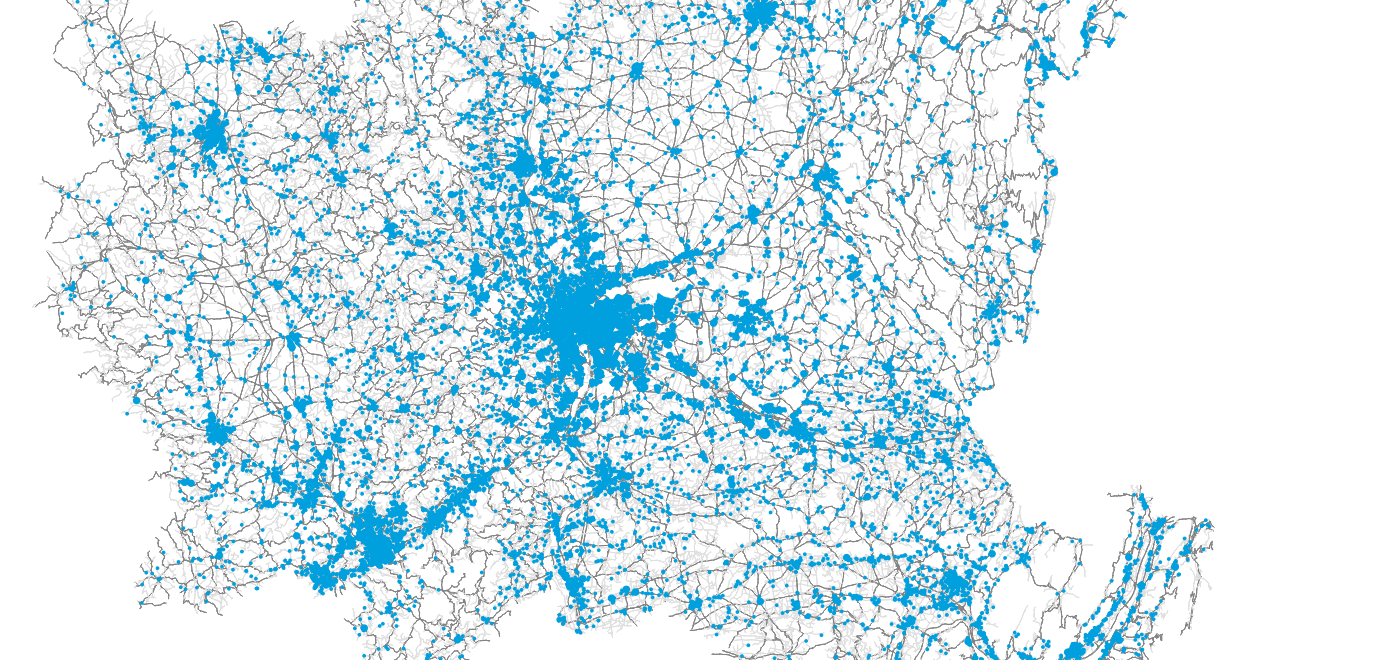
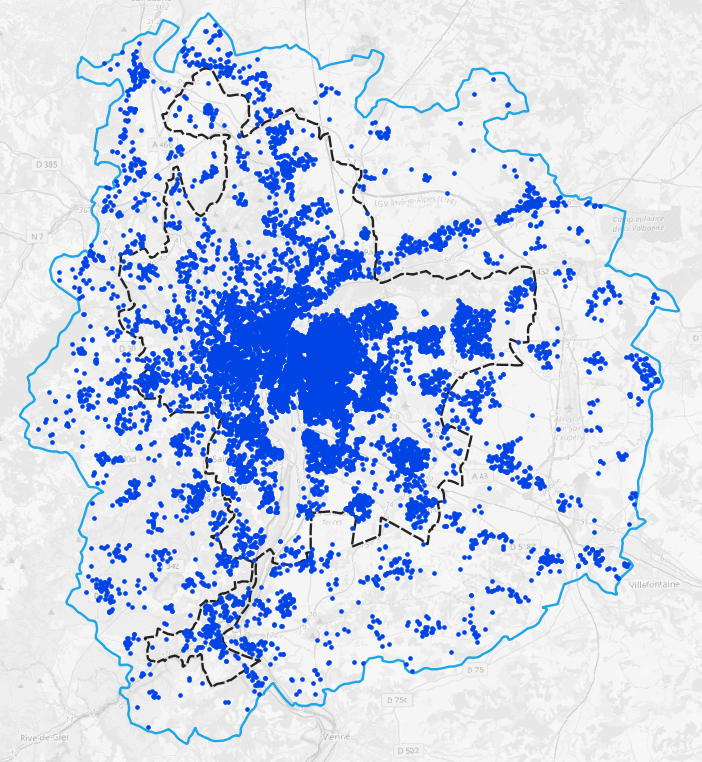
Methodology: Study area
How many parcels need to be delivered on one day?
Methodology: Study area
How many parcels need to be delivered on one day?
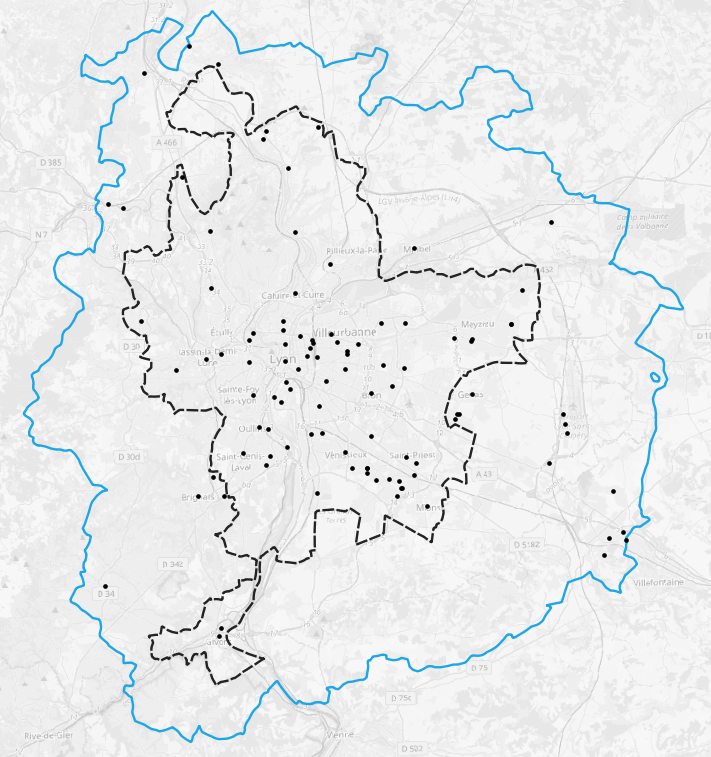
Perimeter
- City of Lyon
- Grand Lyon metropolitan region (dashed)
- Bordering municipalities including relevant logistics infrastructure
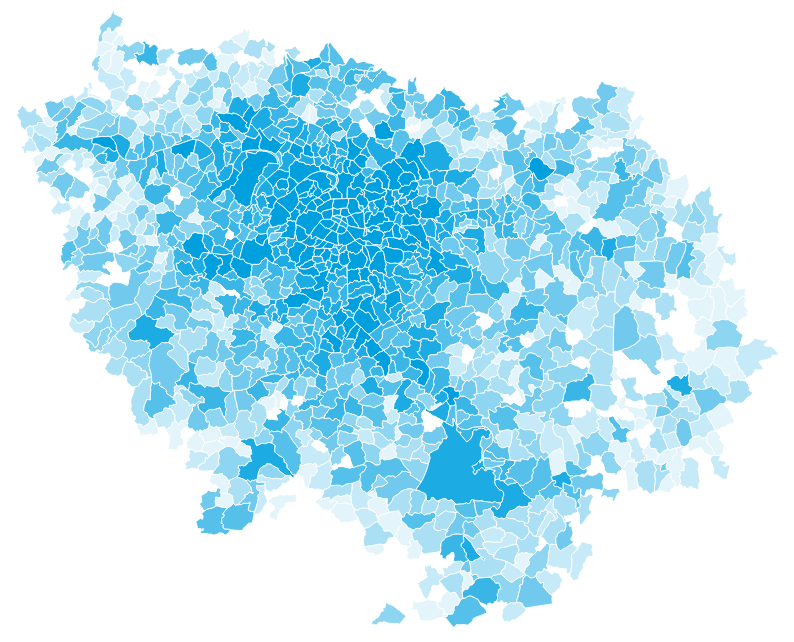
Demand
- 1.6M personas
- 790k households
- 16,252 parcels
Methodology: Distribution centers
From where do operators delivery the parcels?
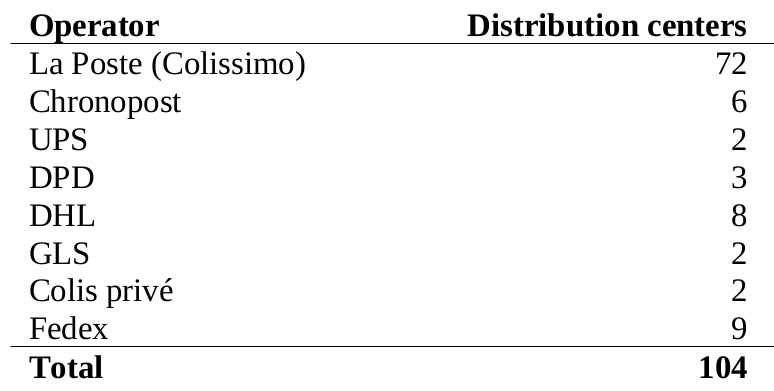
Methodology: Distribution centers
From where do operators delivery the parcels?
Approach
- Facilities per operator extracted from SIRENE
- Geolocated using public BAN API
- La Poste: Facilities with 20+ employees
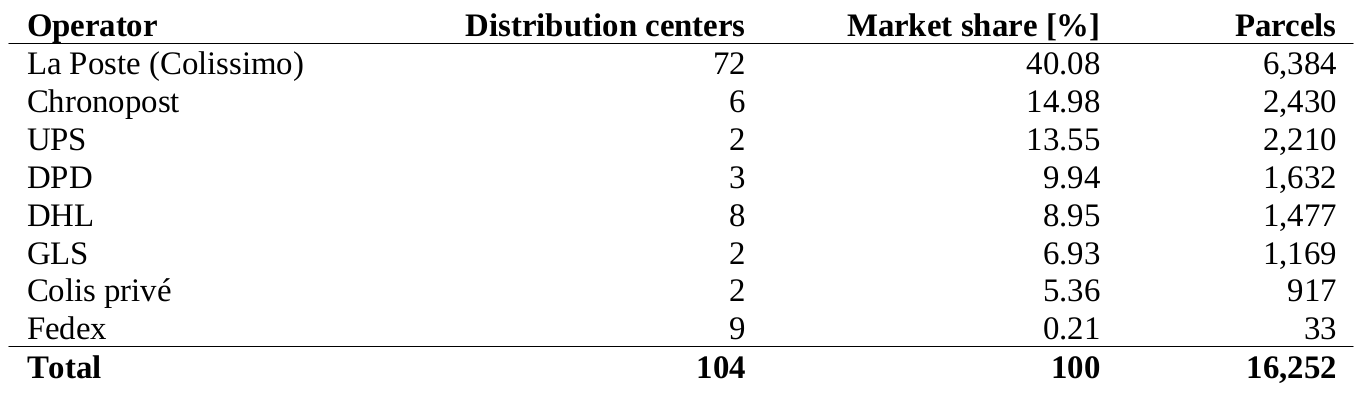
Methodology: Market shares
How many parcels are delivered by each operator?
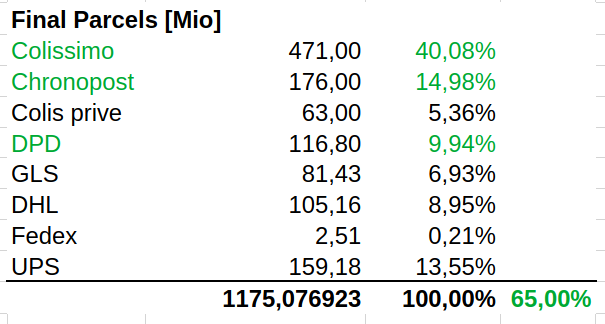
Methodology: Market shares
How many parcels are delivered by each operator?
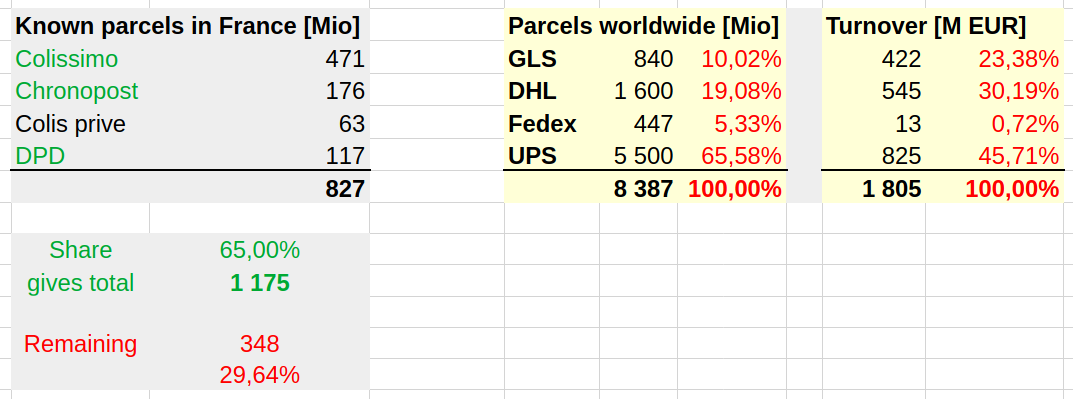
Approach
- For some operators, we know the annual national volumes from gray literature
- We know that La Poste (Colissimo + DPD + Chronopost) add up to about 65% of all parcels in France
- For the rest, we approximate their market share using their annual turnover values
Methodology: Market shares
How many parcels are delivered by each operator?
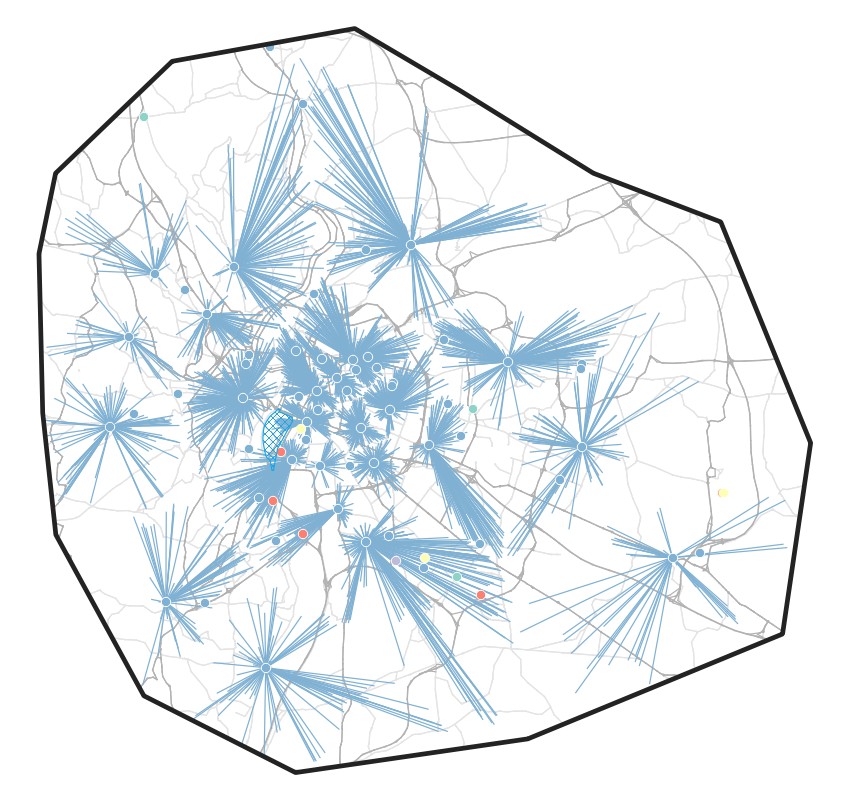
Methodology: Assignment
How many parcels are delivered by each distribution center?
Methodology: Assignment
How many parcels are delivered by each distribution center?
Approach
- For each parcel, sample an operator
- Find the operator's distribution center that is closest (shortest distance) to the parcel
Methodology: Assignment
Approach
- For each parcel, sample an operator
- Find the operator's distribution center that is closest (shortest distance) to the parcel
Outcome
- Nine centers with 300+ parcels
- Remaining centers with less than 300
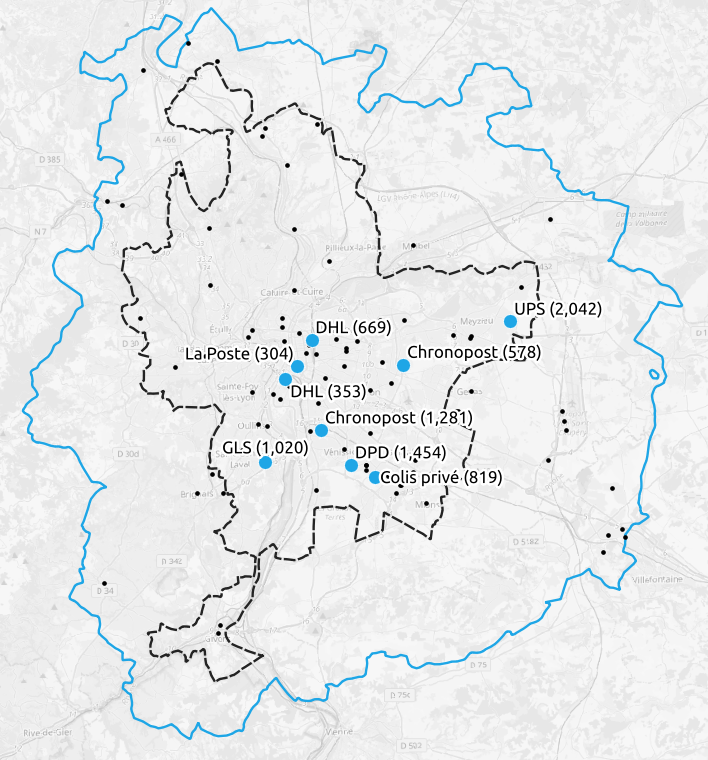
How many parcels are delivered by each distribution center?
Methodology: Cost structures
What influences operators decisions?
Methodology: Cost structures
What influences operators decisions?
Salaries
Vehicles
Distance
Daily cost
+
+
=
Methodology: Cost structures
What influences operators decisions?
Assumption (from grey literature)
- 1,300 EUR net per month
- 1,700 EUR gross per month
- 3,400 EUR staff cost per month
- 25 active days per month
- 136 EUR per day
Salaries
Vehicles
Distance
Daily cost
+
+
=
Methodology: Cost structures
What influences operators decisions?
Salaries
Distance
Daily cost
+
+
=
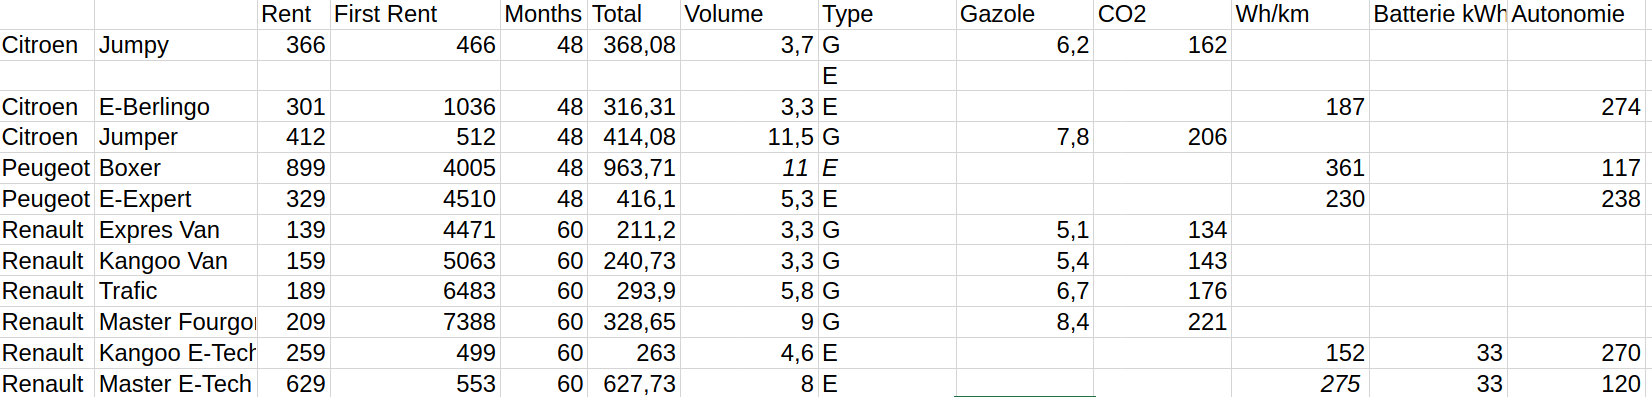
- We examined long-duration rental offers (LLD) of French vehicle manufacturers
Vehicles
Methodology: Cost structures
What influences operators decisions?
Daily cost
=
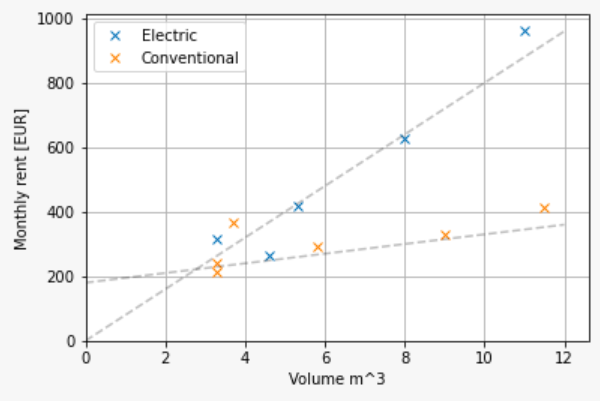
- Insight: Rental costs depend linearly on the transport volume
Salaries
Distance
+
+
Vehicles
Methodology: Cost structures
What influences operators decisions?
Daily cost
=
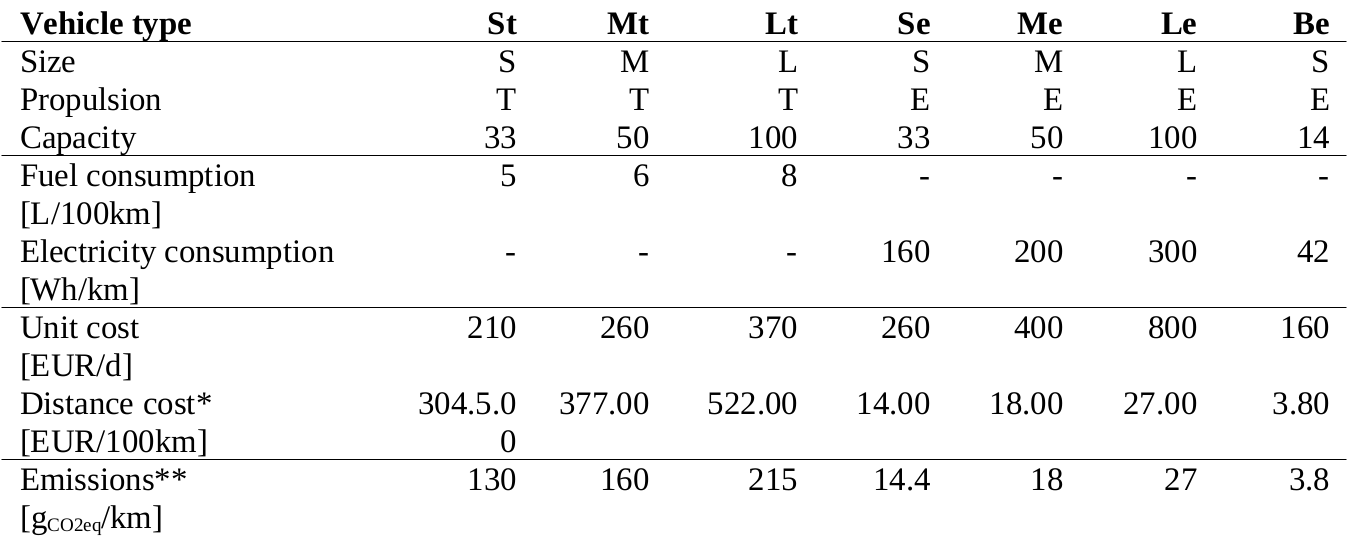
- Seven prototypical vehicle types: 3 sizes thermal or electric plus cargo-bike
Salaries
Distance
+
+
Vehicles
Methodology: Cost structures
What influences operators decisions?
Daily cost
=
- Distance-costs depend on consumption of fuel and electricity
- Multiplied by fuel or electricity prices (example 1.45 EUR/L and 9ct/kWh)
Salaries
Distance
+
+
Vehicles
Methodology: Cost structures
What influences operators decisions?
Daily cost
=
- Additional information from our manufacturer analysis: Emissions
- Assuming 90 gCO2eq/kWh for electric vehicles
Salaries
Distance
+
+
Vehicles
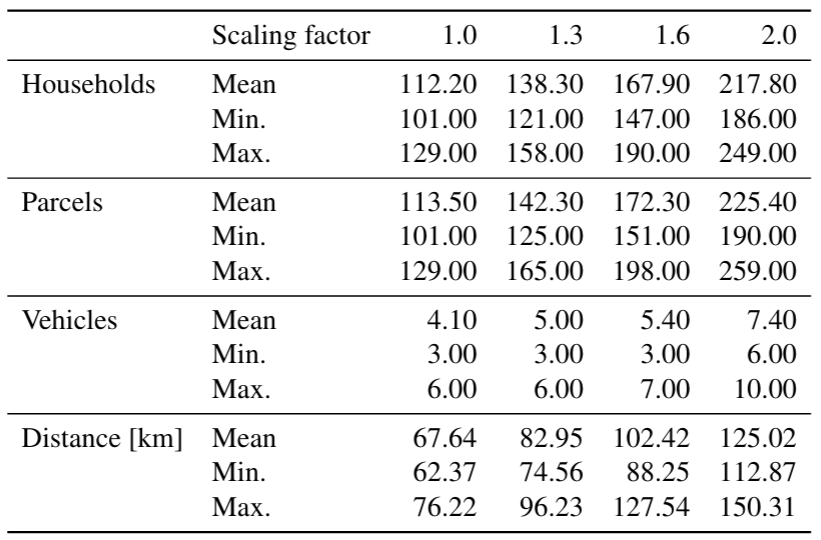
Methodology: Optimization
Minimize costs
Methodology: Optimization
Heterogeneous Vehicle Routing Problem
- Minimize cost per distribution center
- Operator can choose vehicles (7 types) and routes
- Operator must deliver all assigned parcels
- Maximum active time per day 10h
- Active time is travel time + 120s delivery + 60s pick-up per parcel
- Vehicles can not exceed capacity (we assume 10 parcels per m3)
- Multiple tours per vehicle are allowed
- Vehicles start and end the day at the distribution center
Minimize costs
Data
- OpenStreetMap network
- Extracted using osmnx
- Distance matrix between parcels and depot
- Travel time matrix using congestion factors
Solver
- Open-source
- VROOM
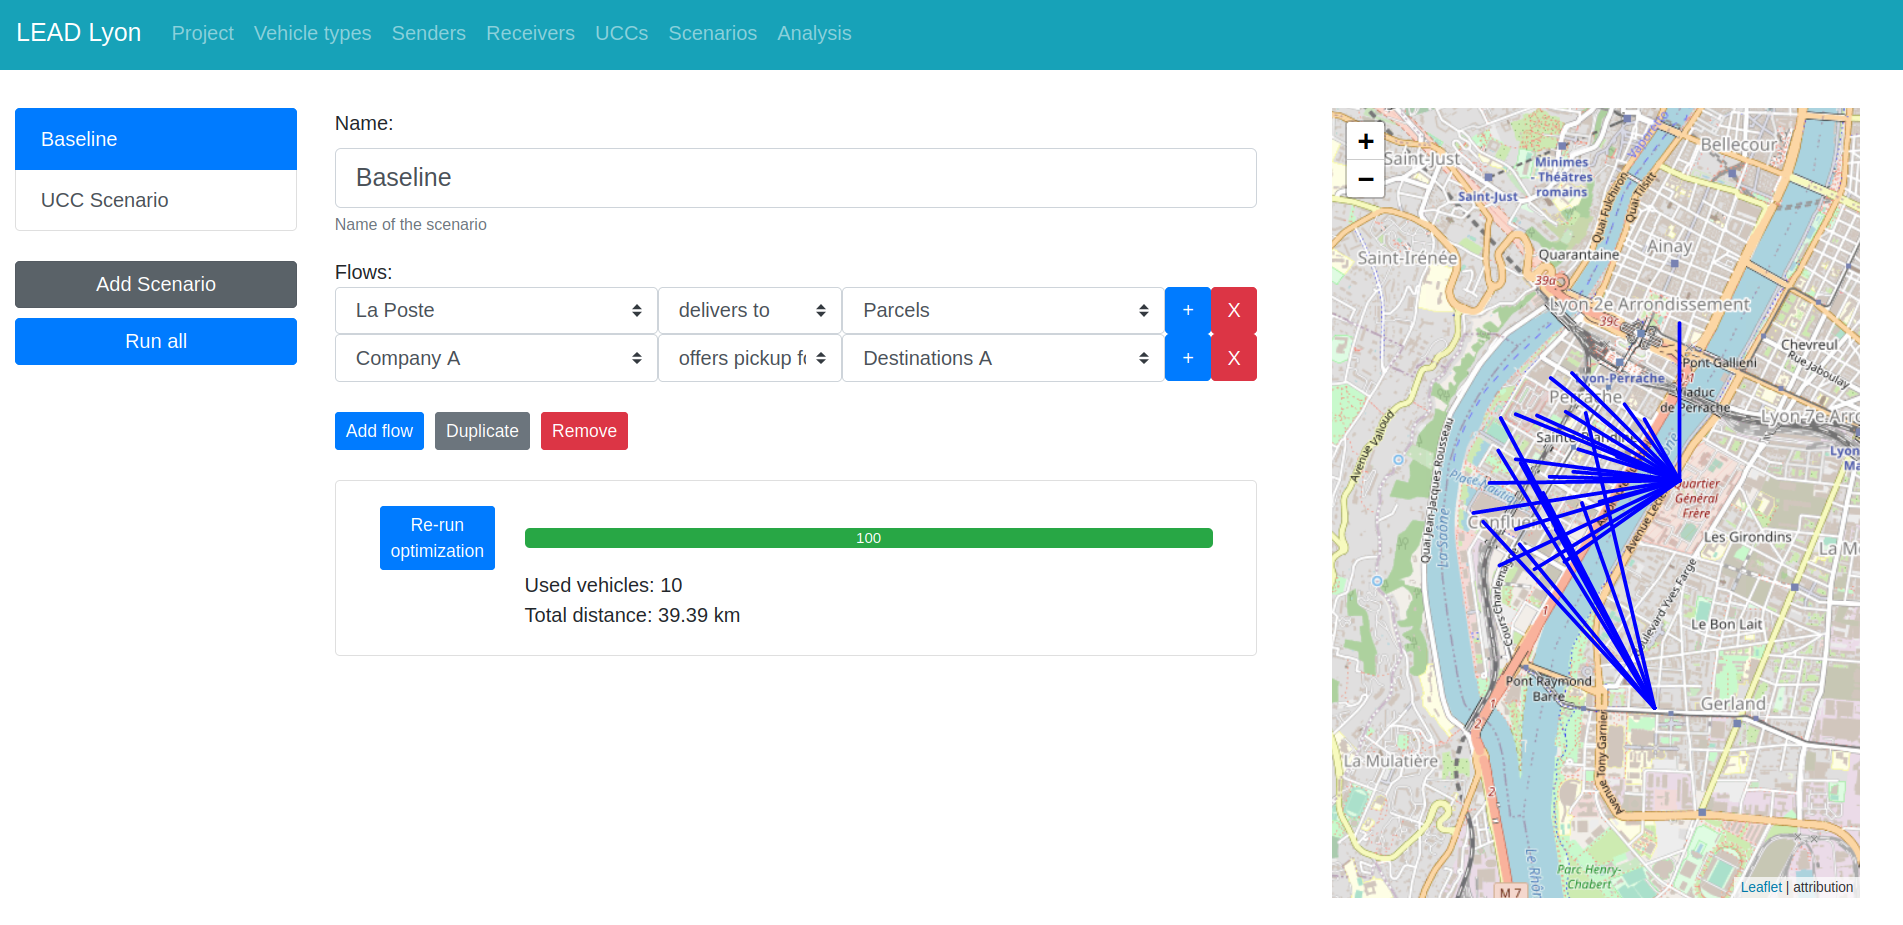
Visualisation platform
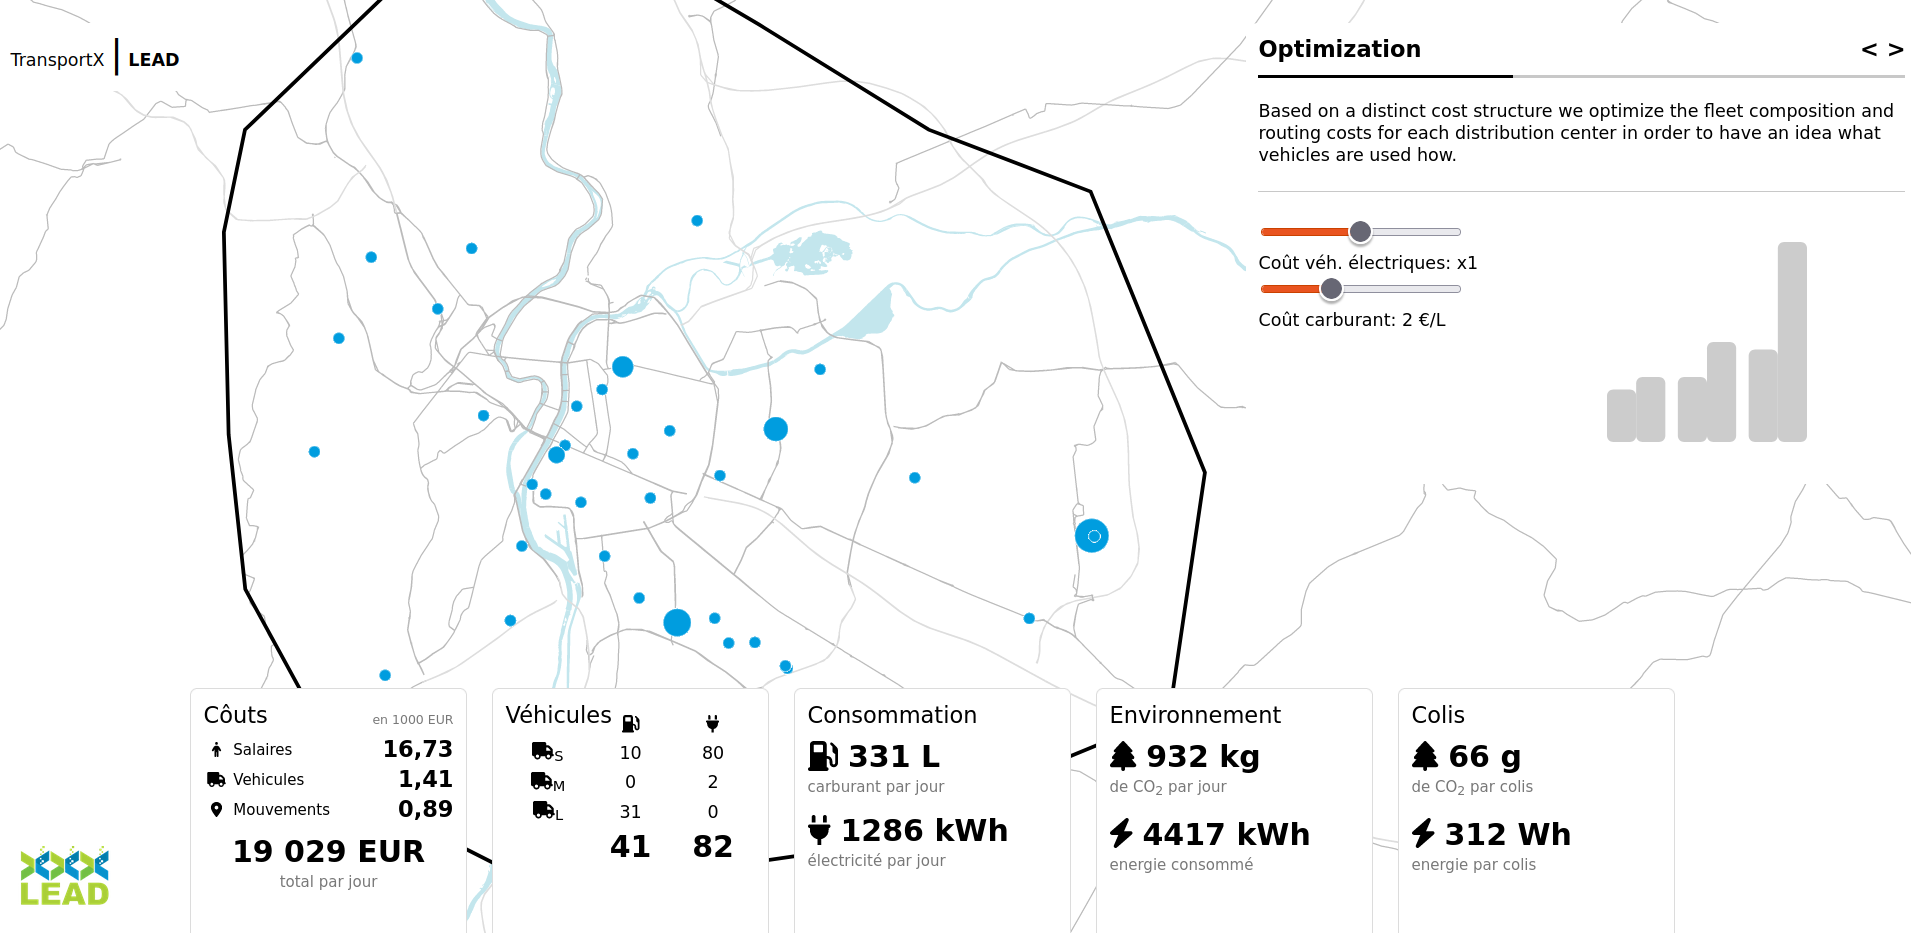
UCC platform
Questions?
Use cases for multi-agent simulation in passenger and freight transport
By Sebastian Hörl
Use cases for multi-agent simulation in passenger and freight transport
CentraleSupelec, 9 May 2023


