Simulation using ABM
slides : https://goo.gl/RFfUSz
Lena Sanders
Anne Bretagnolle
Pierre Frankhauser
Sébastien Rey-Coyrehourcq
twitter / github : @reyman64
mail : sebastien.rey-coyrehourcq.fr@univ-rouen.fr
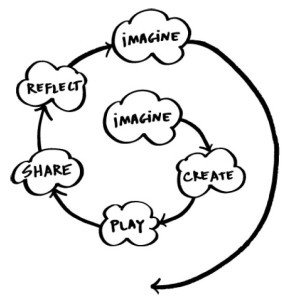
horseshoe
KISS
KIDS
Stylized
Particular
[Sanders & Banos 2011, 2013, Banos 2013]
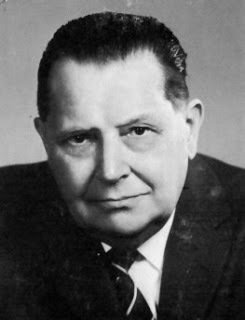
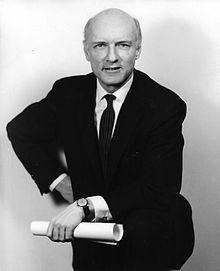
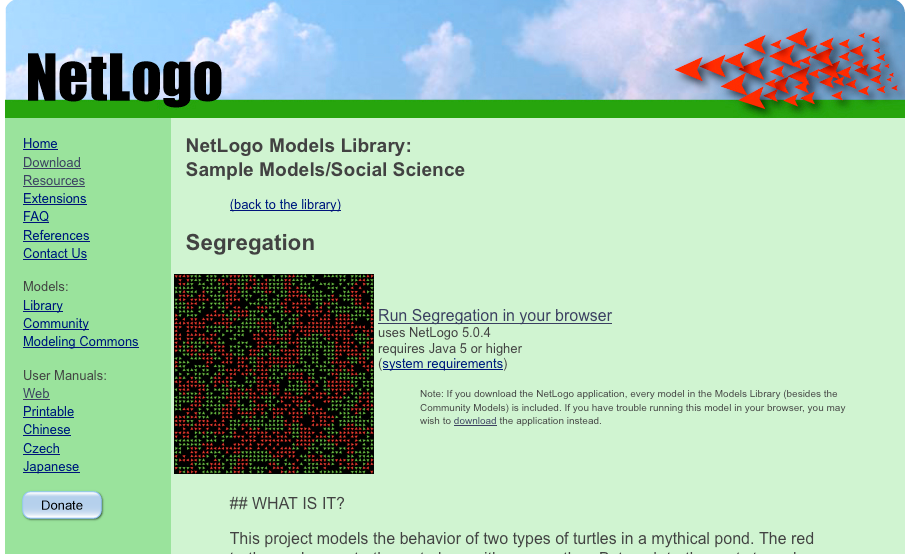
Schelling
Schelling - Sakoda simulation
[1916 - 2005]
[1921 - 2016]
Journal of Mathematical Sociology (Vol 1) 1971
Journal of Mathematical Sociology (Vol 2) 1971
- The checkerboard model of social interaction -
- Dynamic models of segregation -
Phd Dissertation 1949
Schelling
Sénat - 1966
Crédit : Henry Griffin / Associated Press
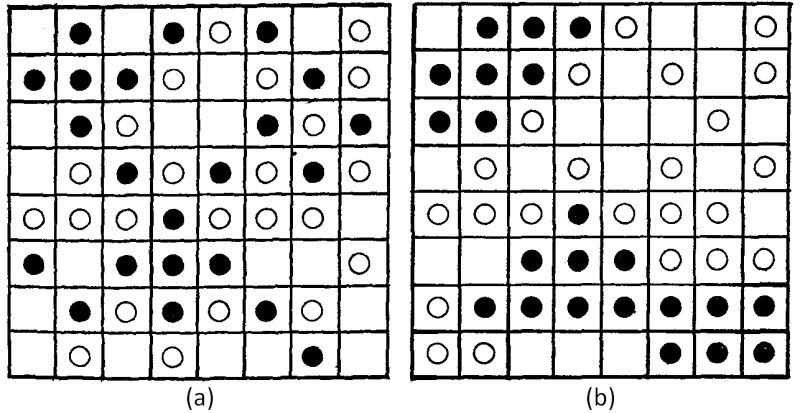
Schelling model

vacancies
blue people
pink people
random position of people on a 2D grid
Schelling model


False
Move to random
True
Stay here
Moore
Neumann
\lambda
% of similar
% of similar
Schelling model

What could we expect if we accept some heterogeneity ?
\lambda
=
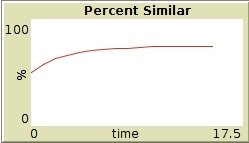
mean of 70 % similar

expected
reality
Schelling model
Play with differents threshold
\lambda
Play with more or less vacancies

experiment on netlogo
Try to identify different states of the Schelling model and place them on this diagram

Try to identify different states of the Schelling model and place them on this diagram
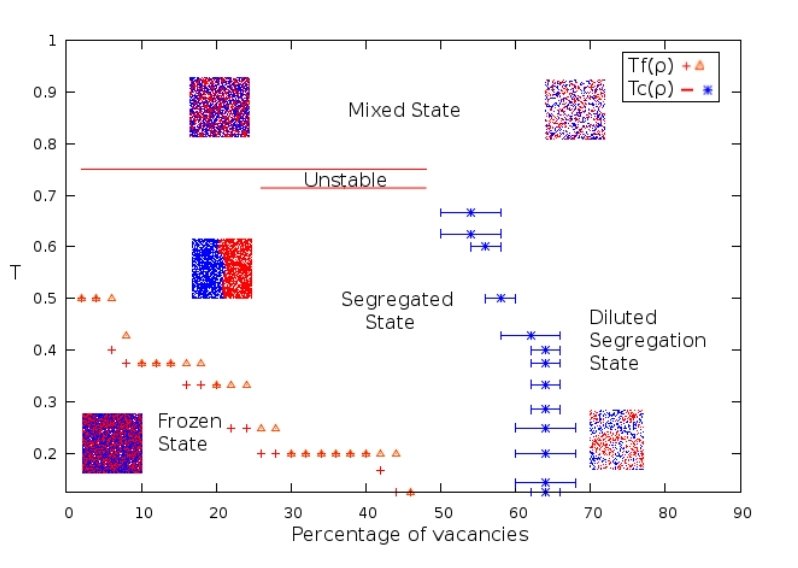
[Gauvin 2009, Daude 2007]
Modelisation ? Simulation ?
+ 20 differents and overlapping reasons to create models
modele ~= simulation model
simplification or facilitation ?
modeling as an achievements or modeling to enlight ?
modeling for a question
( see works of Phan, Varenne, Livet, etc. )
computer substrate
a new empiric reality
equations
objects
stocks
performance ? parcimony ? compression ? understanding ? co-construction ? ...
"rebuilding" the reality
complex dynamics
hard to compare with reality
Knowledge ?
model of simulation
process
entity
choose representation and scales for
patterns
parameters
choose
from reality
=
Virtual Laboratory

An Explanatory goal
Simulation, an old idea in geography
1950
1980
Hägerstrand, Marble, Pitts, etc.
Pumain, Sanders, etc.
Guermond, Langlois, etc.
Chamussy, Le Berre, Uvietta, etc.
Forrester
pioneers
turning point
1970
Wilson
Batty
Ackerman, Chorley, Hagget, Berry, etc .
Prigogine, Allen,
Sanglier, Haken, etc..
conceptual
technical
1990
Couclelis,
Tobler,etc.
Epstein, Doran, etc.
Repeated influences of systemic project (Von Bertallanfy et cie.)
open systems, retro-action, self-organization, equifinality, bifurcation, etc.
[Pouvreau 2013]
~ 1980 in France
Agent Based Modelling
(and social science ...)
[Rey 2015]
Cellular
Automata
Non Linear Dynamical
Systems
ABM, rupture or continuity ?
... an old idea in SHS ...
MC
micro-simulation 1957
[Sanders 2013, Rey 2015]
individual entities ?
James Doran
Archeological simulation 1970
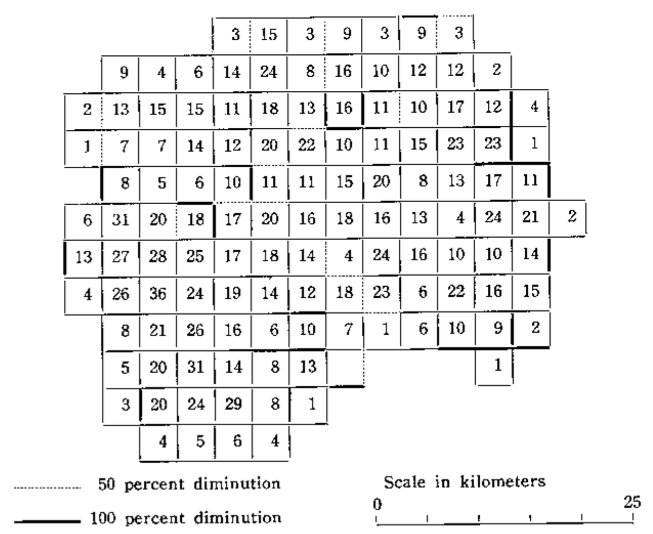
Torsten Hägerstrand
Guy Orcutt
MC
micro-simulation 1953, 1965
bottom-up ?
rules-based ?
Examples ?
Non linear mathematics
Cellular Automata
Agent Based Model
game of life
ants foraging
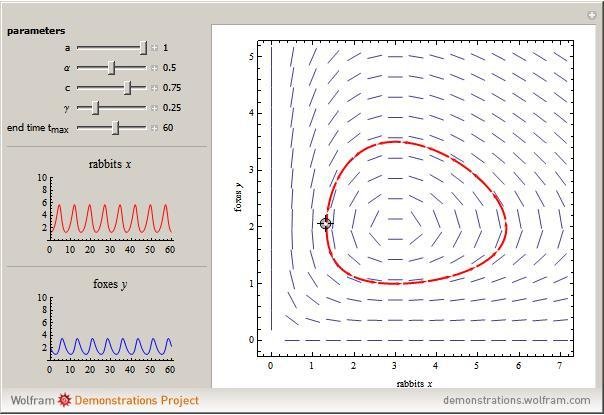
predator-prey
Agent Based Model in geography
The twenty last year part...
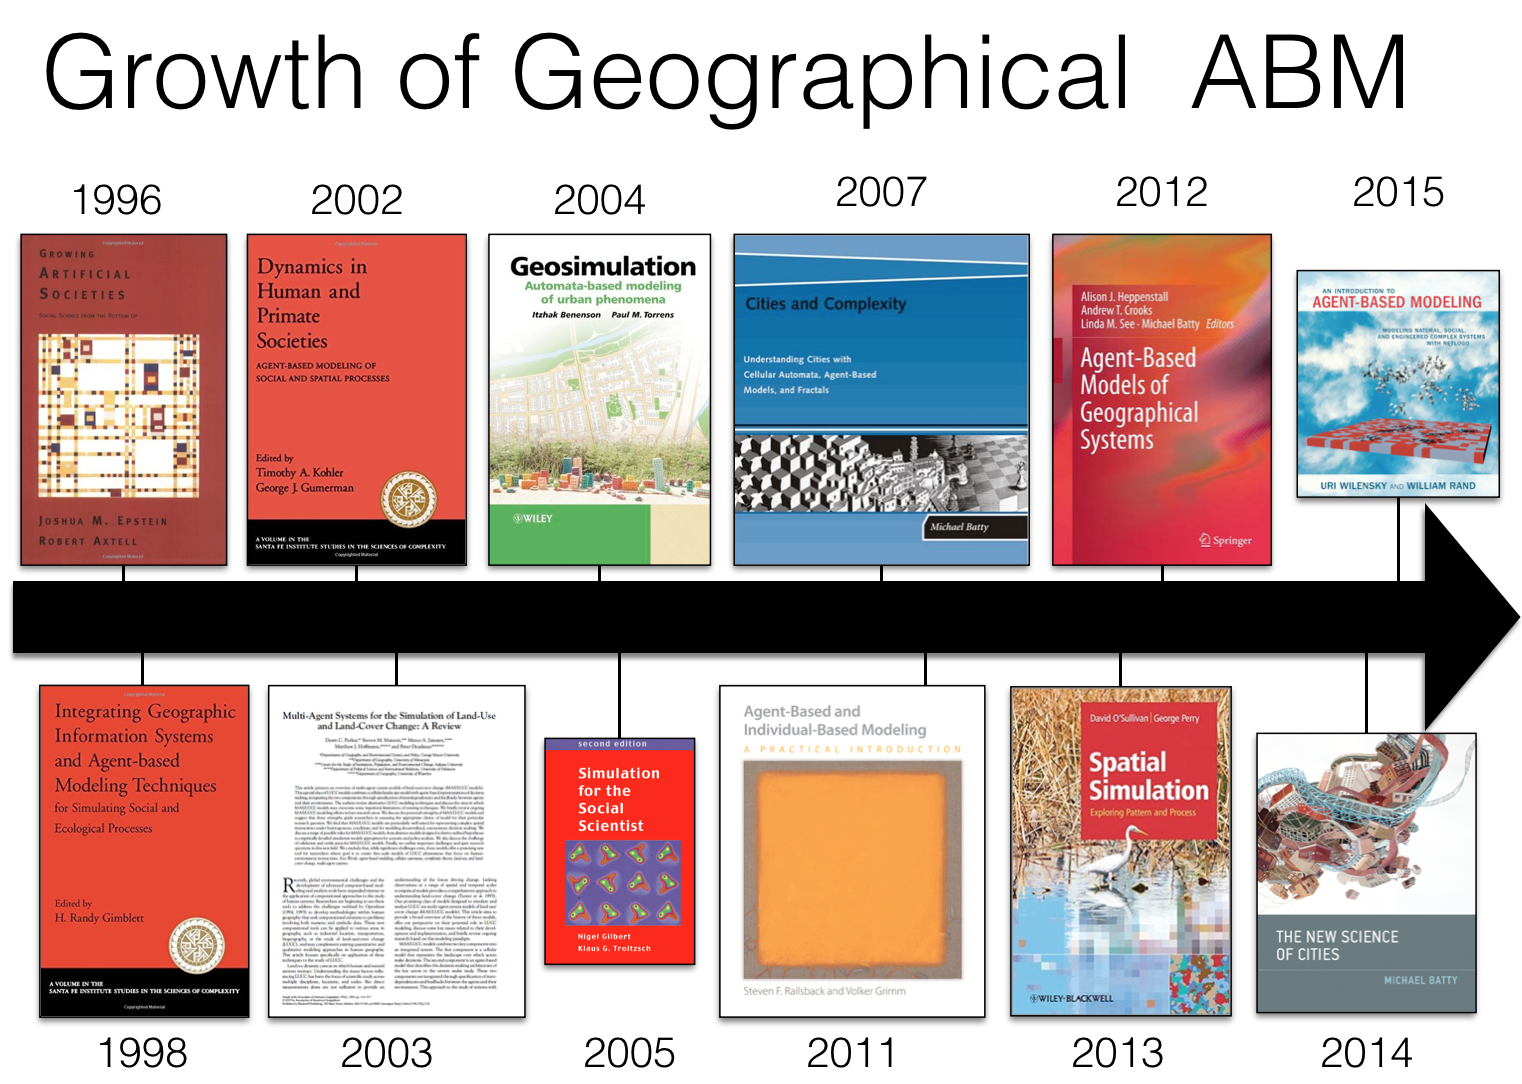
Src : Heppenstal, 20 years of geocomputation 2016
Agent Based Model

Exchange messages
Think
Move and Perceive
Evolve on environment
Act on environment
(more or less ...)
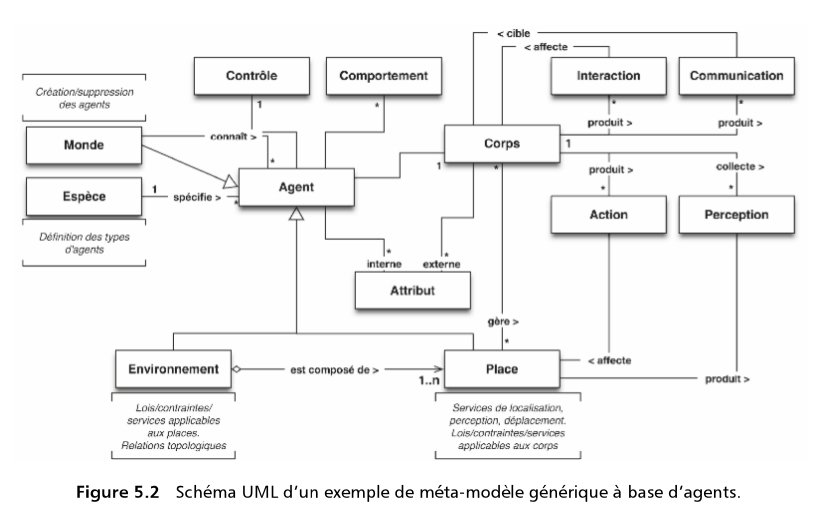
[Ferber 1999, Drogoul 2009]
Agent Based Model
not a model, but a meta-model

city
ant
mosquito
people
tree
[Drogoul Treuil 2008]
Influences of ABM
1970-80
Alan Kay
Oriented
Object Programming
Generic
Ontology
Formalism
Software Evolution
Influences of ABM
Carl Hewitt
Actor model
1973

Software and IA Evolution
Influences of ABM
Jacque Ferber
DAI Computer Scientist at Paris 6
CS Intellectuals Purveyors in SHS
James Doran
DAI Computer Scientist at Essex
DAI in Sociology since 1980's
DAI in archaeology since 1980's
Simulation in archaeology since 1960's
Geography since 1990's
Ecology since 1990's
Influences of ABM
Complexity Theory and Artificial Life ( self organization + emergence)
Simple rules could product complex phenomena
Influences of ABM
Complexity Theory and Artificial Life ( self organization + emergence)
Simple rules could product complex phenomena
Von Neumman & Arthur Burks
1966
CA, ABM and ...
... Artificial Life ?
Langton
"Artificial Life"
~1980 SFI
Bach Group
Burks, Axelrod,
Holland, etc.
Cybernetics
(Wiener, Mc Culloch)
Swarm
platform
Biology & GST
(Bertallanfy)
BCL of
Von Foerster
AutoPoeise
(Maturana & Varela)
Biology &
Evolutionary computation (M. Conrad)
Logo / Turtle
S. Papert & M. Minsky
Bioinformatics
A. Lindermayer

Bioinformatics
& Ecology
P. Hoggeweg
Starlogo
M. Resnick
Phy, Eco, Geo
Y. Prigogine ULB team
Logo's
platform

ECAL conf

SFI
CS
J. Ferber
[Rey 2015]
Introducing Netlogo platform
Logo langage 1966
Seymour Papert
First turtle 1969-70
to square
repeat 4 [forward 50 right 90]
end
1928 - 2016
Introducing Netlogo platform
StarLogo
& Netlogo
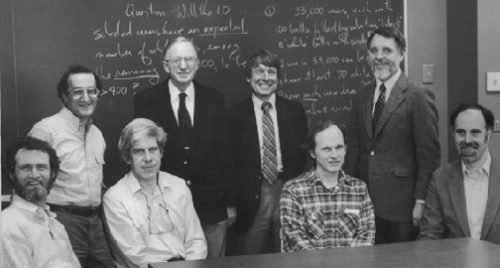
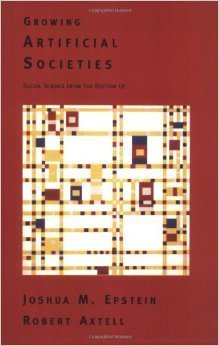
Joshua Epstein
Social Simulation Conference 2015
Sugarscape model
KISS
KIDS
Stylized
Particular
[Sanders & Banos 2011, 2013, Banos 2013]
Schelling
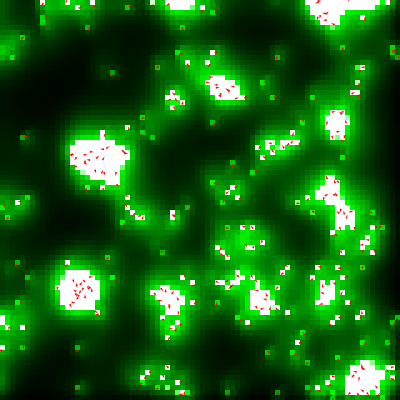
Sugarscape
Sugarscape model
max sugar by patch
world - n * n patch -

Sugarscape model
Sugarscape model

limited vision, growing sugar
Sugarscape model

Sugarscape model

Sugarscape model
more rules ?


farm workers
farm owners
tax

https://hal.archives-ouvertes.fr/hal-01094421
Collectif MAPS :
Sugarscape model

reproduction
Sugarscape model
play with tax and note observation
| Tax | 0.05 | 0.10 | 0.20 | 0.30 |
|---|---|---|---|---|
| Gini | ||||
| Total population | ||||
| % capitalist | ||||
| % farmers | ||||
| Mean ressources farm owners | ||||
| Mean ressources farm workers |
value at ticks = 2000
| Tax | 0.05 | 0.10 | 0.20 |
|---|---|---|---|
| Gini | 0,40 | 0.28 - 0.38 | 0.35 - 0.38 |
| Total population | 430 | 250 | 240 |
| % capitalist | 5 | 12 | 20 |
| % farmers | 95 | 88 | 80 |
| Mean ressources capitalist | 25 | 28 | 26 |
| Mean ressources farmers | 22 | 22 | 23 |
not so big differences between roles ... need some new visualisation ...

smaller population, higher share of farm workers, more inequalities
... possible collapse of system or
new equilibrium ...
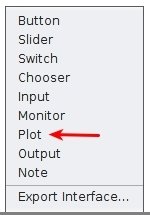
add some new visualisations
right clic in blank zone in interface
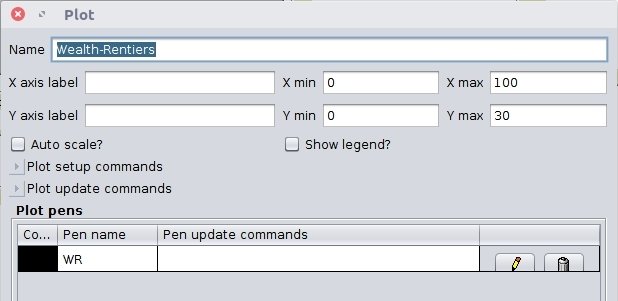
change pen name
change plot name
change xy

advanced pen
mode "Bar"
| name | pen name | interval |
|---|---|---|
| Wealth-Rentiers | WR | 5 |
| Wealth-Recoltants | WRe | 5 |
parameters for 2 plots
Sugarscape model
Go to "code" tab, and add this source code ...
;; .... At the end of this function ....
;; .... add this code to plot Distribution of Wealth

to update-lorenz-and-gini-plots

    ; ... some code ...

    set-current-plot "Wealth-Rentiers"
      set-current-plot-pen "WR"
      if any? turtles with [class = ClasseRentier]
        [histogram [sugar] of turtles with [class = ClasseRentier] ]

        set-current-plot "Wealth-Recoltants"
      set-current-plot-pen "WRe"
      if any? turtles with [class = ClasseRécoltant]
        [histogram [sugar] of turtles with [class = ClasseRécoltant] ]

end
Sugarscape model
... then return to "interface" tab, and relaunch simulation
Play with catastrophe ...
Sugarscape model
Multiple states for the same system
Resilient : same state before and after catastrophe
New equilibrium : all red dead, only blue
Collapse : everyone is dead
| Tax | 0.05 | 0.10 | 0.20 | 0.30 | 0.40 |
|---|---|---|---|---|---|
| Little catastroph | resilient | ||||
| medium catastroph | |||||
| Big catastroph | |||||
| Cataclysme |
Sugarscape model
Sugarscape model

switching role

| Tax | 0.05 | 0.10 | 0.20 | 0.30 | 0.40 |
|---|---|---|---|---|---|
| Little catastroph | resilient | ||||
| medium catastroph | |||||
| Big catastroph | |||||
| Cataclysme |
Simpop Local model
KISS
KIDS
Stylized
Particular
[Sanders & Banos 2011, 2013, Banos 2013, Schmitt 2014]
Schelling
Sugarscape
Simpop Local
SimpopLocal
historical context
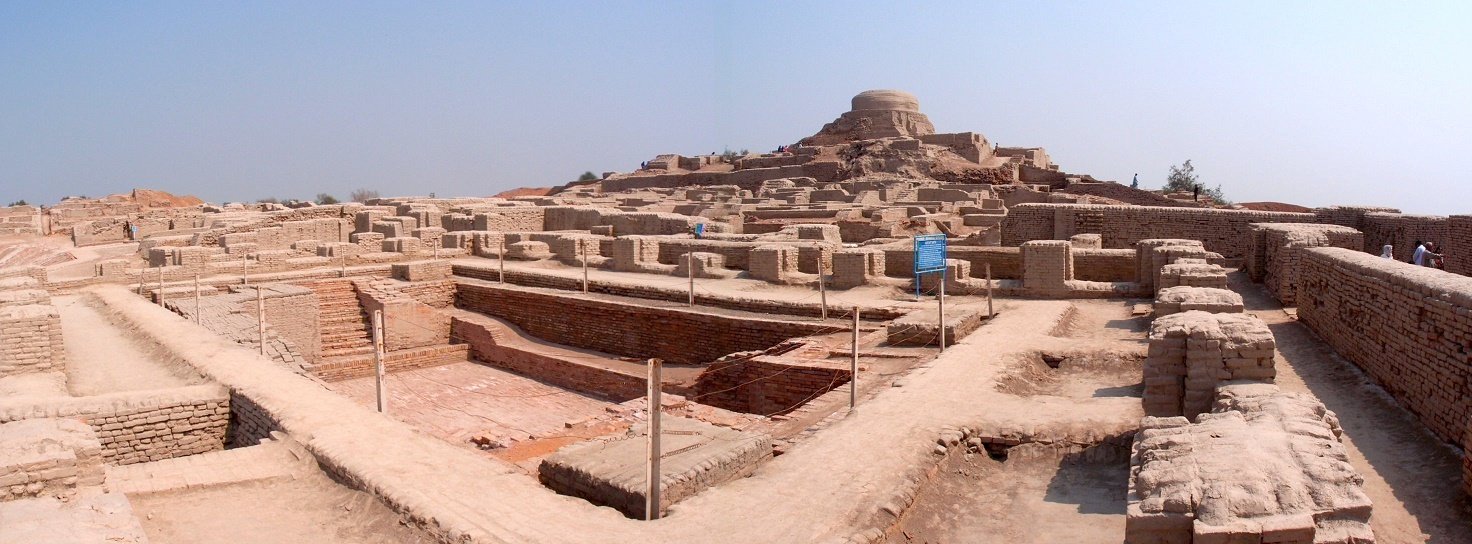
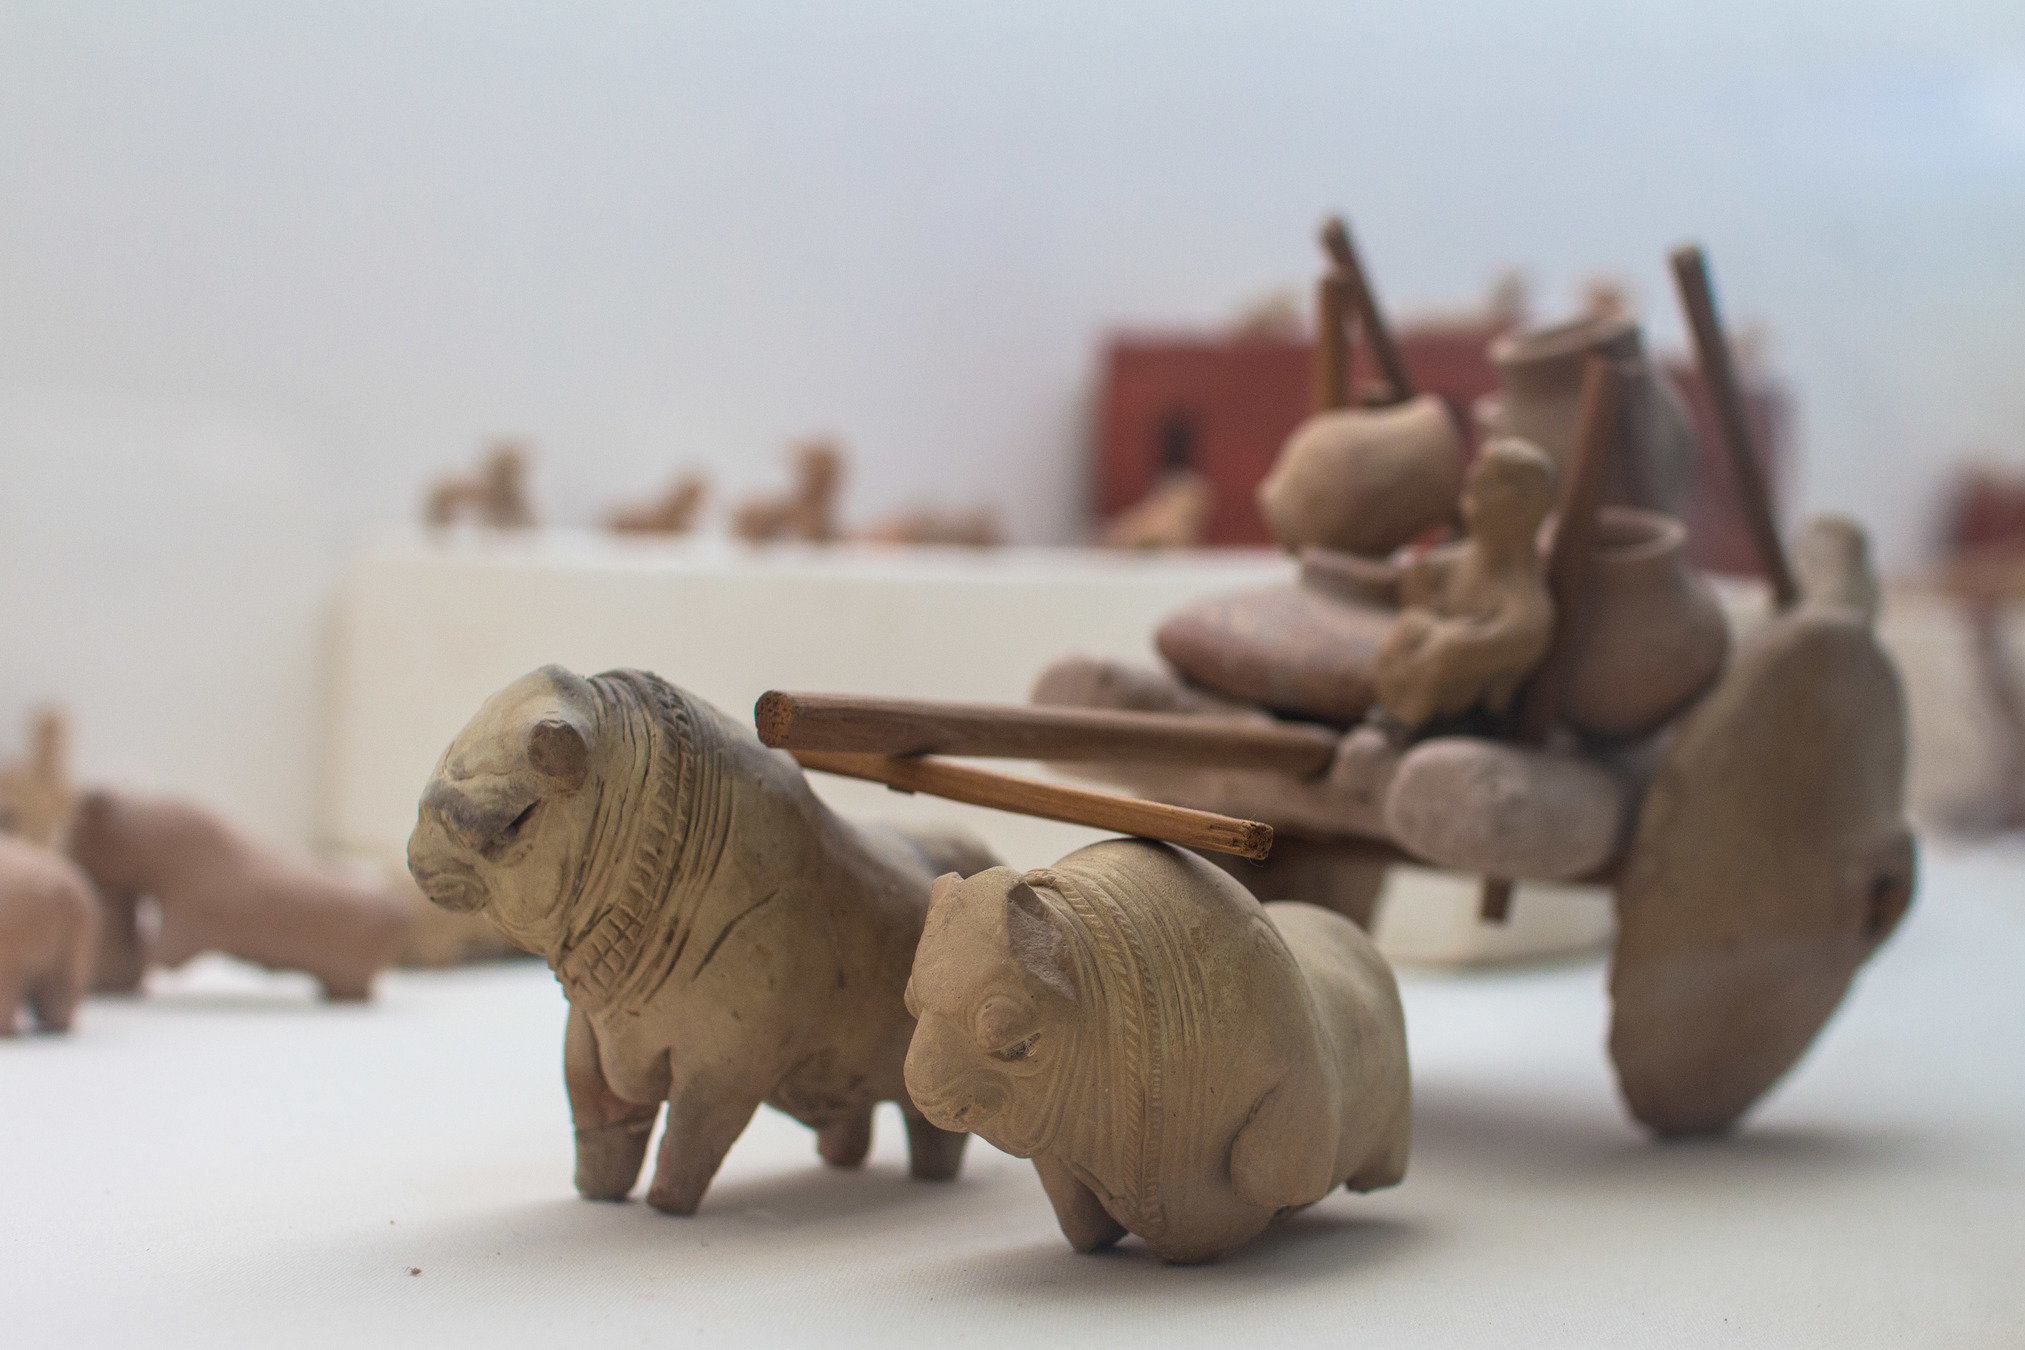
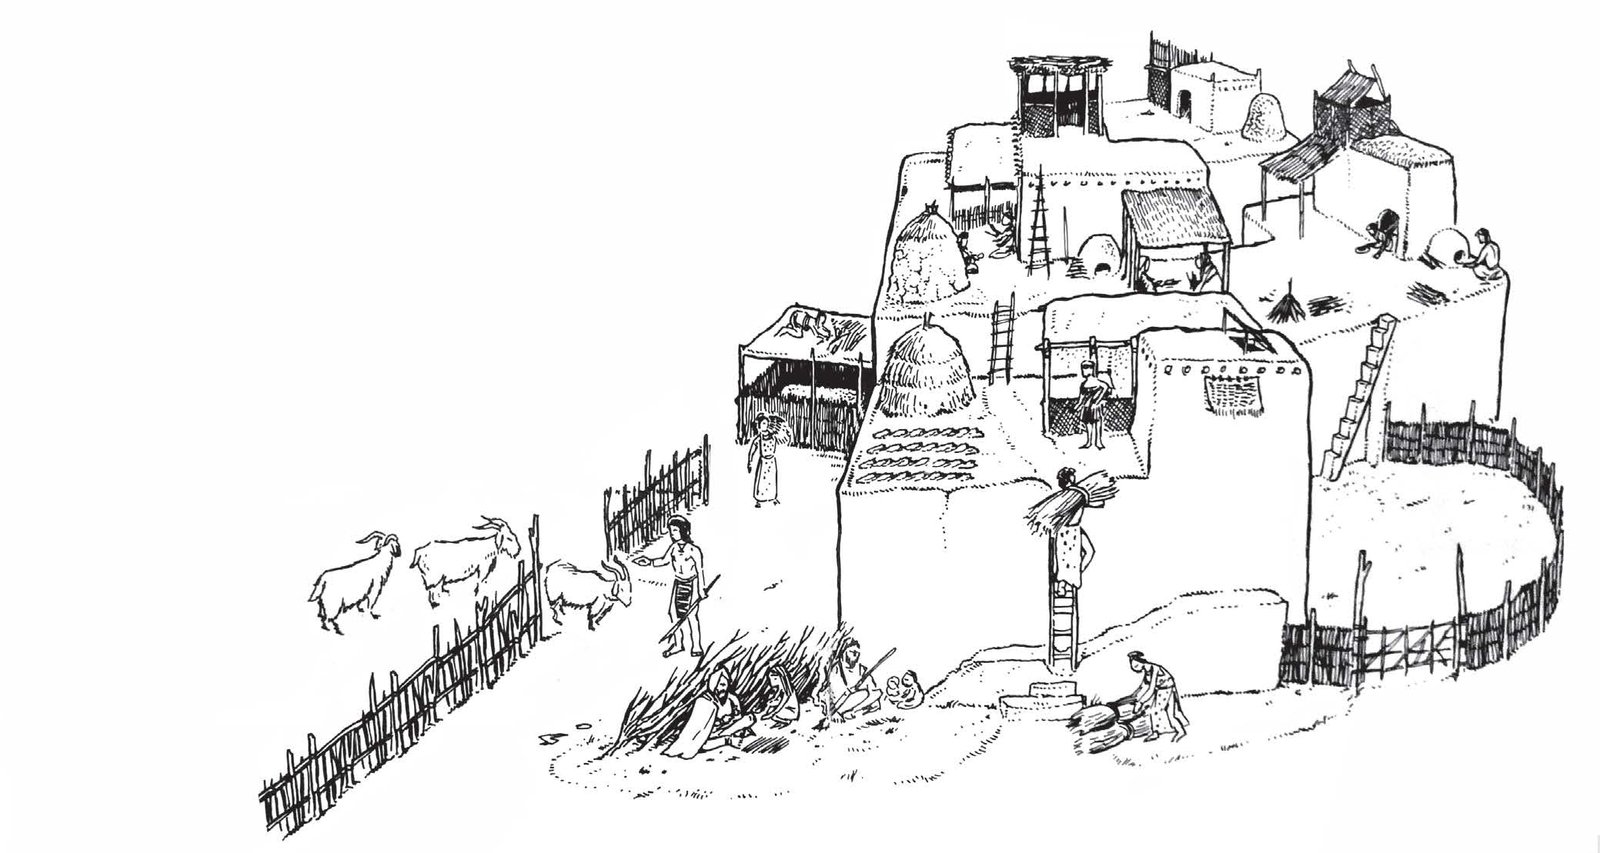
Mohenjodaro, pakistan ~ 3000 BC
urban site of
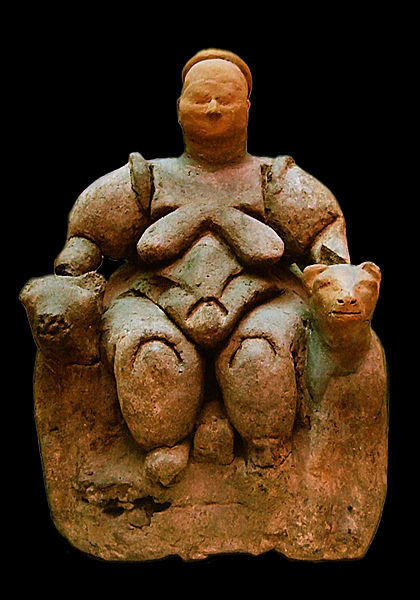
settlements site of
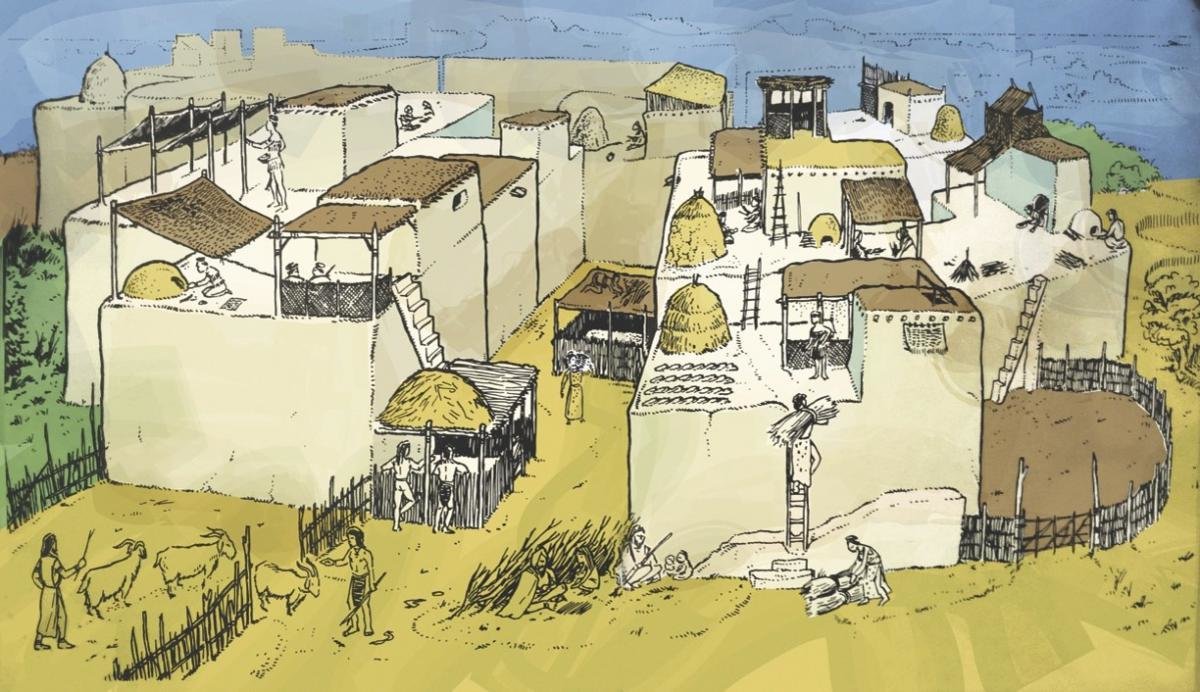
Çatalhöyük , turkey ~ 8000 BC
[Schmitt 2014, 2015]
[Rey 2015 ]
SimpopLocal
data / theory
Mohenjodaro, pakistan ~ 3000 BC
Christaller type of settlements localisation
South Germany systems of cities, 1933
[Christaller 1933]
[Liu 1996]
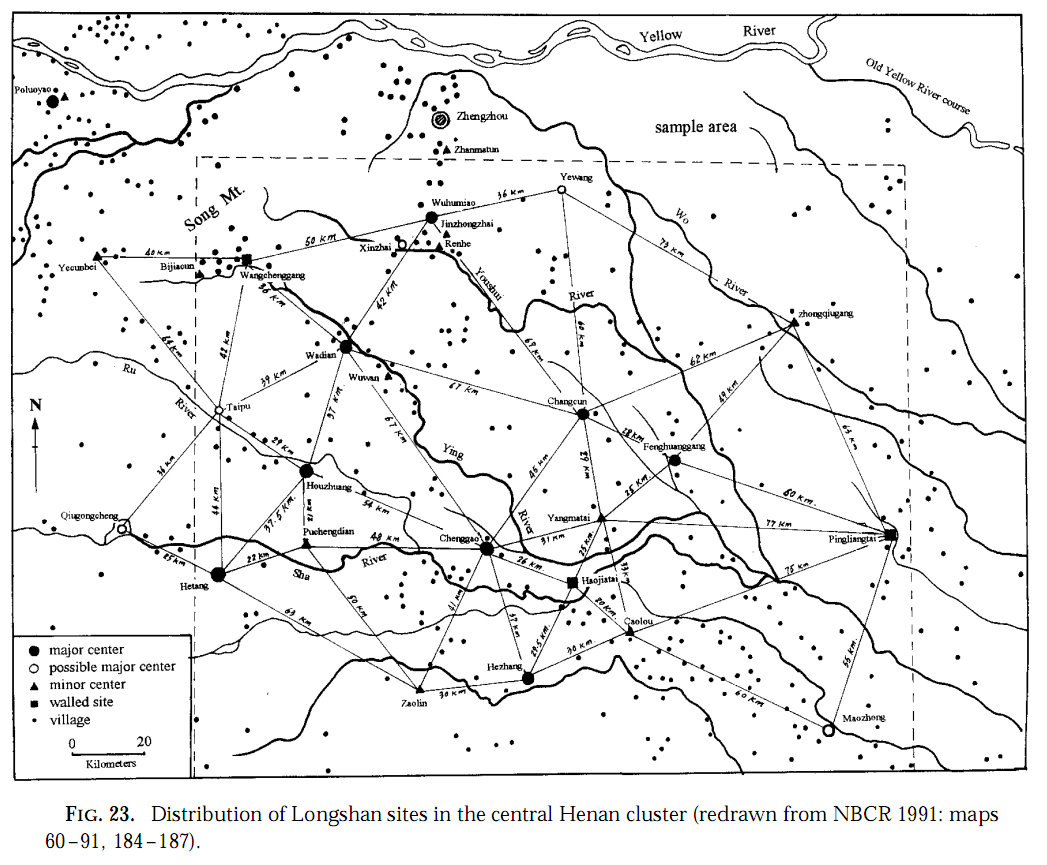
SimpopLocal
data / theory
Rank-Size empiric law in different
space and time
France (1860 - 1990)
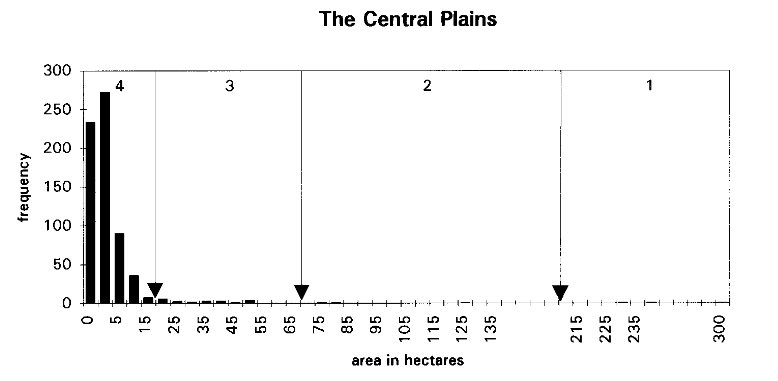
North China neolithic settlements
[Guerin Pace & al. 1990]
[Liu 1996]
SimpopLocal
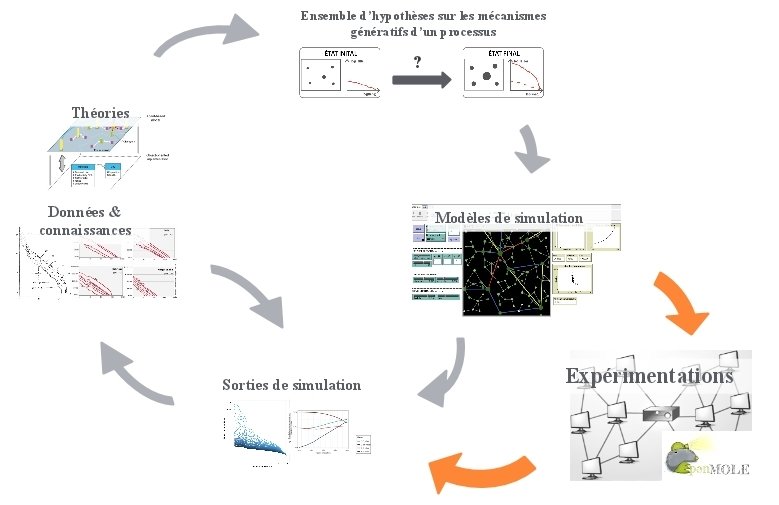
hypothesis

Which mecanisms we need to introduce to reproduce this empiric law ?
Need a multi-factorial point of view !!
A lot !
SimpopLocal
hypothesis
Why we need different point of view ?
geographers
archeologists
1
2
3
4
1
2
3
"Cumulative knowledge in social science"
"We're not in a logic of proof"
[Pumain 2005]
[Besse 2000]
SimpopLocal
way of building
archeologists
geographers
parameters & mecanisms & patterns
calibration
exploration
SimpopLocal
initial condition
settlements
with population constrained by local ressources
Christaller type
localisation on 2D grid
exchanges between settlements limited by distance
SimpopLocal
rules
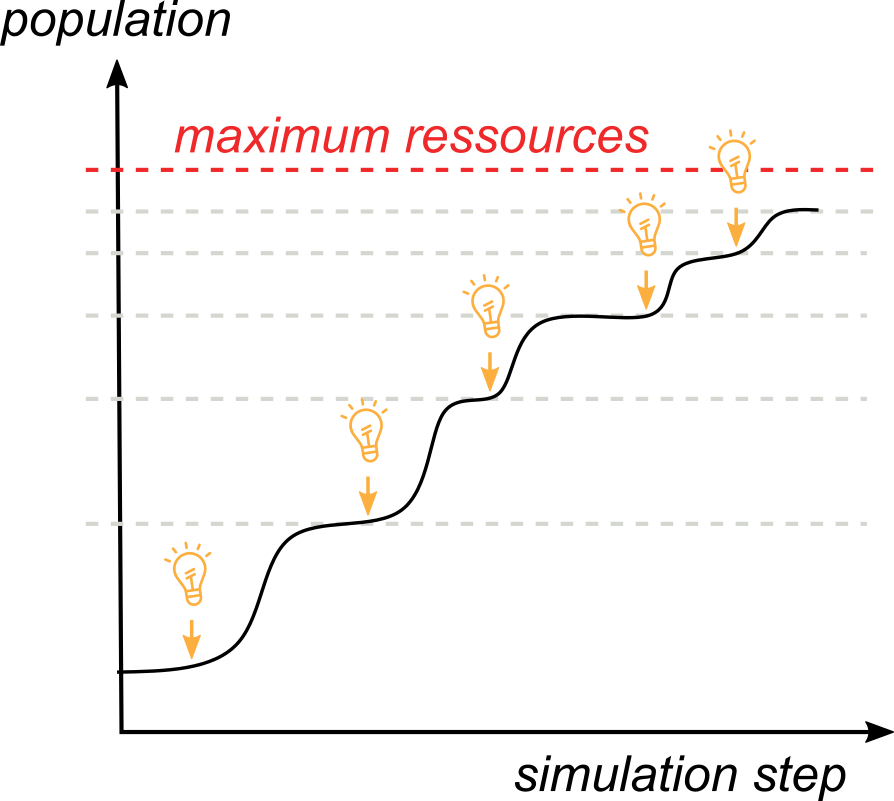
people create innovation by interaction
intra-settlements

SimpopLocal
rules
people diffuse innovation by interaction
inter-settlements
SimpopLocal
Individualised OR aggregated representation ?
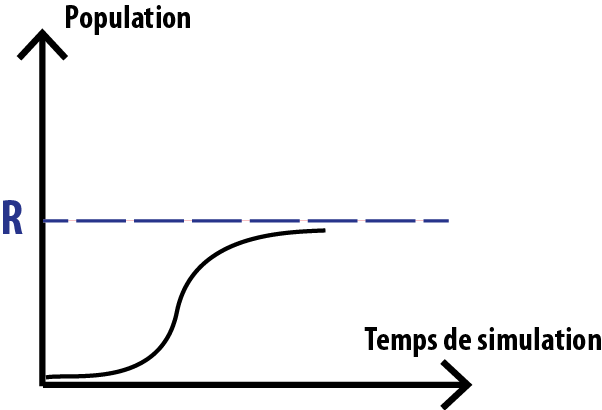
Population (stock value) function of available ressources (stock value)
Verhulst model
SimpopLocal
Creation and Diffusion of innovations between settlements are simulated using a binomial law
Individualised OR aggregated representation ?

SimpopLocal
Individualised OR aggregated representation ?
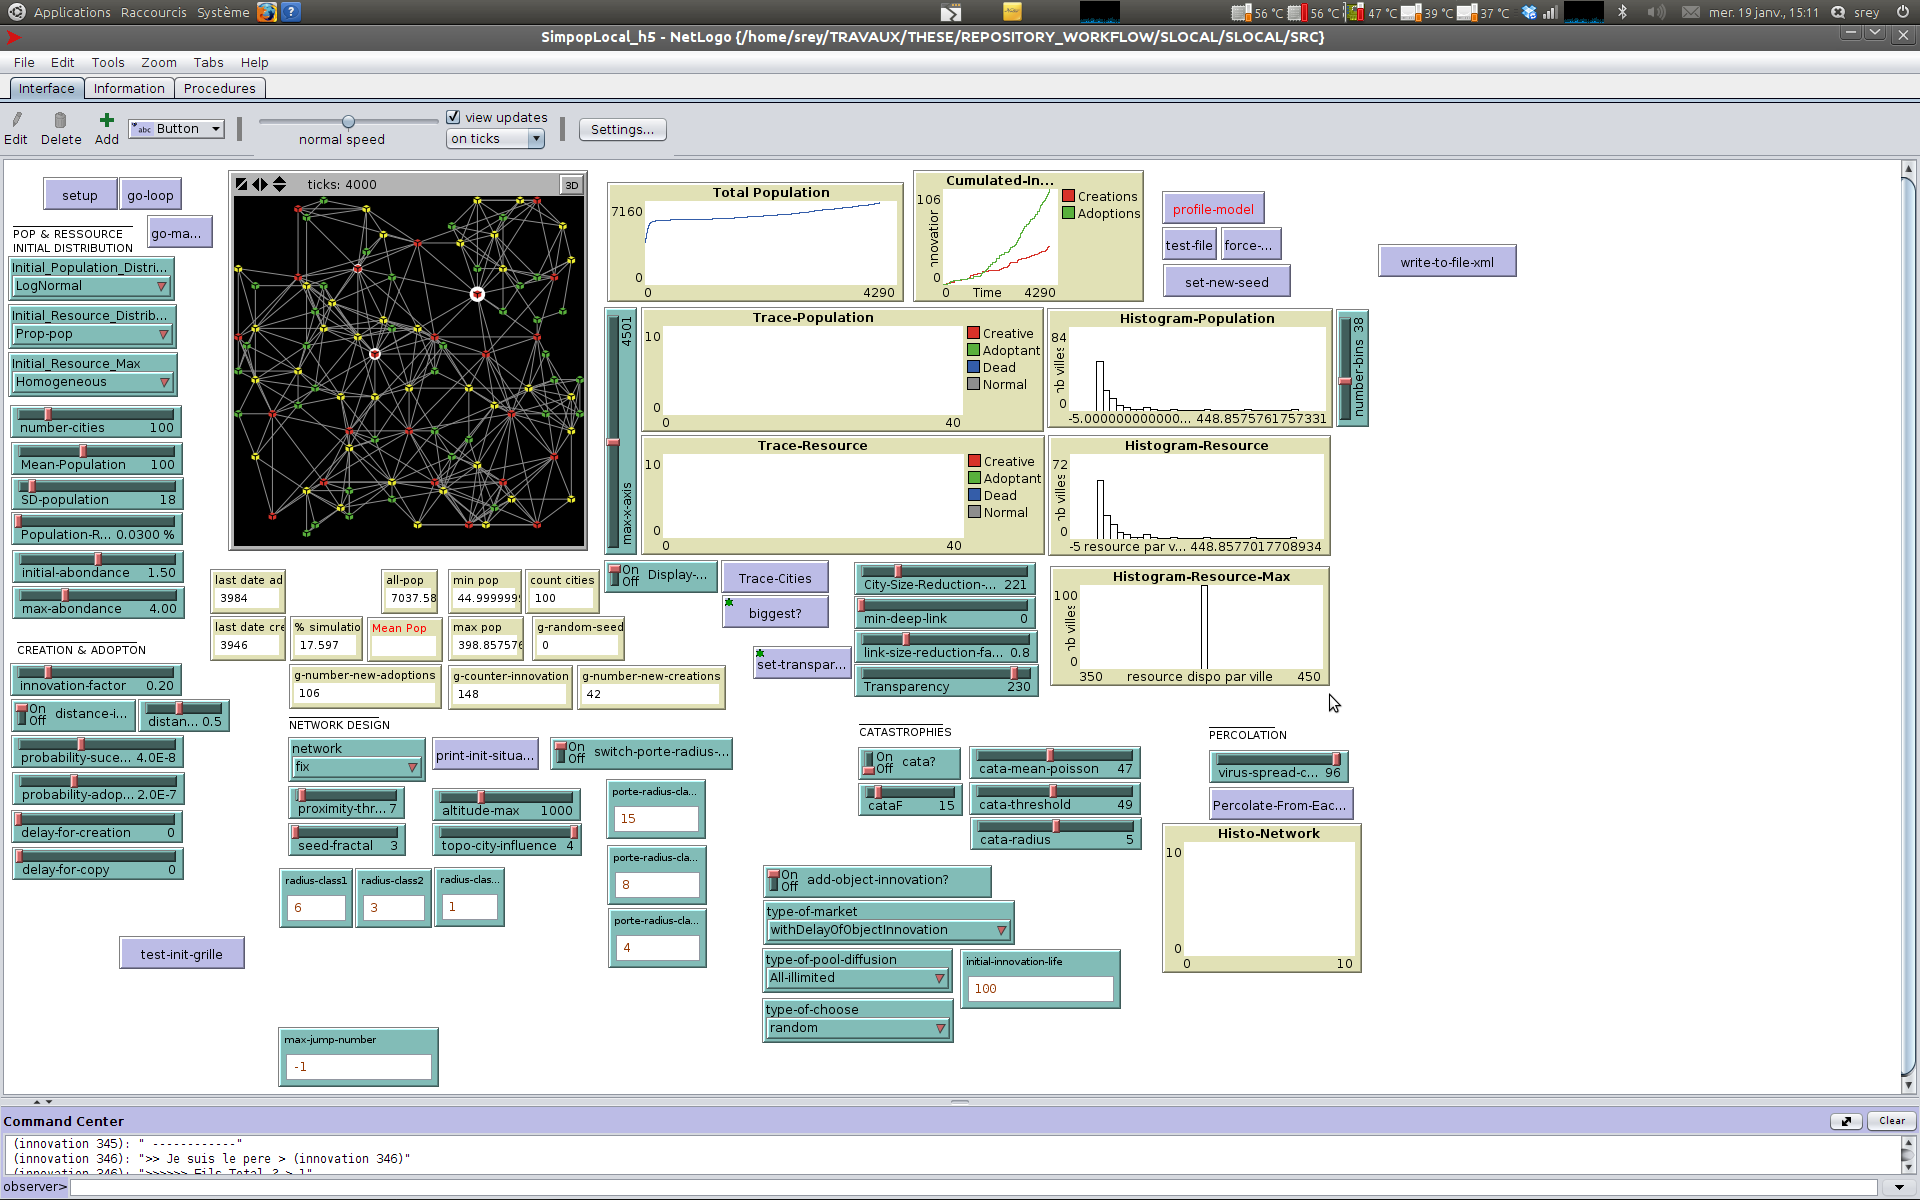
SimpopLocal 2010 - 2013, before rewriting
SimpopLocal
back to the initial question and experiment with model
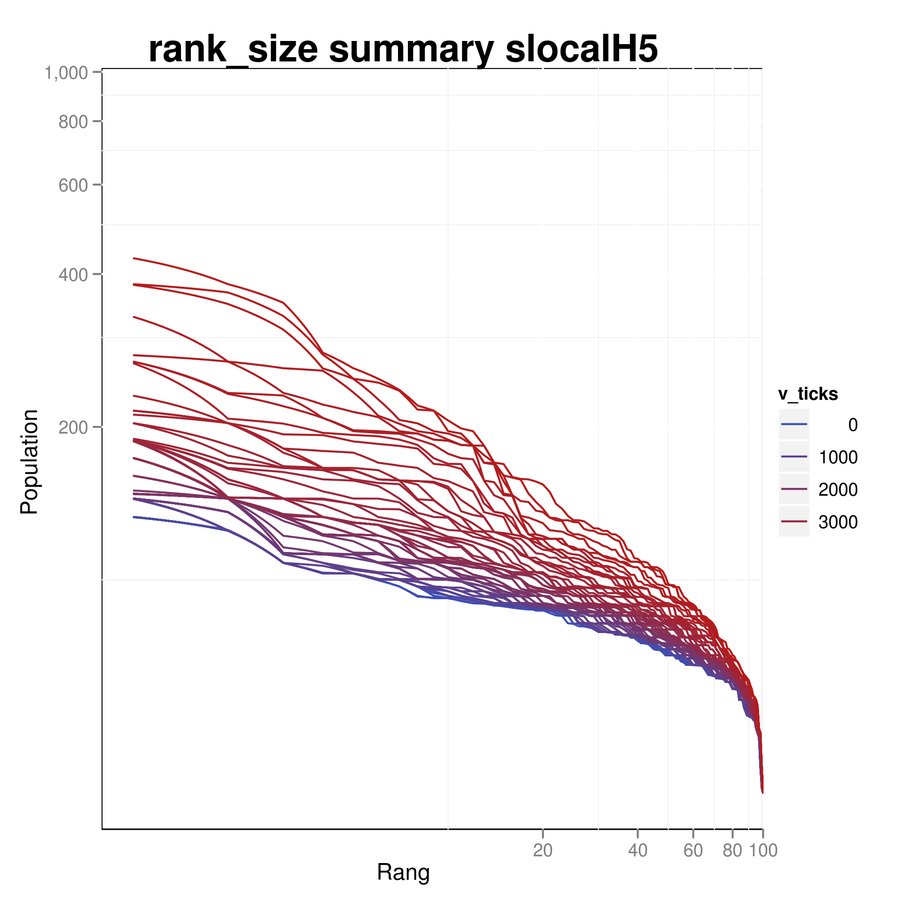
4000 step = 4000 years
~ 10000 habitants
log-normal
distribution
is it possible ?
output_rank.csv
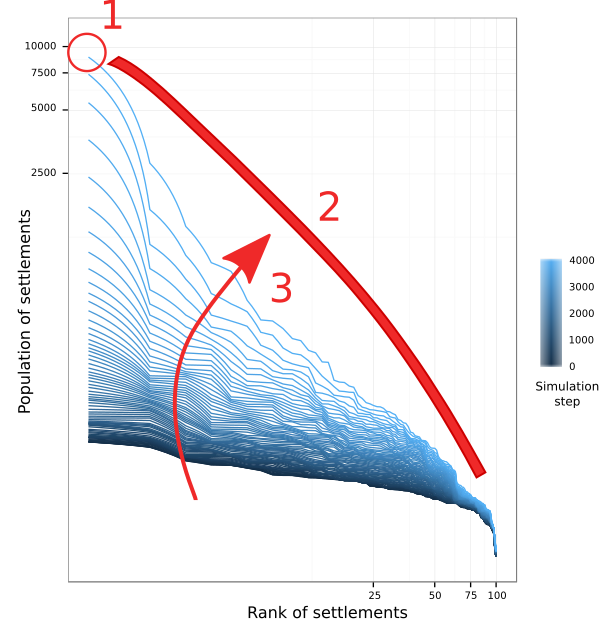
SimpopLocal
back to the initial question and experiment with model
is it possible ?
| Parameters | value | |
|---|---|---|
| number of innovation | 10000 | max object innovation in model |
| Innovation Factor | [ 0 - 2 ] ? | Impact of innovation on ressources |
| probability creation | [ 0 - 1 ] ? | probability of innovation creation |
| probability adoption | [ 0 - 1 ] ? | probability of innovation adoption |
| distance impact | [ 0 - 4 ] ? | effect of distance on innovation diffusion |
| population rate | ~ 2% | growth rate of population |
| innovation life | 4000 | life of one innovation |
| ressources max | max-abondance * Mean-Population | Maximum carrying capacity on settlements |
SimpopLocal
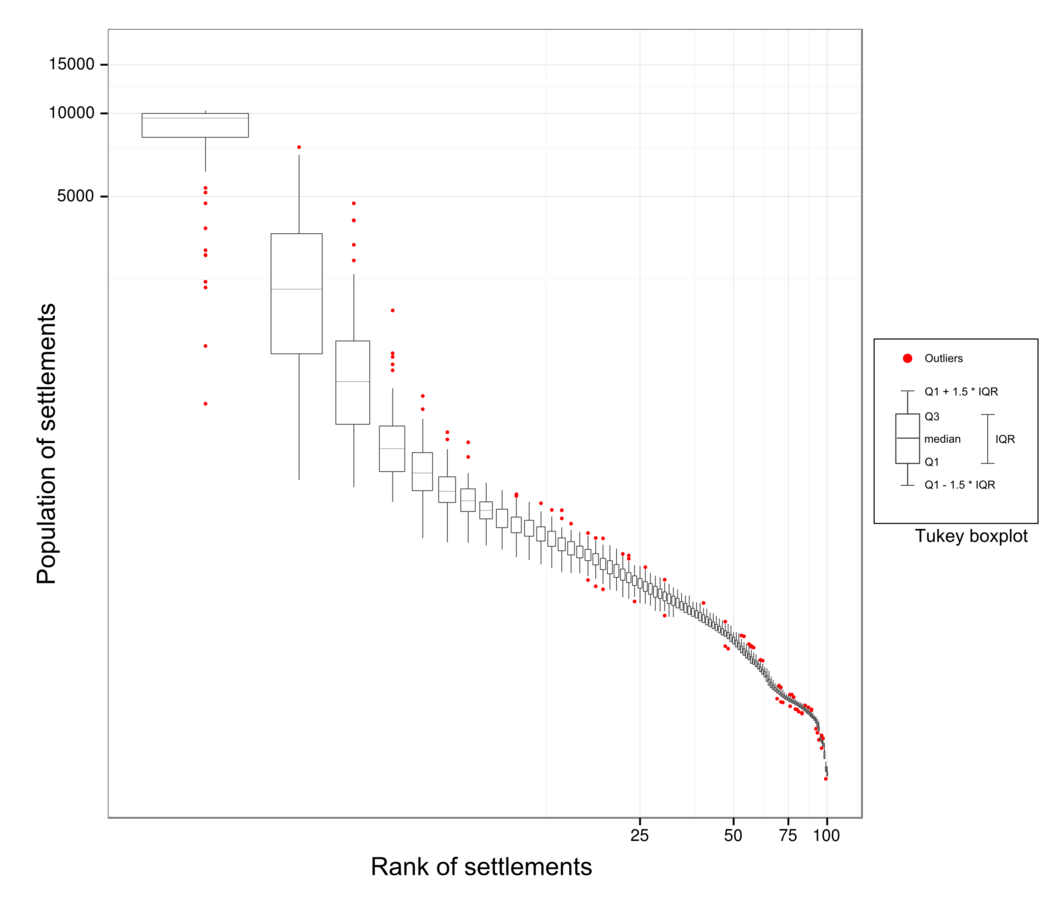
impossible to found the "perfect" pattern manually

SimpopLocal
Trying to make a more systematic evaluation using classic design experiment ?
- 30 replication
- 5 parameters (5 Dim )
- discretized in 10 step
" Curse
Dimensionality "

3 Millions of graphics
100 000 resumed graphics

+ dim
SimpopLocal
asking "optimization algorithms" to found the good pattern for us :)
is it possible/impossible ?
how ? how much ?
it is a bug ?
| Parameters | value |
|---|---|
| number of innovation | 10000 |
| Innovation Factor | 0.00787 |
| probability creation | 1.22 E -06 |
| probability adoption | 7.4 E -07 |
| distance impact | 0.688 |
| population rate | ~ 2% |
| innovation life | 4000 |
| ressources max | 10259 |
formalizing objectives
Results
Half a billion simulations: evolutionary algorithms and distributed computing for calibrating the SimpopLocal geographical mode
EPB 2015
Clara Schmitt,
Sébastien Rey-Coyrehourcq,
Romain Reuillon,
Denise Pumain
- 500 Millions of simulations, 2000 processors on five days, 25 years of computation -
Simulation Workshop
By sebastien rey coyrehourcq


