How do biologists find meaning in their
(large, messy, nuanced) data?
Sidney Bell (@sidneymbell)
Chan Zuckerberg Initiative, BioVis 2020
Data exploration
requires
shifting your
field of
view
Bedford
Static views lose information and context

Computational skills
Domain knowledge
(Most important tool in science)

"Thanks. But can you remake the figure in
blue and green, add another variable and
put it all on a log scale?"
The goal: work
ourselves (mostly)
out of a job
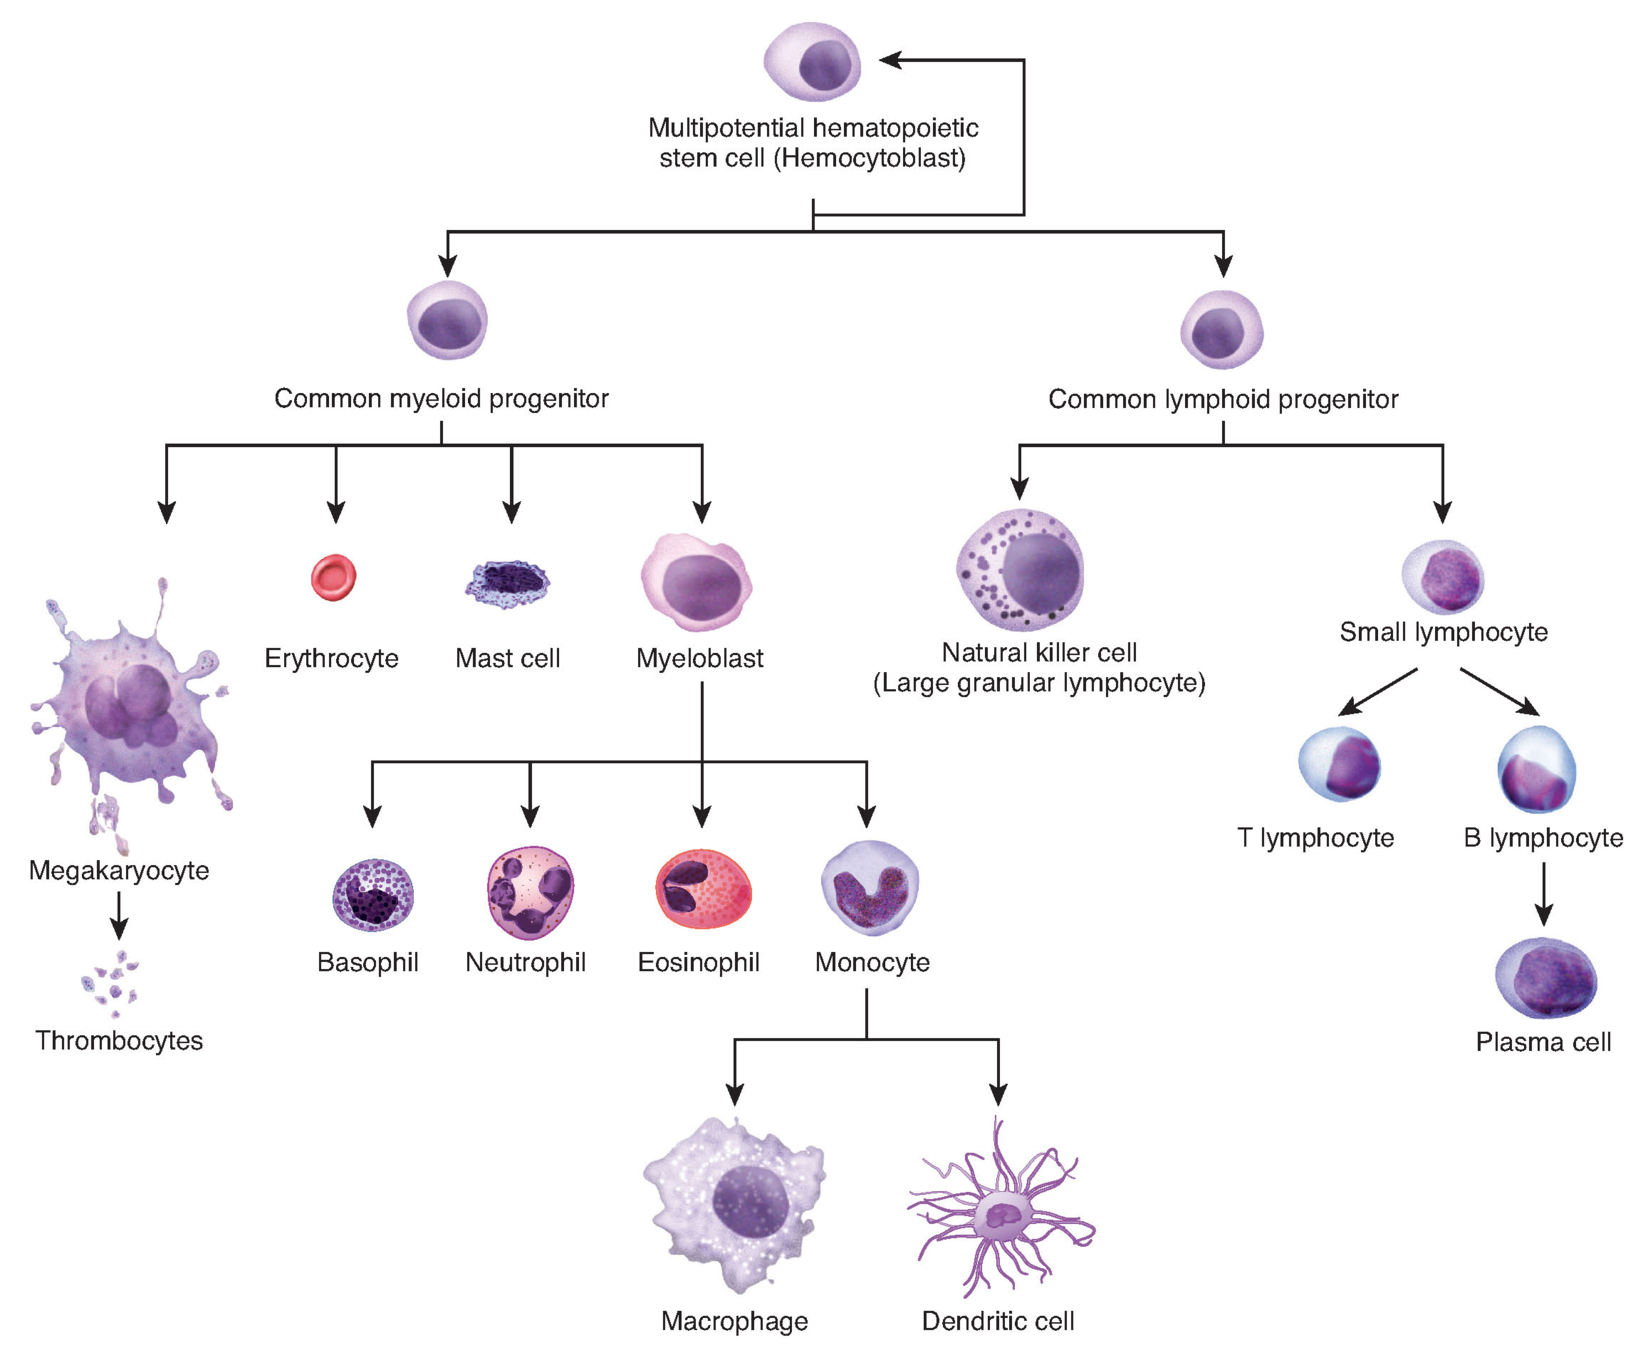
Single cell biology
Generalizable
Large matrices
Genomic epidemiology
Domain specific
Medium trees


Helping scientists get hands on with their data
with Colin Megill, Bruce Martin, Charlotte Weaver
Ambrose Carr, Lia Prins, Seve Badajoz, Brian McCandless, Angela Pisco, Marcus Kinsella, Genevieve Haliburton, Paolo, Justin Kiggins, Fiona Griffin, Arathi Mani, Matthew Weiden, Madison Dunitz, Signe Chambers, Timmy Huang, Trent Smith, Brian Raymore, Jeremy Freeman, Jonah Cool
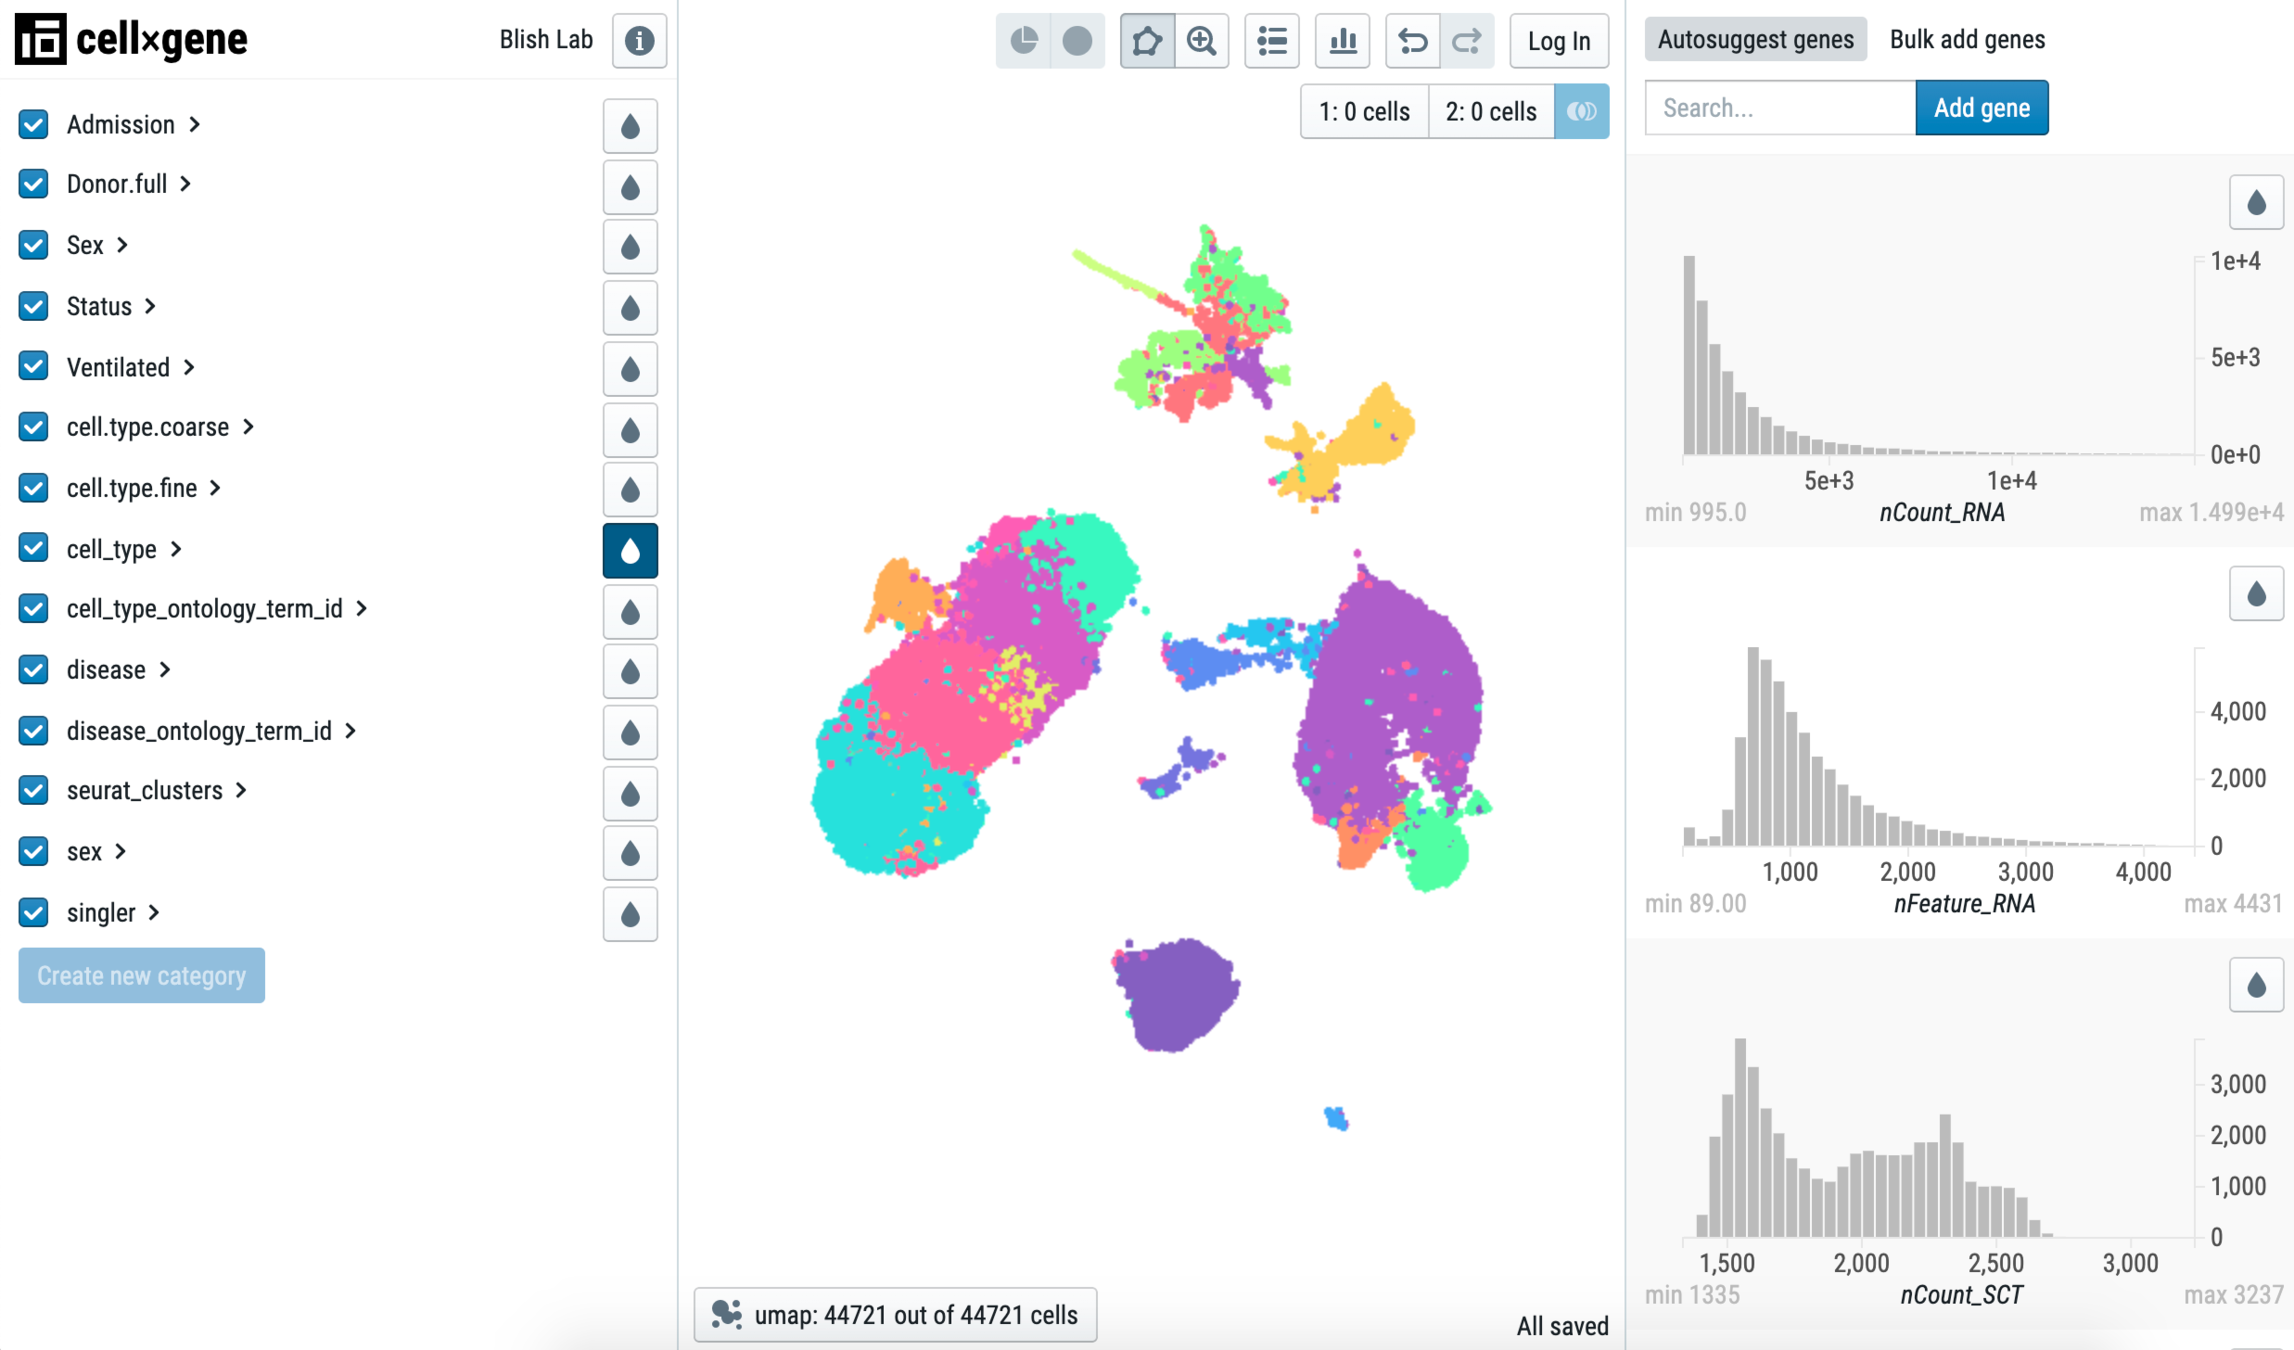
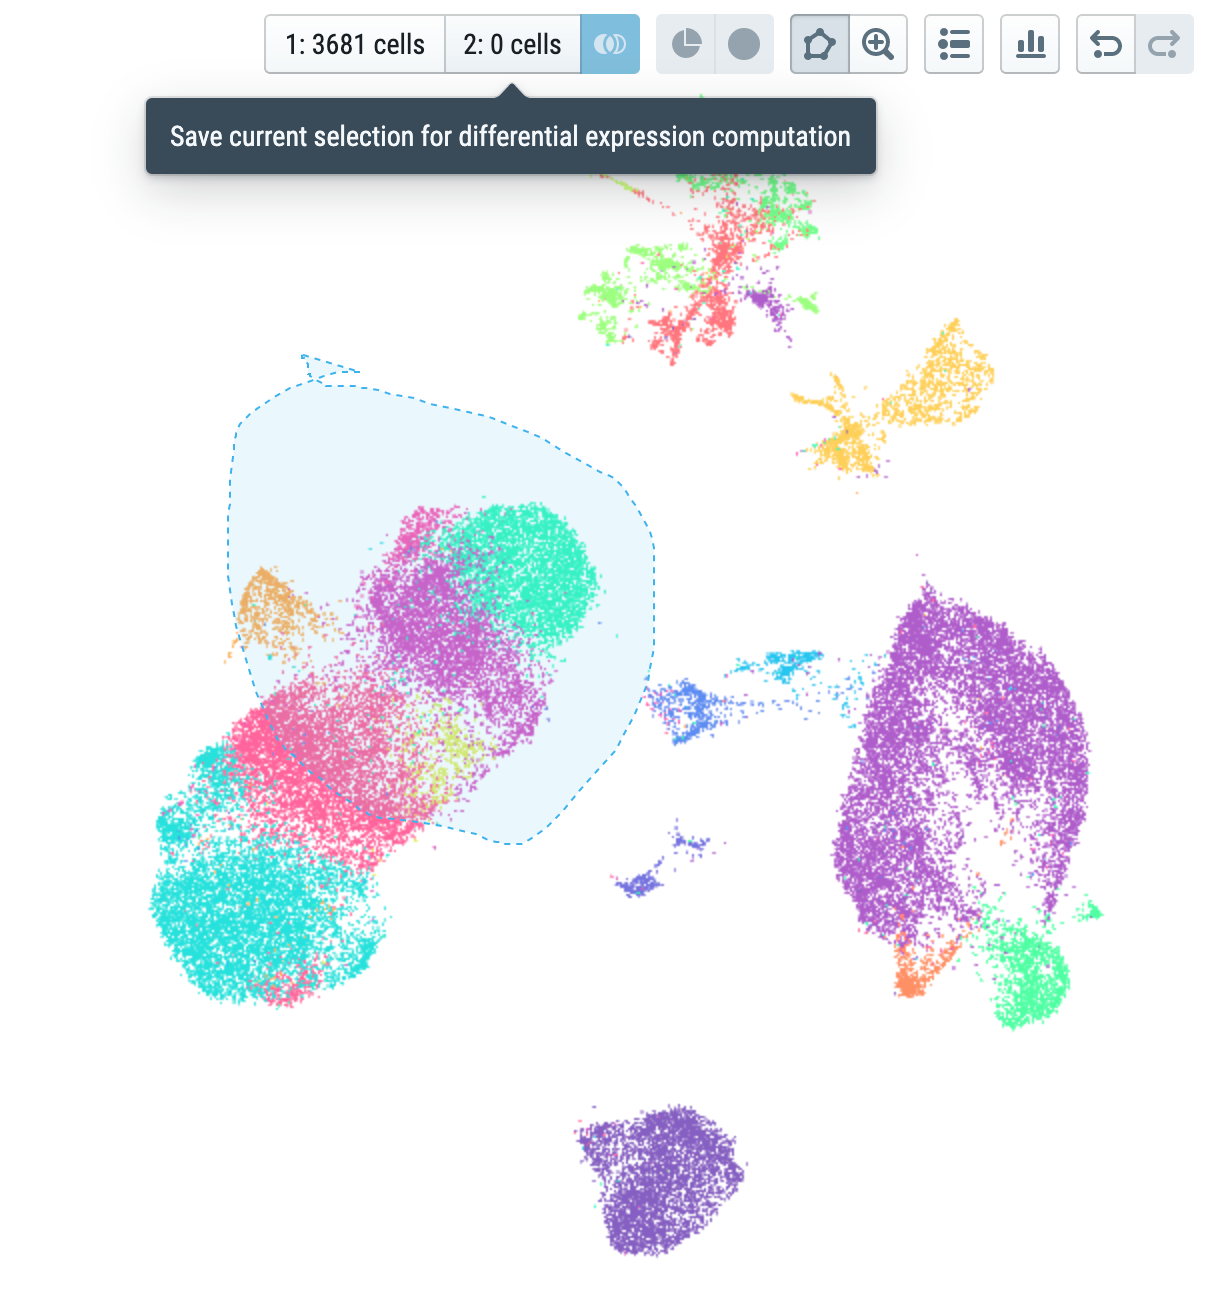
An interactive data explorer for
single-cell transcriptomics datasets
Ratios of gene usage determine cell type
bc open textbooks
Cellxgene matrices
bc open textbooks
cells
genes
metadata
SARS-CoV-2 infection & immune cells

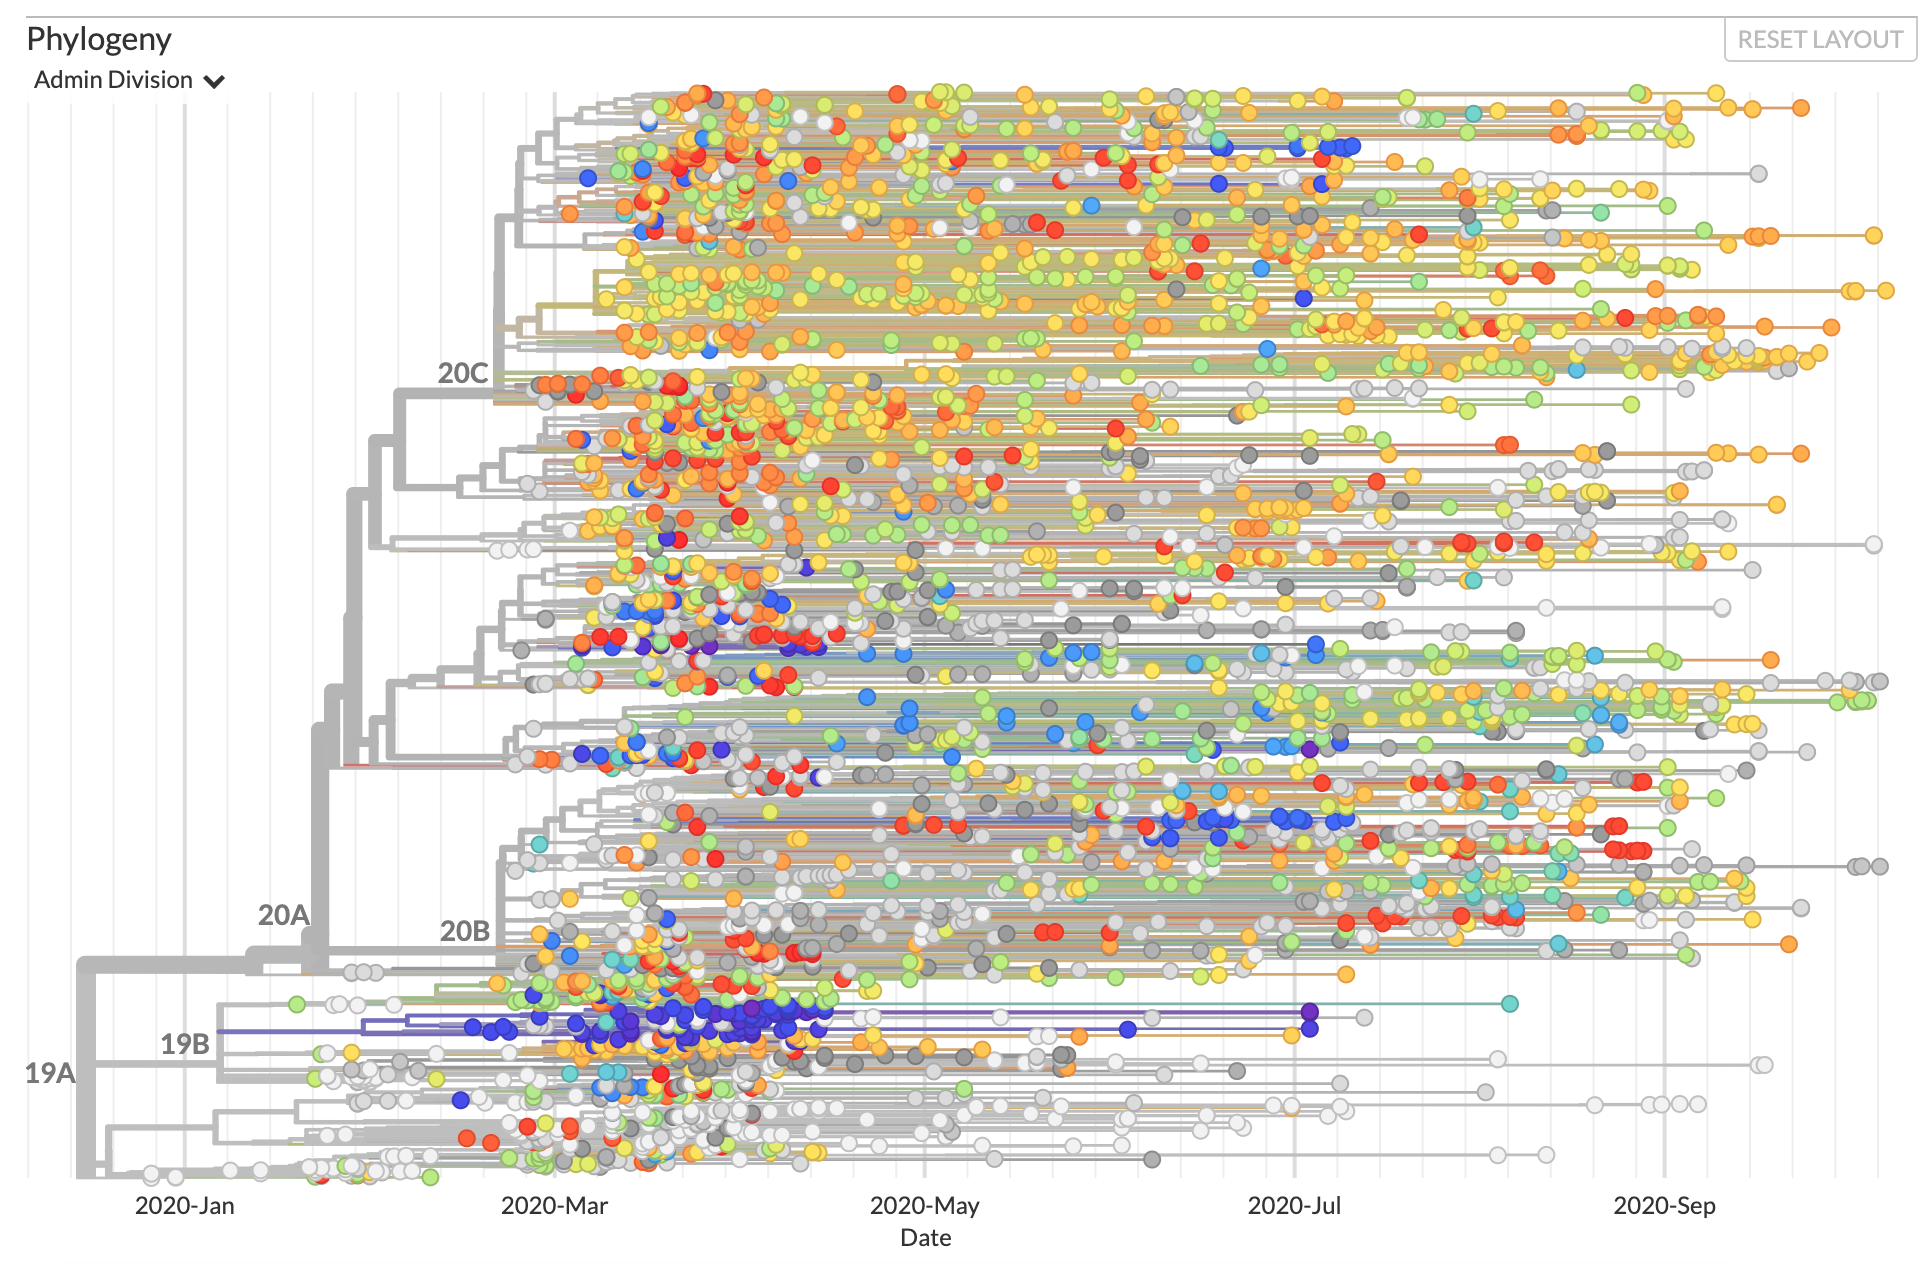
Open-source project for genomic epidemiology of pathogens
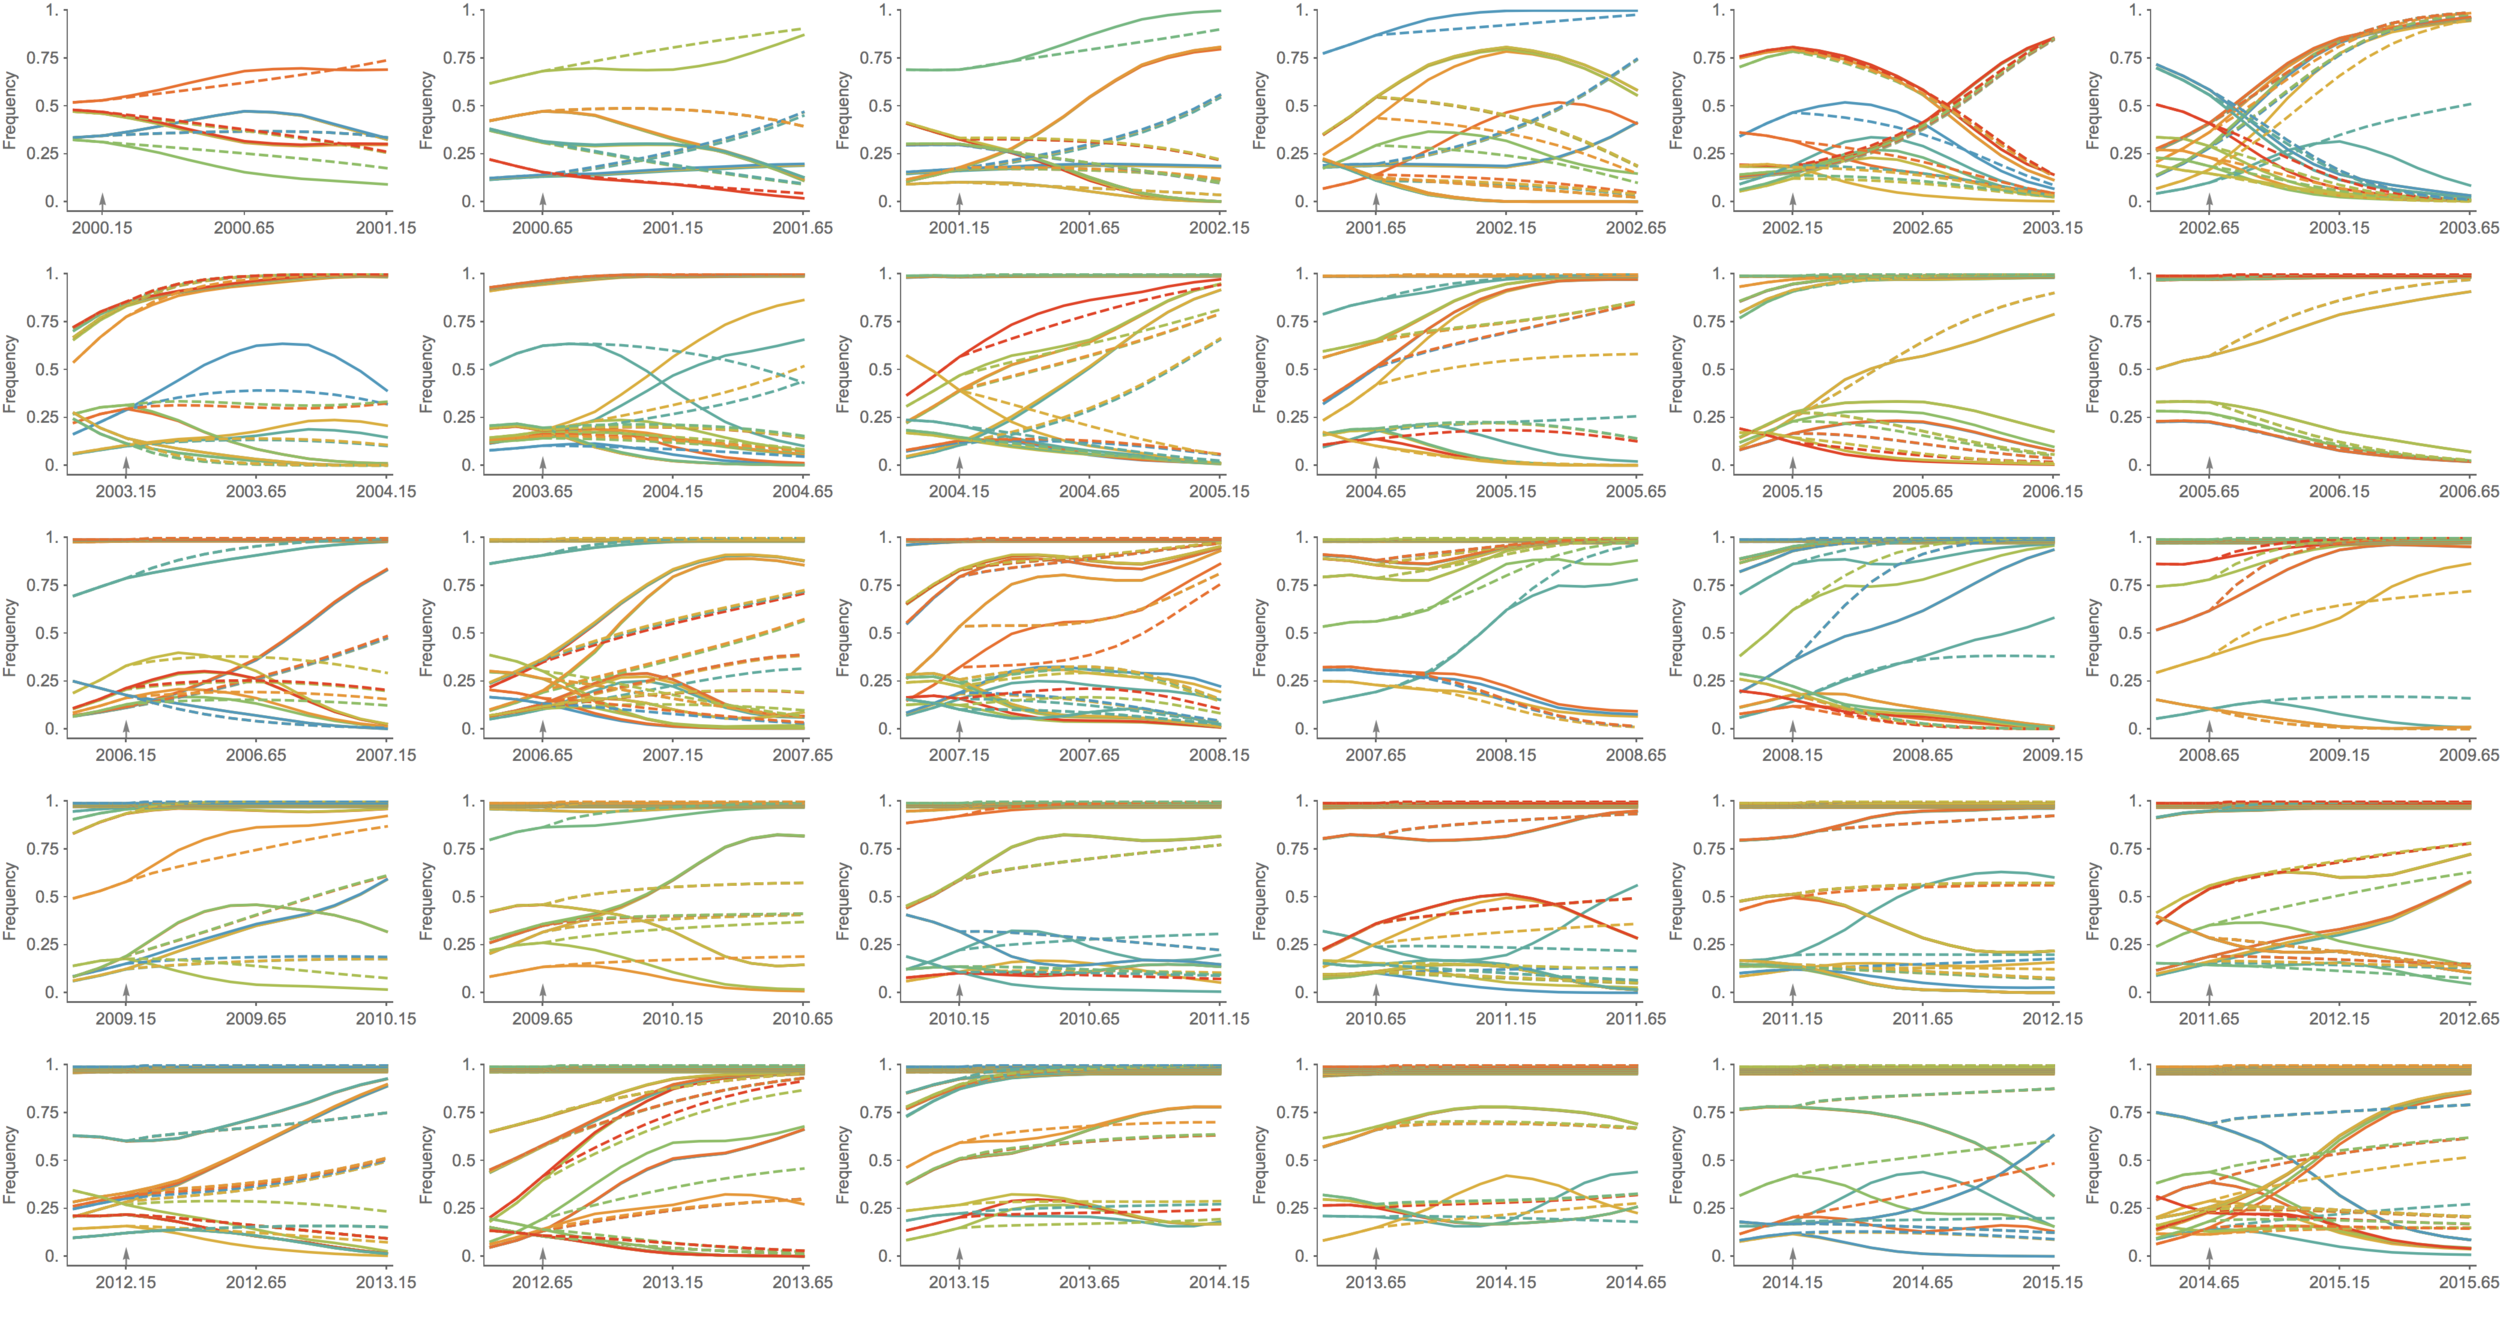
Viruses evolve and spread on similar timescales
Grubaugh, Nature Micro, 2019

ACTT
ACTT
ACGT
ACGT
ACGA
Shared mutations indicate shared transmission history
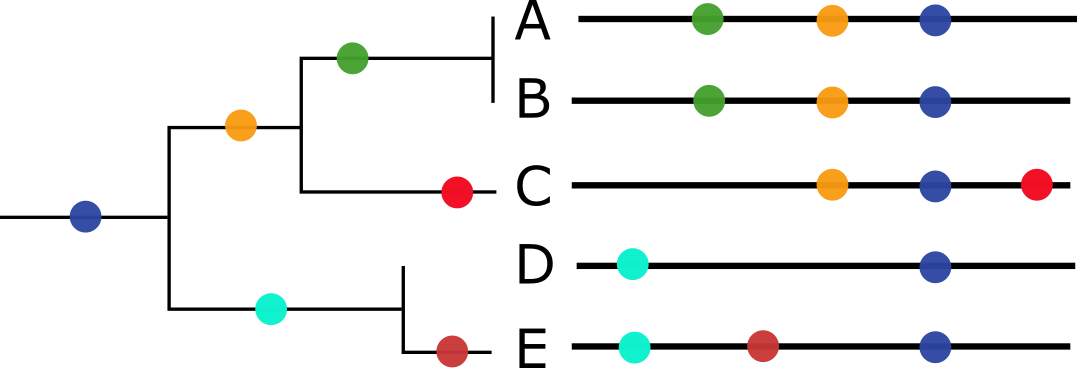
A
C
D
E
B
Shared mutations indicate shared transmission history
Shared mutations indicate shared transmission history
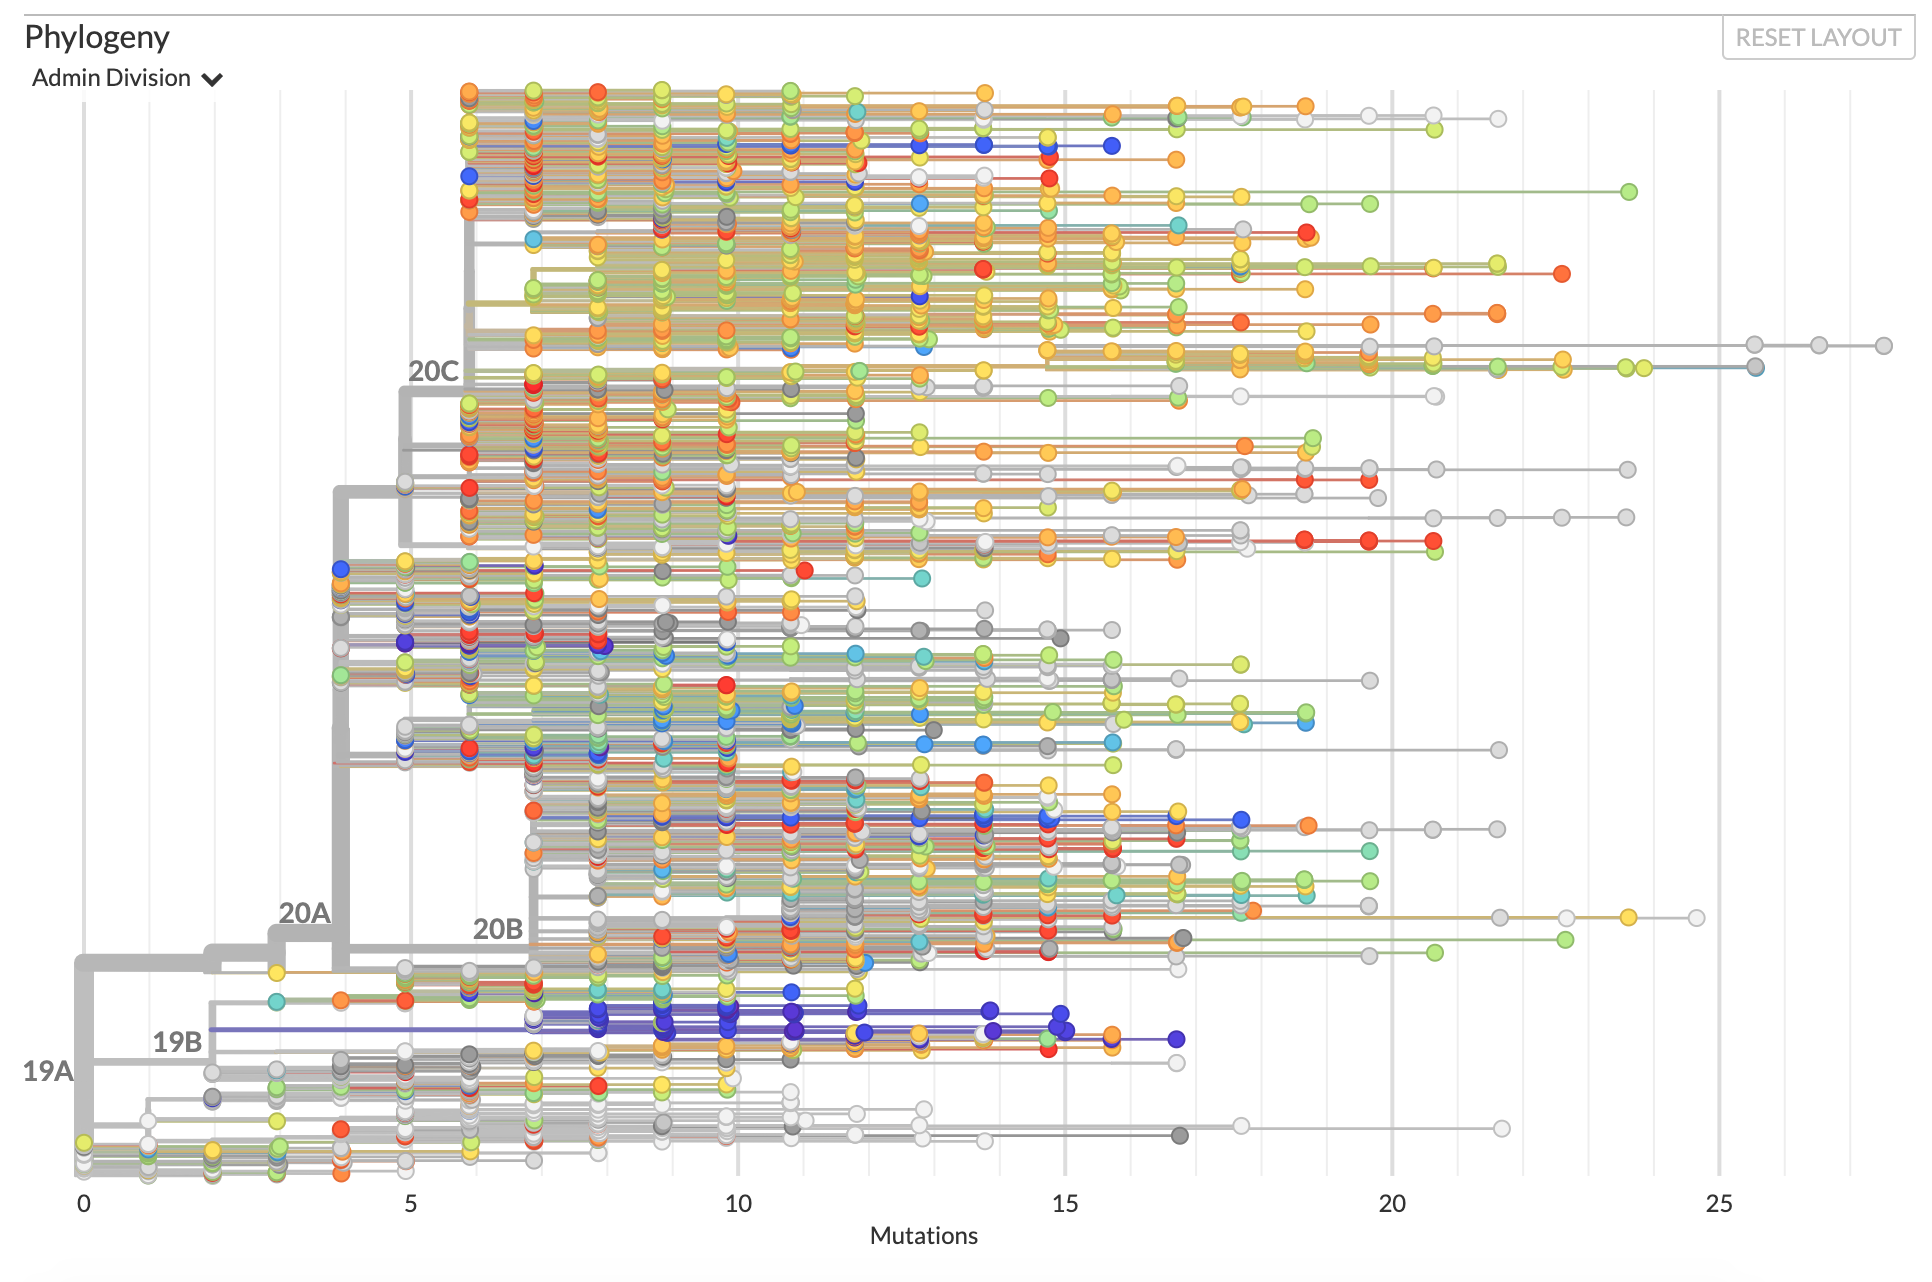
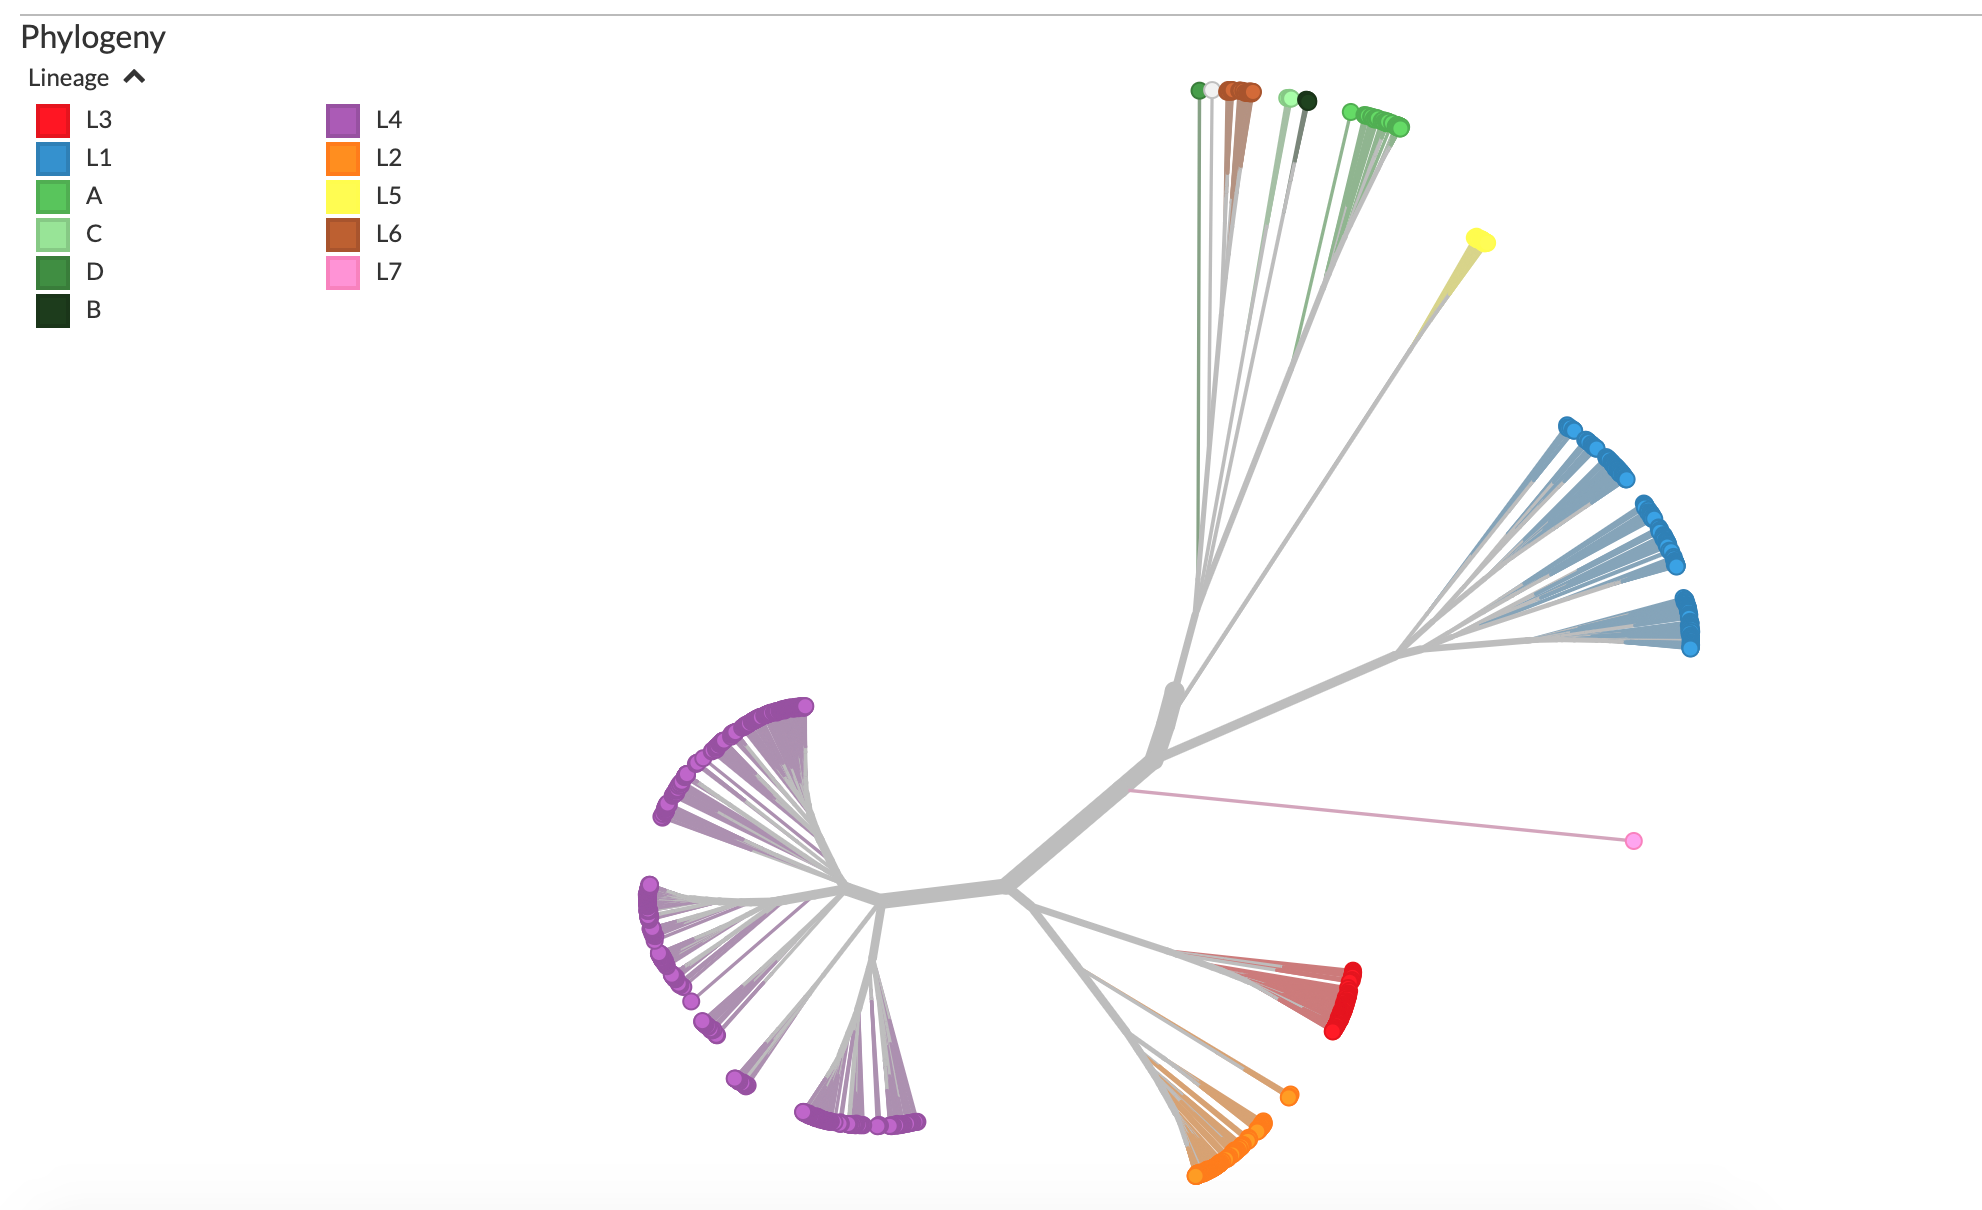
Change
Order
Hierarchy
Nextstrain demo
COVIDTracker
with Josh Batson, David Dynerman, Amy Kistler, Shannon Axelrod, Jack Kamm, Aaron McGeever, Tony Tung, TJ Chen, James Webber, Angela Pisco, and many others
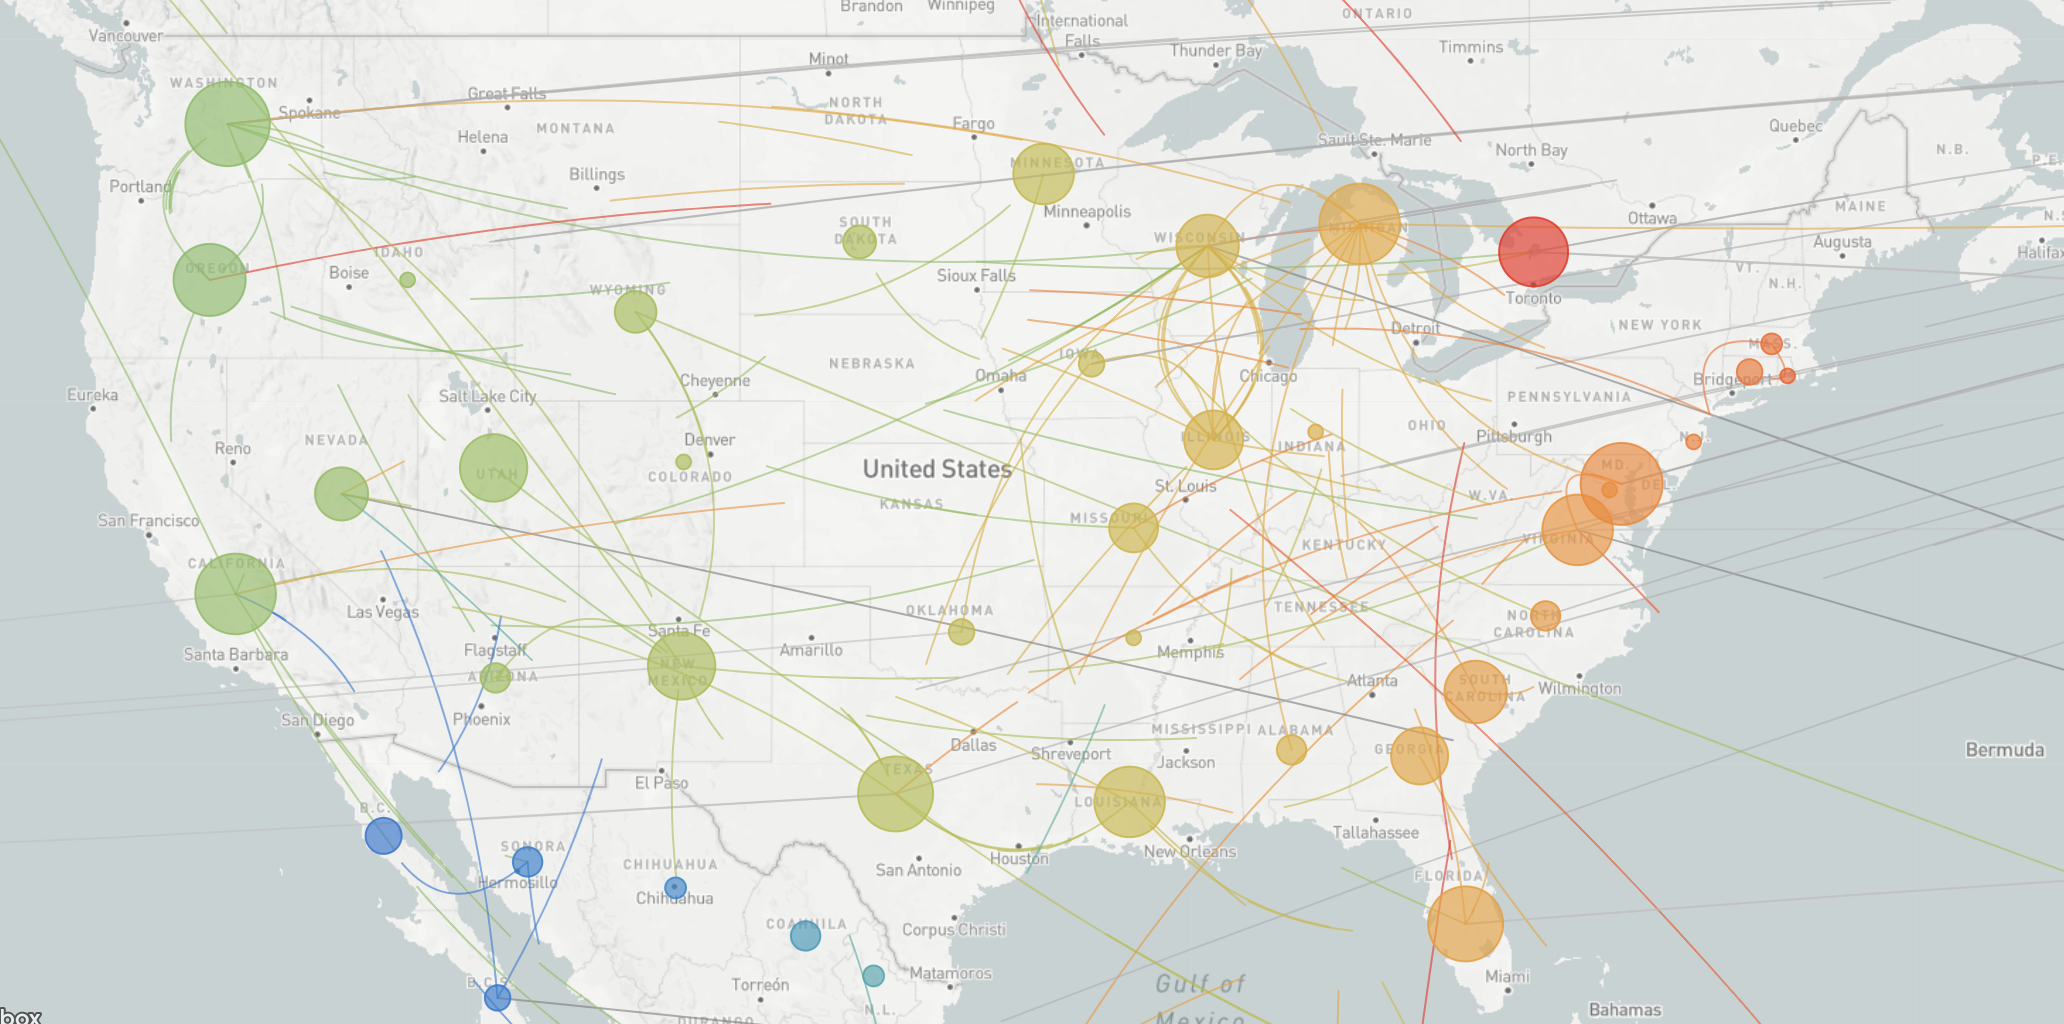
COVIDTracker
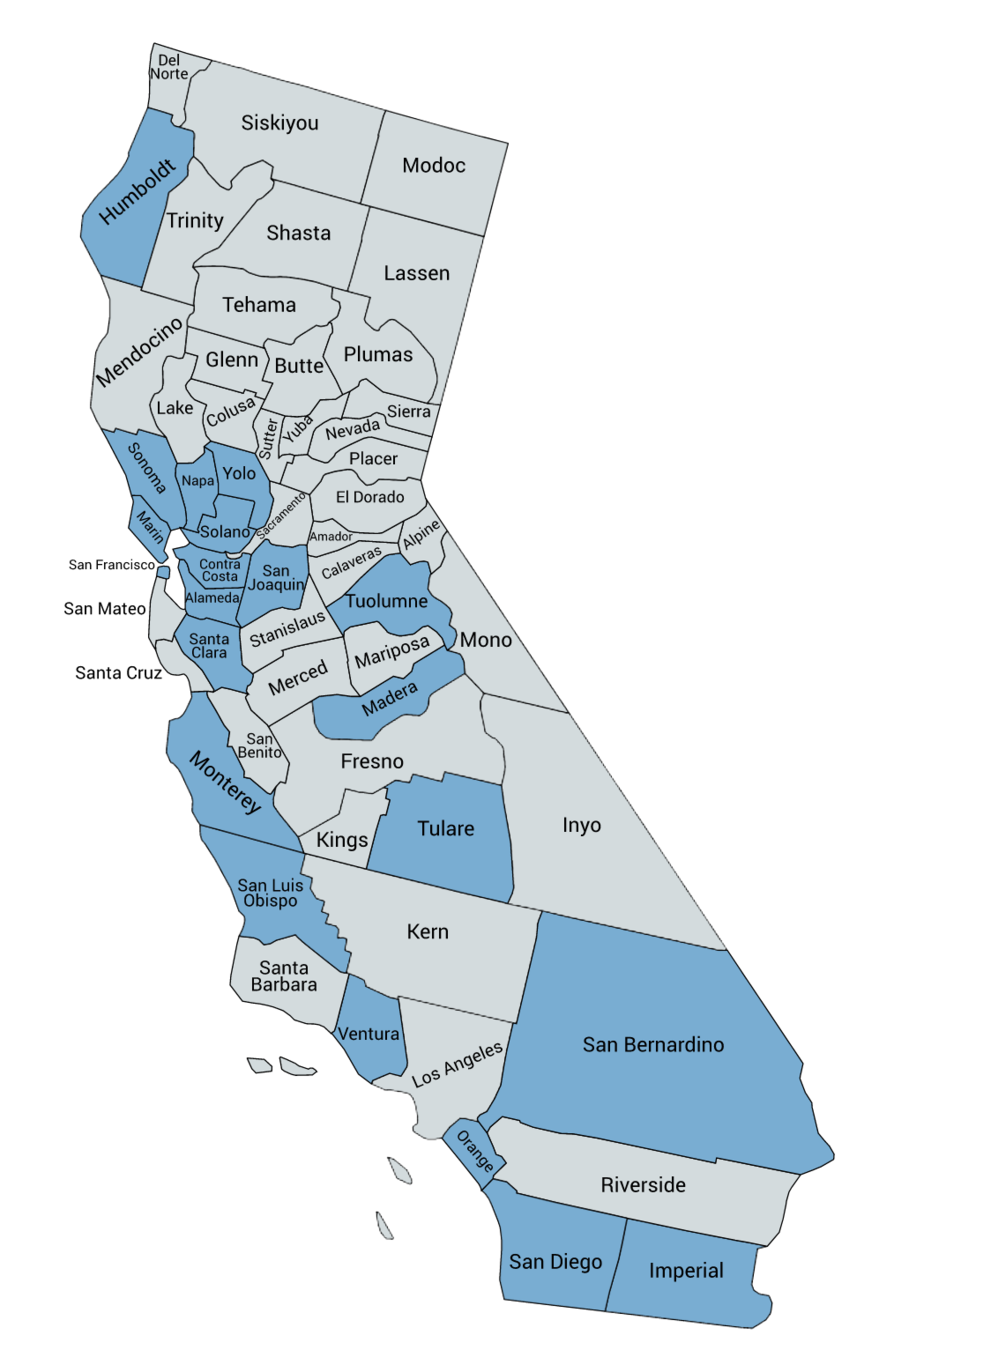
Empowering California counties' Departments of Public Health to use
genomic epidemiology in routine practice
-
Tracking introductions
Are these all travel-related, or is there community circulation?
-
Ambiguous contact tracing
Is this new workplace infection related to the previous outbreak, or is it coincident?
-
Related outbreaks
Is there transmission between neighboring towns?
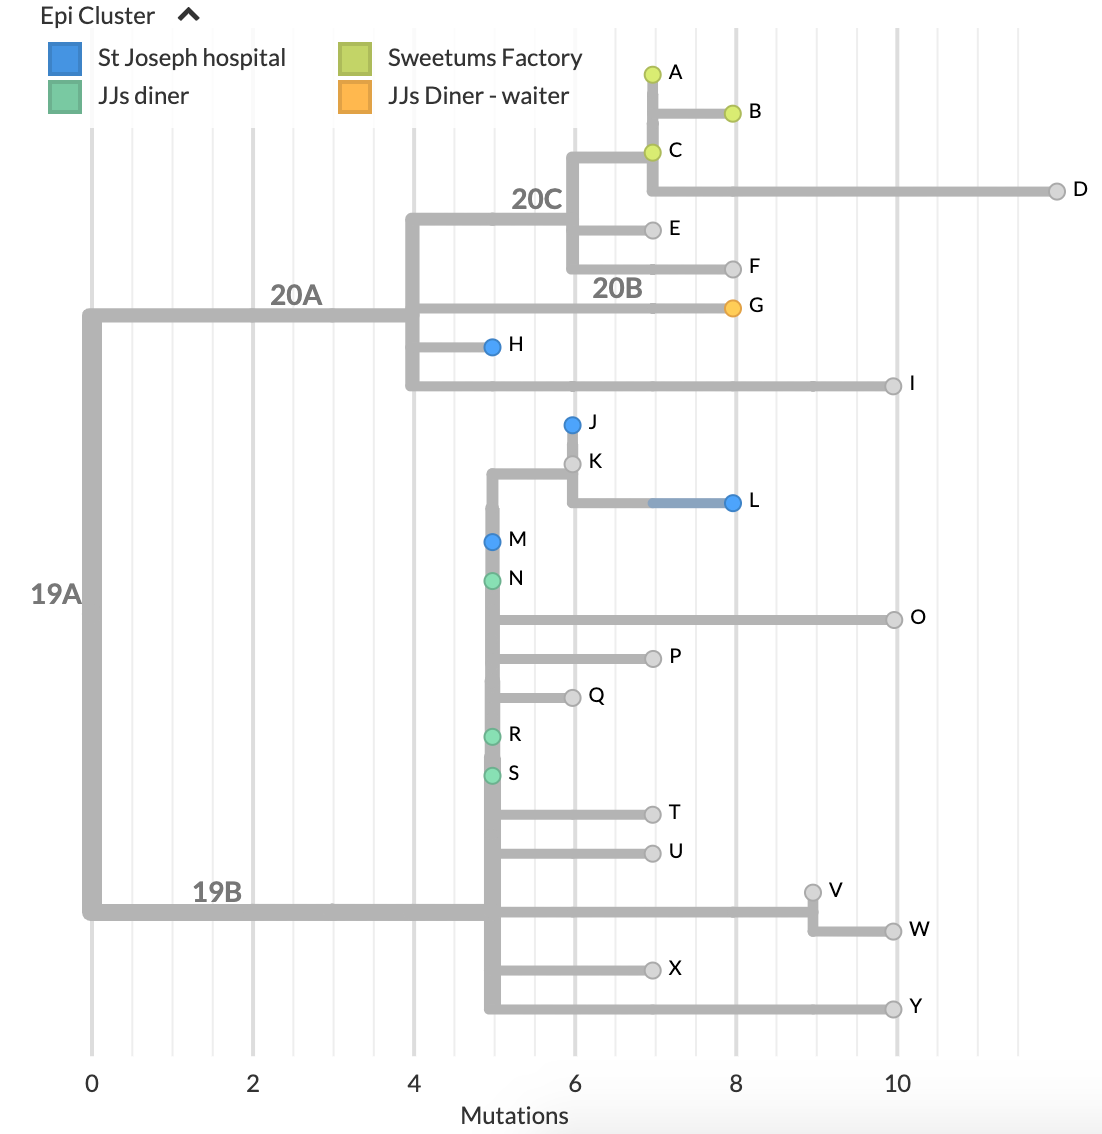
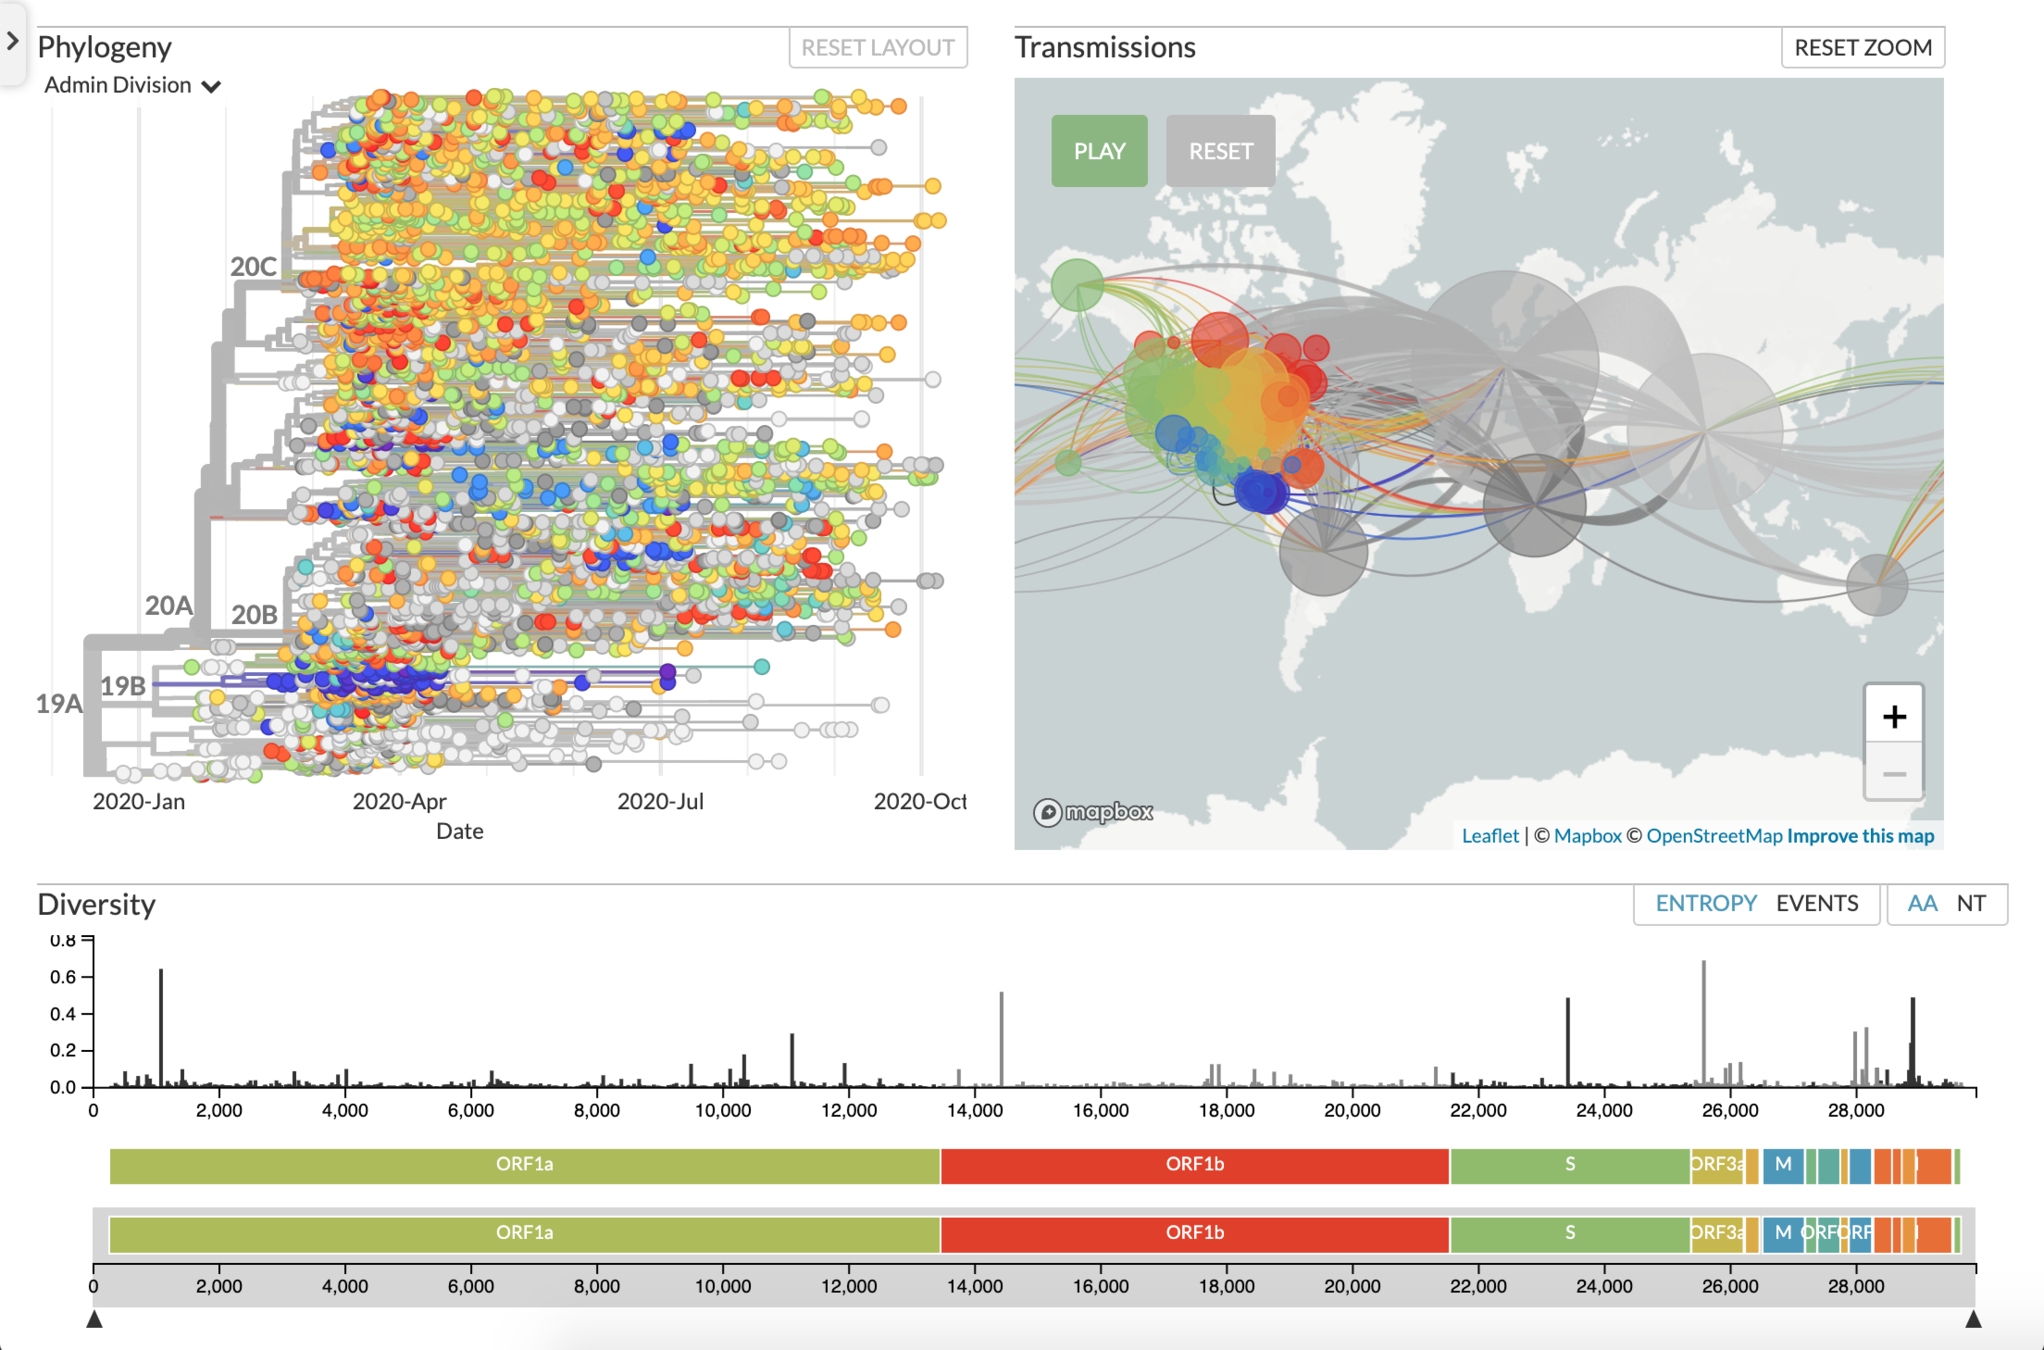
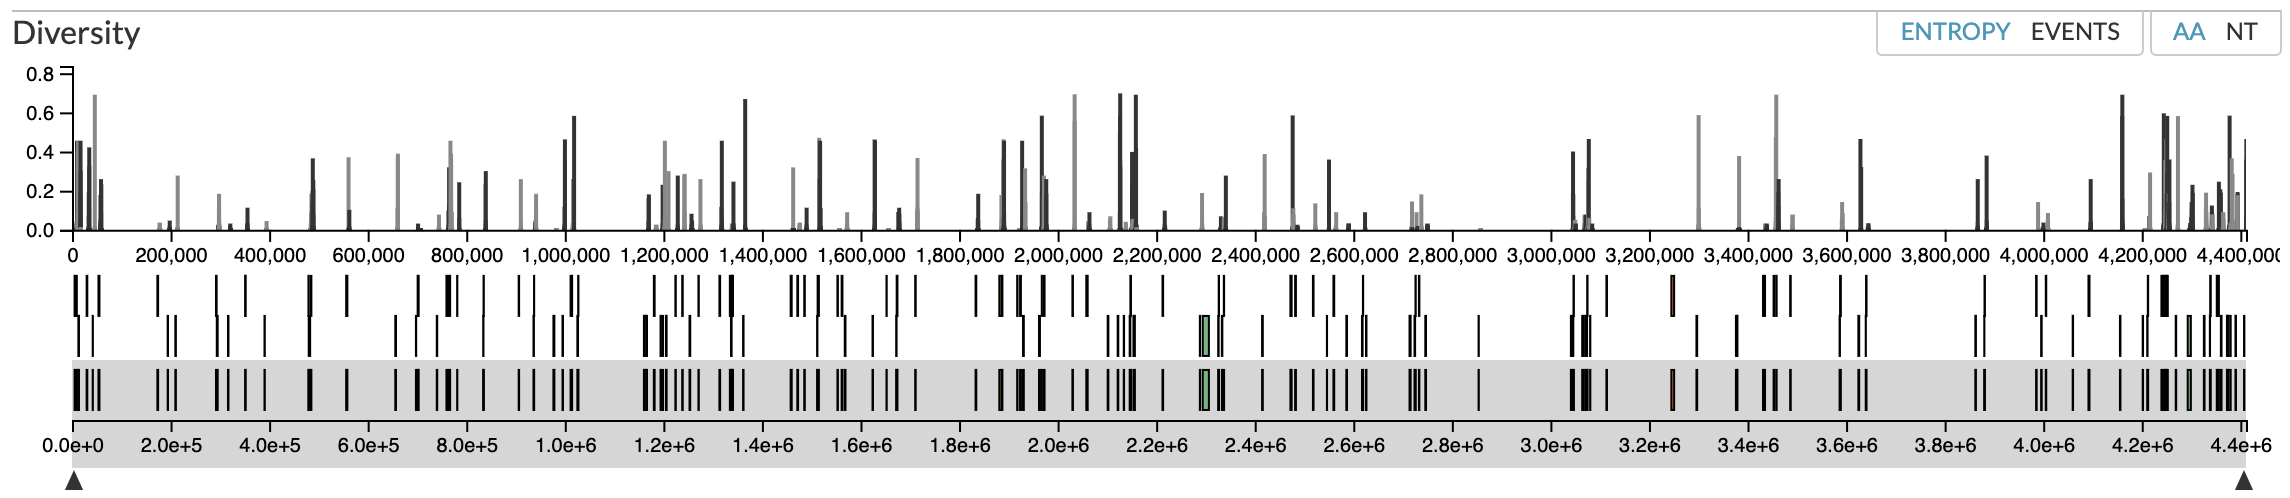
Making epidemiology visual
Shared patterns
Information-dense
Shared state across panes
Iterative cross-sectioning of data
Shared challenge: precision vs interpretability
Current viz-related challenges
- Building baseline understanding and confidence
- Handling private, sensitive metadata is hard
- Trees are pretty terrible
- [WIP] Break out information encodings into separate, paired visualization
Shared challenge:
generalizability vs tailored use cases
Shared challenge:
Exploration vs formal analysis
Takeaways
- Meaning-making requires iterative shifting of your field of vision
- Interactive explorers can help empower all researchers to get "hands-on" with their data
- Close partnership between scientists and information designers is key. Special thanks to Colin Megill!
Questions?
@sidneymbell


Many thanks to the CZI cellxgene team,
Nextstrain team, and Biohub Data Science.
biovis-2020
By Sidney Bell


