Everything is somewhere...
...That somewhere matters.
Mission
To encourage and support the use of geospatial technologies in research and teaching at Stanford University.
(whatever that means at any given time)

Instruction
Infrastructure
Consulting
Instruction
- Weekly Introductory "Spatial data science" Workshops
- Vendor Workshops
- Guest Lecturing
- Course Support
- Events
Treat spatial technology awareness as information literacy and research skills
Fill the gap between students who want credit courses and researchers who requires a few "data carpentry" skills
Infrastructure
- SGC Computer Lab
- Software licensing, provision & support
- Cloud-based resources:
- ArcGIS Online
- CARTO
- Mapbox.com
- SimplyAnalytics.com
- locator.stanford.edu
- earthworks.stanford.edu
Consulting
- Outbreak Responder
- Nepal Typhoid Survey
- Kindred London
- Landscape Testimonials
- Nomadic Pastoralists
earthworks.stanford.edu
spatial data is different
it has geometry
and scale
and extent
and temporality
It's difficult to find
It's difficult to evaluate
It's difficult to access
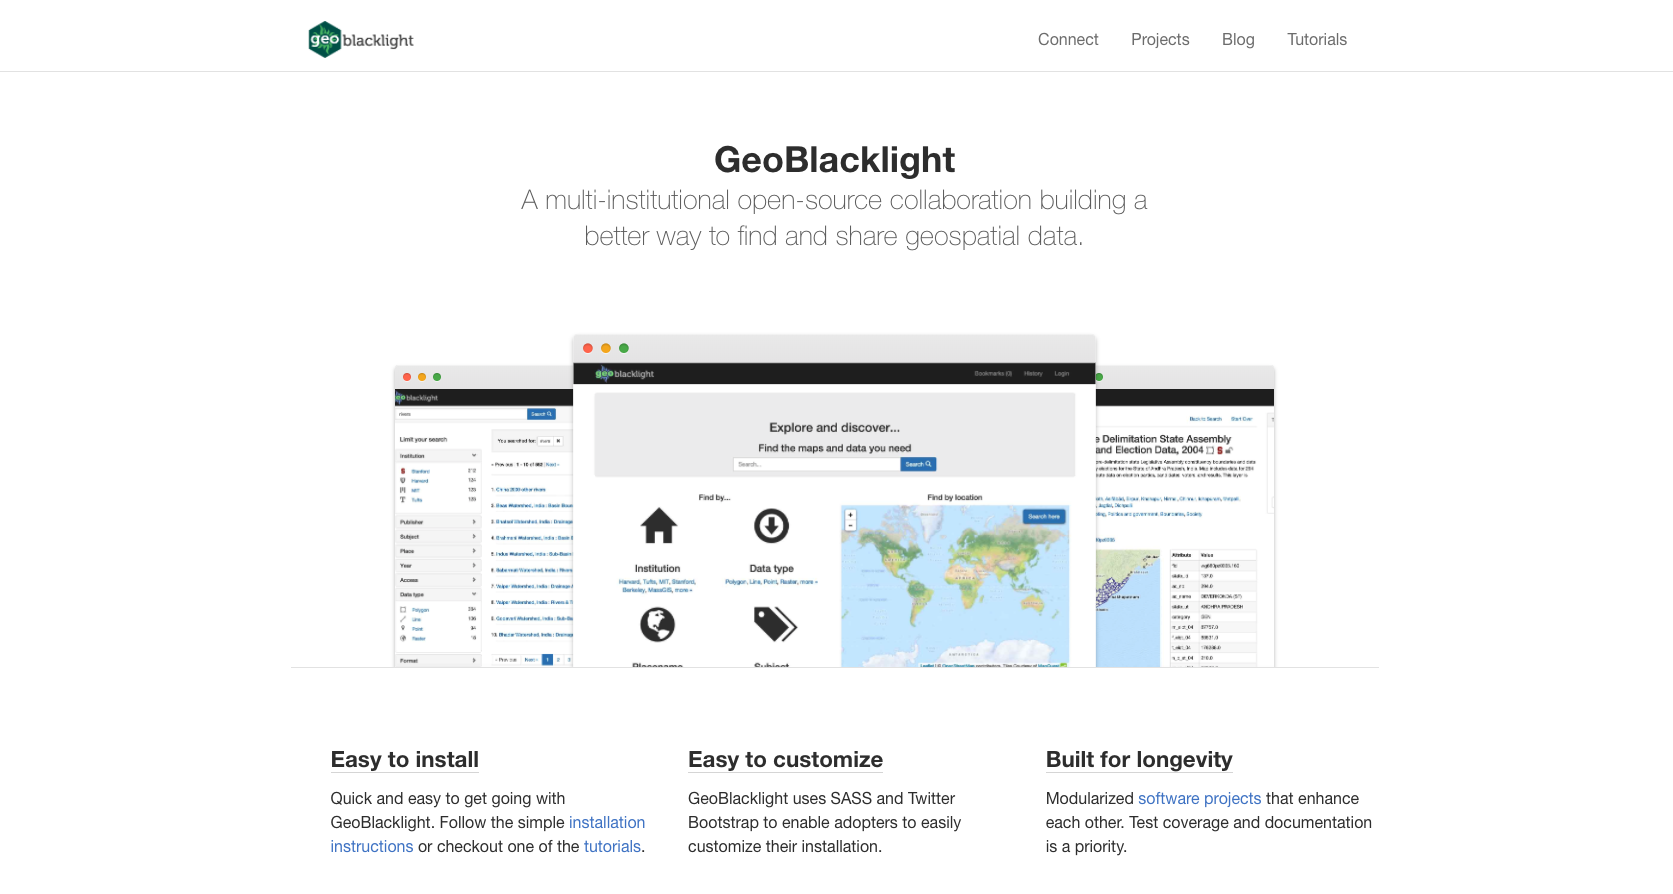
GeoBlacklight
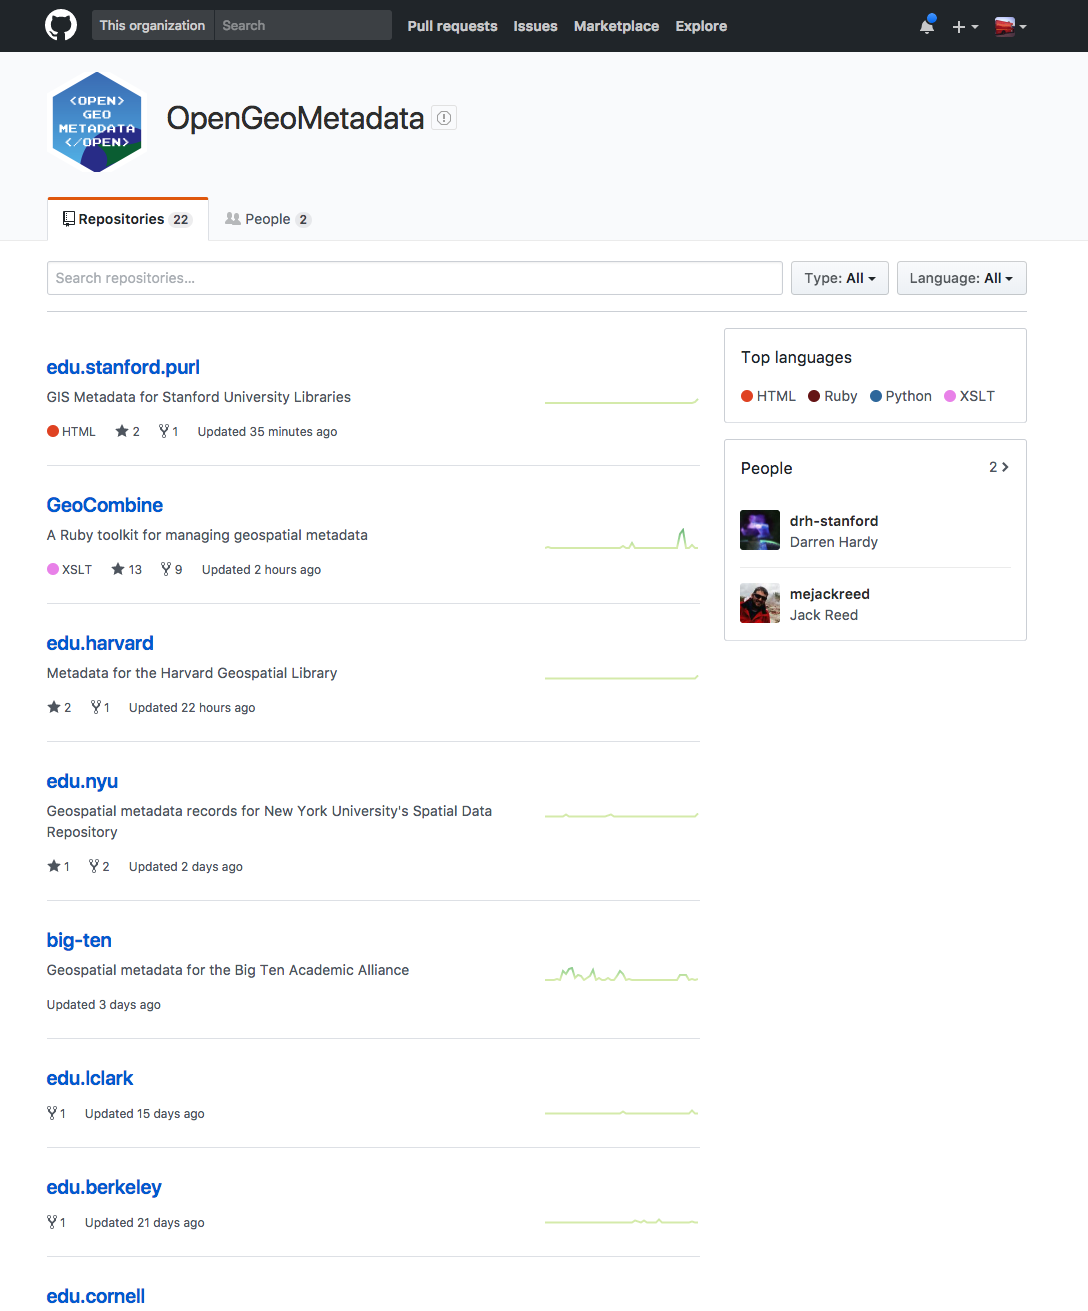
OpenGeoMetadata
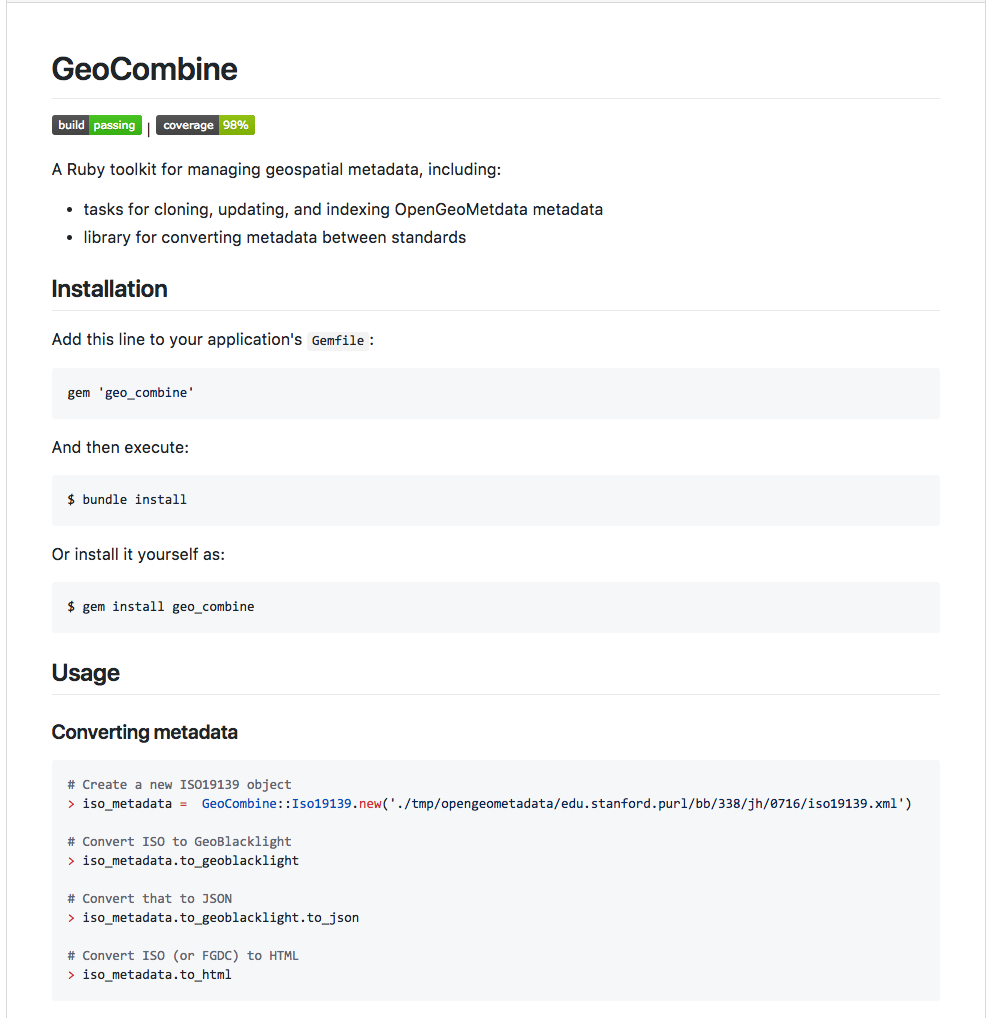
GeoCombine
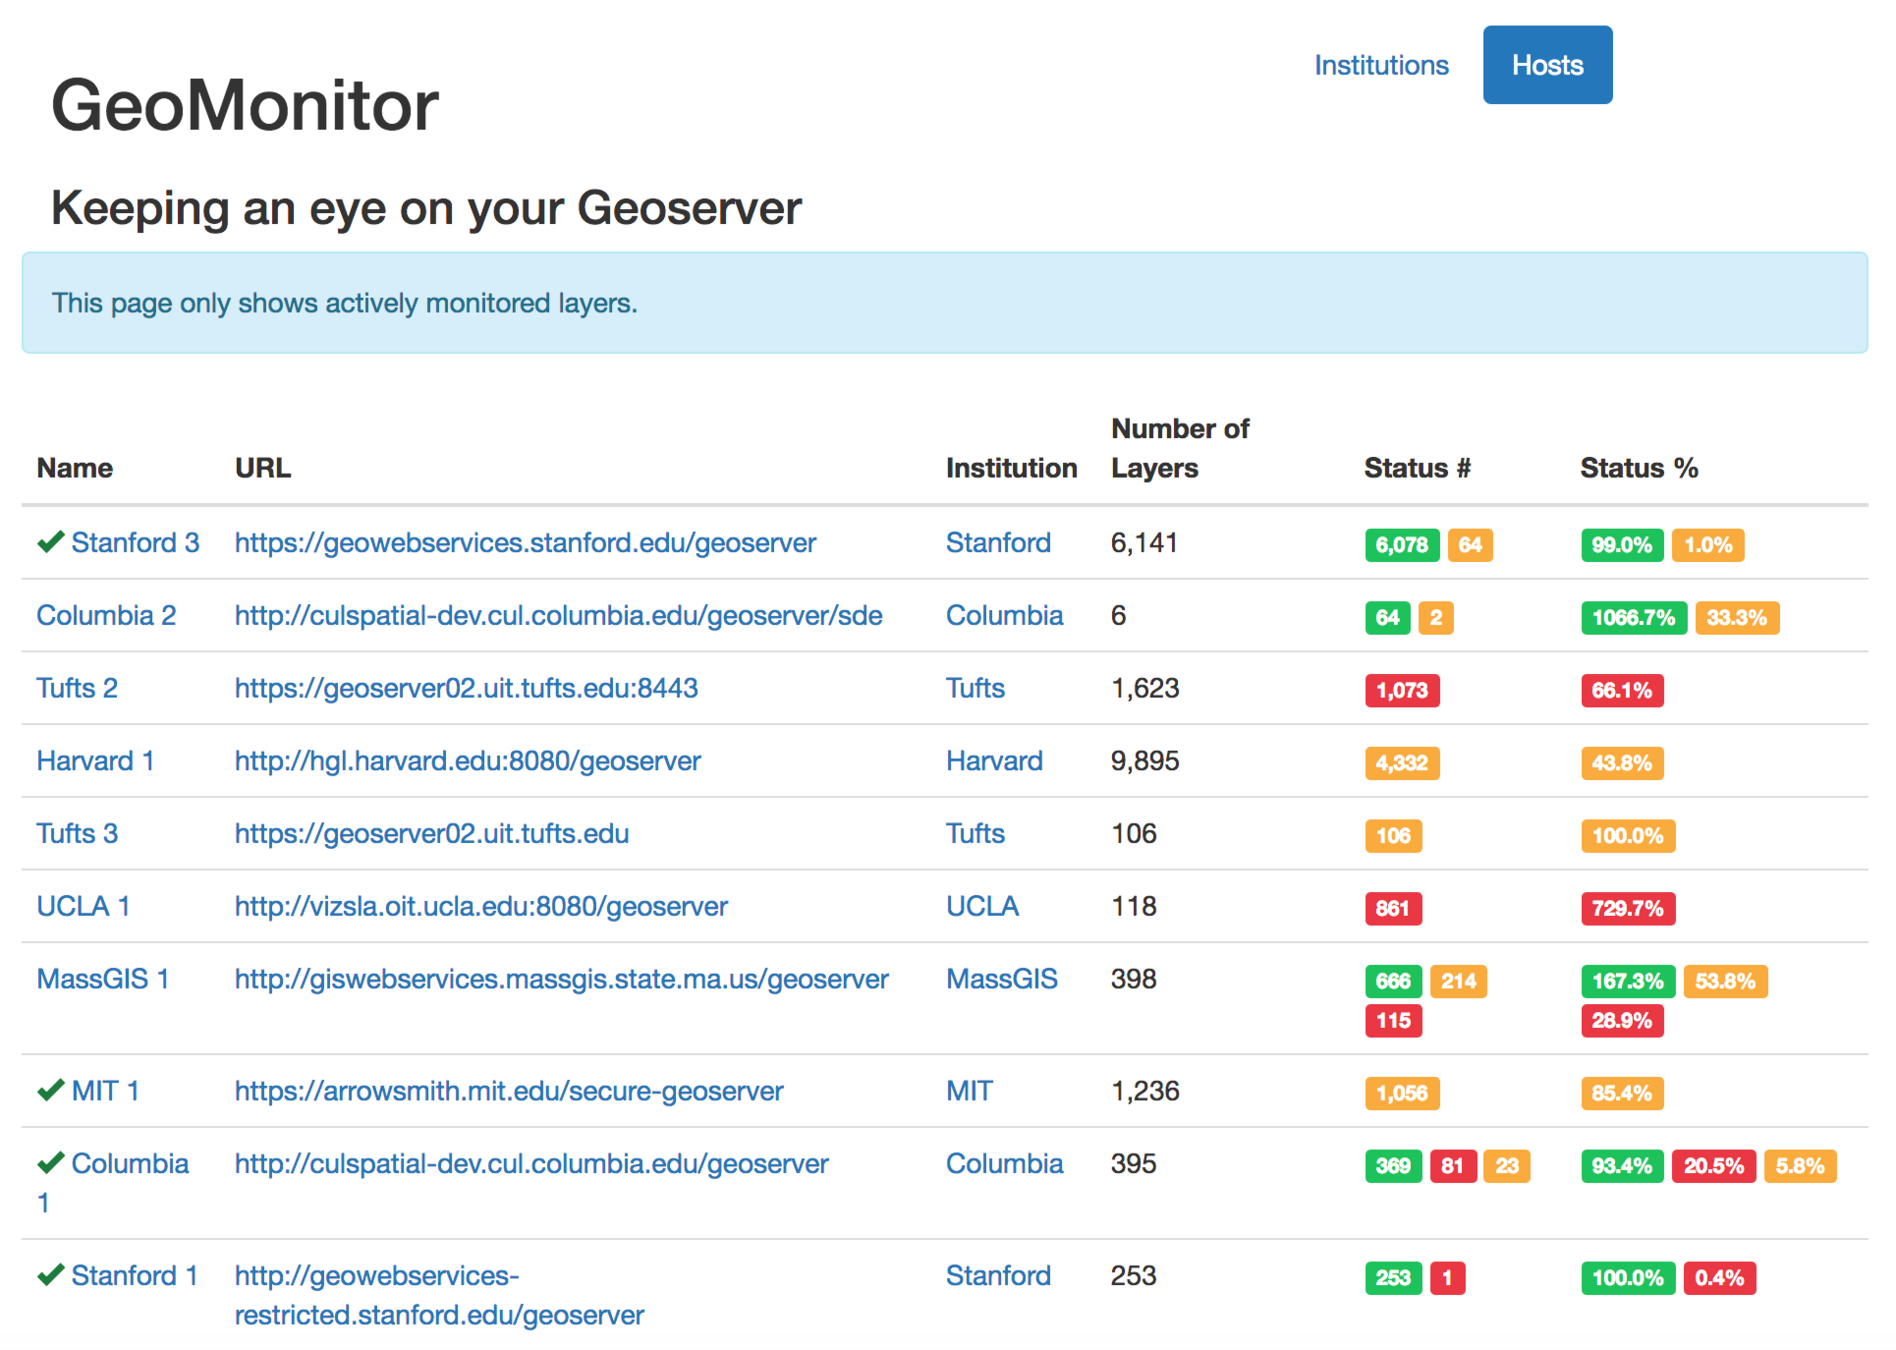
GeoMonitor
Stanford Digital Repository
Stanford Spatial Data Infrastructure
The Stanford Digital Repository treats our spatial data holdings as durable assets.
The Stanford Spatial Data Infrastructure (SSDI) exposes the live OGC spatial data services that power Earthworks fuctionality
(WFS, WMS, etc...)
Earthworks is Geoblacklight
and
Geoblacklight is a Community
GeoBlacklight Contributors
- Big Ten Academic Alliance
- MIT Libraries
- New York University Libraries
- Princeton University Library
- Stanford University Libraries
- University of Minnesota Libraries
- Princeton 28,872
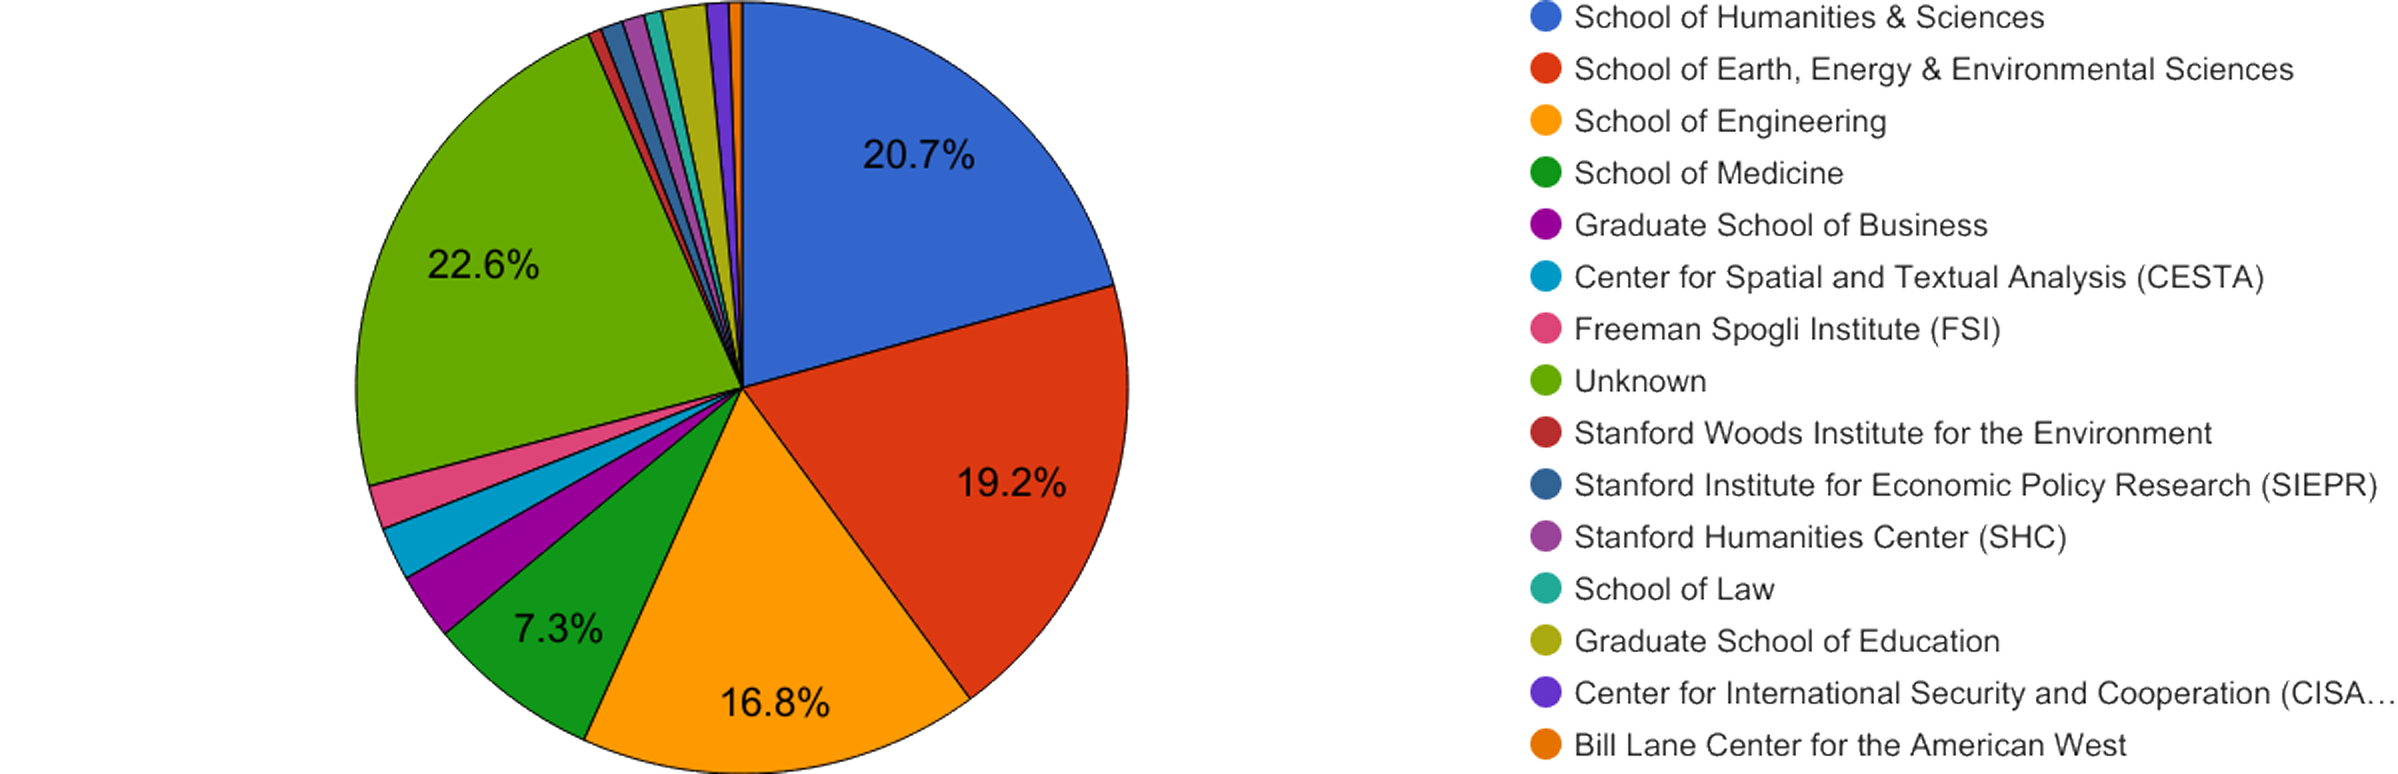
- Stanford 13,962
- Harvard 10,448
- MIT 7,166
- NYU 3,502
- Columbia 3,265
- Tufts 3,092
- UVa 1,256
- Michigan 802
- Wisconsin 750
OpenGeoMetadata Contributors
- Minnesota 624
- MassGIS 599
- Berkeley 351
- Iowa 343
- Indiana 291
- Purdue 235
- Illinois 129
- Baruch CUNY 126
- Michigan State 43
- Maryland 32
Geoblacklight is getting better, all the time...

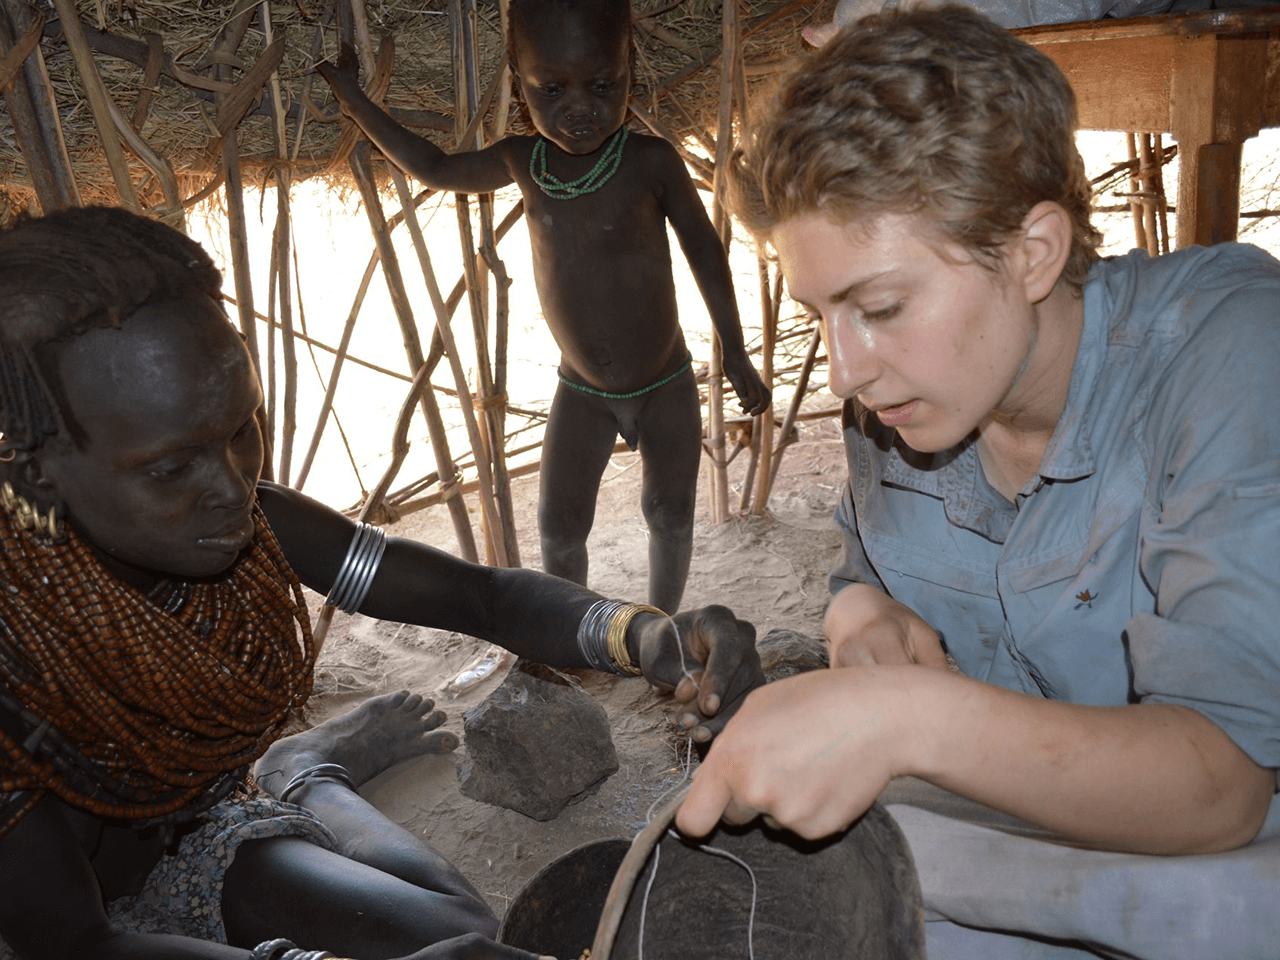
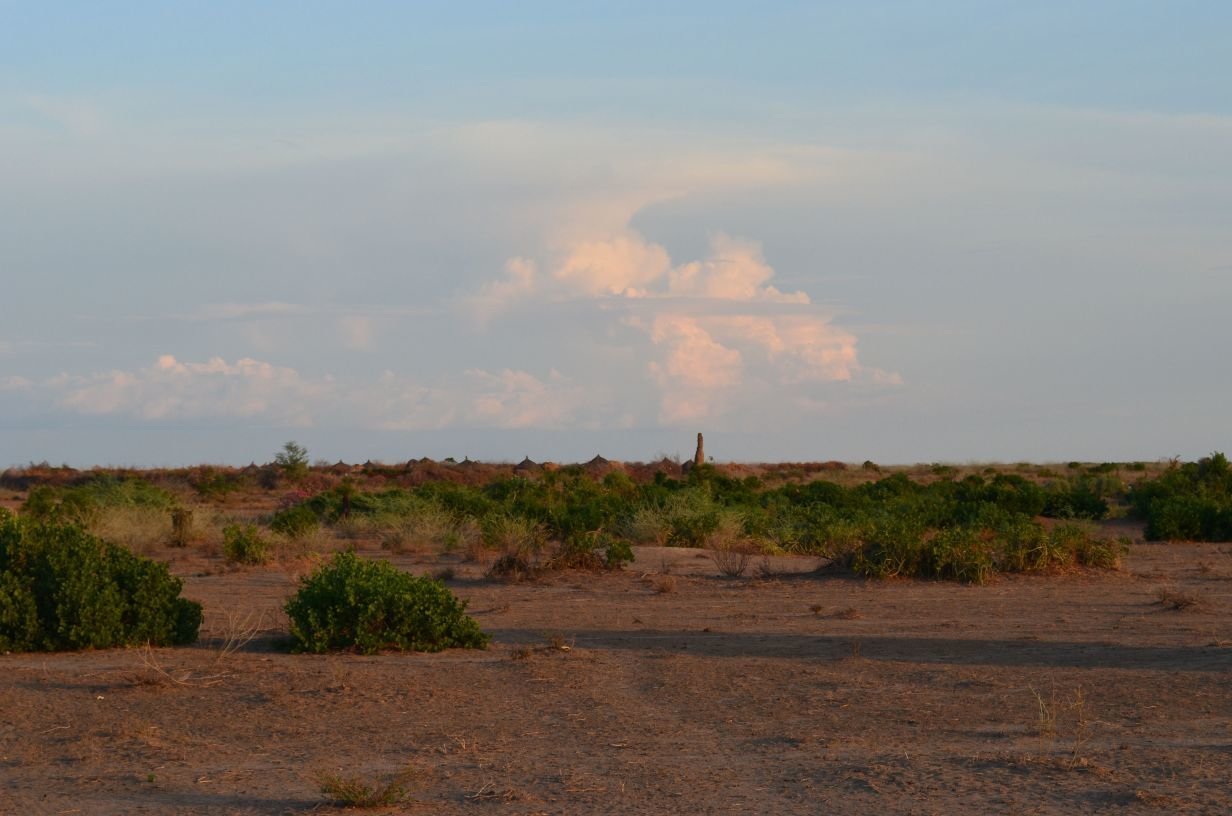
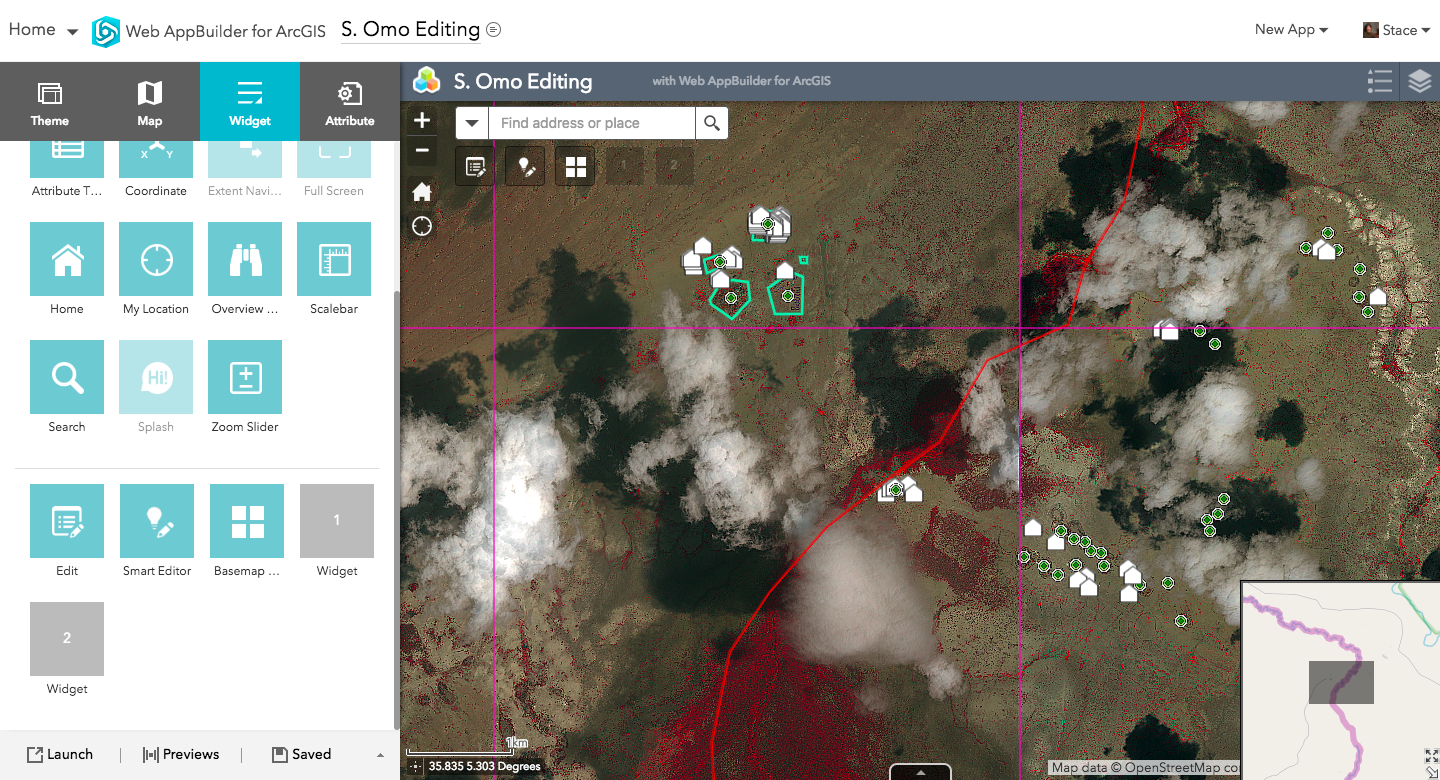
Finding Nomadic Pastoralists from Space

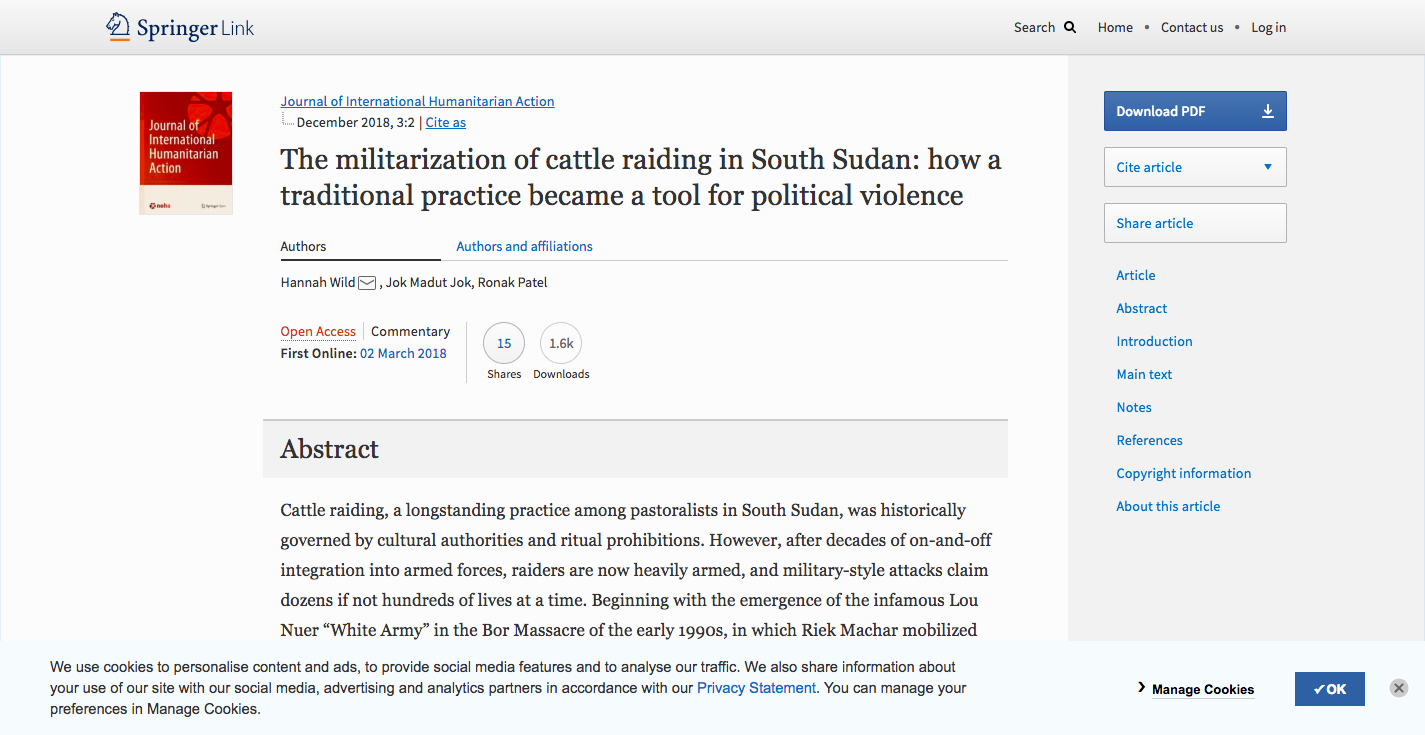
https://link.springer.com/article/10.1186/s41018-018-0030-y
Hannah:
"I can see the settlements in Google Earth, but I know that those images are old and those villages are long gone, but is there a way to get satellite imagery that good, and do a complete settlement survey within a few weeks of the image being taken?"

https://tasks.hotosm.org/

http://foundation.digitalglobe.com/
#Import modules
import glob, os, gdal, fnmatch

#Set base directory to location of script
base_directory = os.path.abspath('')

#Make a list of Multispectral directories with 'MUL' in the path
multi_directory_list = glob.glob(os.path.join(base_directory, '*MUL'))

#Make Panchromatic directory [pan_directory] path by replacing 'MUL' with 'PAN'
for multi_directory in multi_directory_list:
    pan_directory = multi_directory.replace('MUL','PAN')
    print(multi_directory)
    print(pan_directory)
    #Make a list of TIF files in the multi_directory
    multi_tiffs_list = fnmatch.filter((os.listdir(multi_directory)), '*.TIF')
    for multi_tiff_name in multi_tiffs_list:
        print(multi_tiff_name)
#Get the matching panchromatic image for the current multispectral by searching for the RowCol
        multi_rowcol_wildcard = '*'+multi_tiff_name[19:24]+'*'
        #print(multi_rowcol)
        pan_tiffs_list = fnmatch.filter((os.listdir(pan_directory)), '*.TIF')
        pan_tiff_name = fnmatch.filter(pan_tiffs_list, multi_rowcol_wildcard)
        #print(pan_tiff_name[0])
#Pan-sharpen the multispectral using it's corresponding panchromatic image using JPEG compression and internal tiles
        print('pansharpen')
        os.system('python gdal_pansharpen.py -co NBITS=12 -co COMPRESS=JPEG -co JPEG_QUALITY=50 -co PHOTOMETRIC=YCBCR -co TILED=YES ' + os.path.join(pan_directory,pan_tiff_name[0]) + ' ' + os.path.join(multi_directory,multi_tiff_name) + ',band=7 ' + os.path.join(multi_directory,multi_tiff_name) + ',band=5 ' + os.path.join(multi_directory,multi_tiff_name) + ',band=3 ' + base_directory + '/sharp_' + multi_tiff_name)
#Add overviews for resulting tiffs
        os.system('gdaladdo --config COMPRESS_OVERVIEW JPEG --config PHOTOMETRIC_OVERVIEW YCBCR --config INTERLEAVE_OVERVIEW PIXEL -r average ' + base_directory + '/sharp_' + multi_tiff_name + ' 2 4 8 16')
#Create a Virtual Raster Mosaic of VRT type from all resulting sharpened TIFF images
print('create VRT mosaic from SHARP images')
os.system('gdalbuildvrt sharpmosaic.vrt *.TIF')
#Haven't finished figuring out how to get a decently stretched image out of this part. More to do!
print('MBtiles out')
print('gdal_translate sharpmosaic.vrt sharpmosaic.mbtiles -of MBTILES')
print('gdaladdo -r average sharpmosaic.mbtiles 2 4 8 16')
https://github.com/mapninja/DGF_parser
HIVE
13440 x 5400 x .53m pixels
=
20 sq km
Typical Monitor
1440 x 900 x .53m pixels
=
.7 sq km
Or,...
250 shift+arrow pans vs. 7000+
~ 6 hrs
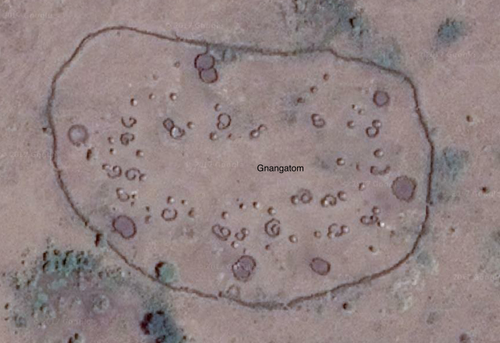
Outcomes
- 5,000+ sq km
- 225 settlements
- only 2 abandoned by arrival
-
347 surveys of women of reproductive age
-
Measurements and histories for 824 of their children <15 years

gis.stanford.edu
github.com/stanfordgeospatialcenter
@mapninja
stacemaples@stanford.edu

SUL Services Expo
By Stace Maples
SUL Services Expo
For the H&S Services Expo


