World Food Facts
Andreas Kammerloher, Muhammad Triwindu Prasetya, Vivek Sethia
Motivation
- Nutritional values
- Exploring different categories
- Eating habits across the world
- Distribution of specific ingredients ( sugar, fats etc.)
- Compare product brands then change to healthier food

Overview
- Introduction
- Problems
- Cleaning & Preprocessing
- Interpretations
- Predictions
- Conclusion
Introduction
- Dataset for food products created by everyone for everyone
- Total : 119415 products
- Size : 267 MB
- Format : .csv
- Attributes : 159
- Missing values : Almost 13 Million
- Almost 80% missing values for most attributes


- The Open Food Facts Project was started by Stéphane Gigandet
- Like on Wikipedia, anyone can create an account and add / edit food items
Introduction
Overview
- Introduction
- Problems
- Cleaning & Preprocessing
- Interpretations
- Predictions
- Conclusion
Problems
- Data biased - most entries from France (90%)
- Lot of missing values
- Translation issues
- Stop words
- Same product from the same brand and quantity have different values of nutrition fact

Overview
- Introduction
- Problems
- Cleaning & Preprocessing
- Interpretations
- Predictions
- Conclusion
Cleaning
- Missing values
- Stopwords and punctuation
- Translation issues
- Case sensitive ("Lait" and "lAit")
- Inappropriate value in cells

Missing values
- Many attributes have missing values
product_name        : 14787
generic_name        : 60005
quantity            : 21450
packaging           : 39153
packaging_tags      : 39153
brands              : 18298
brands_tags         : 18304
categories          : 35132
categories_tags     : 35153
ingredients_text    : 44506
allergens           : 83246
allergens_en        : 106340
additives_n         : 44542
additives           : 45032
additives_tags      : 73536
additives_en        : 73536
fat_100g            : 53180
saturated.fat_100g  : 57684
X.butyric.acid_100g : 106340
X.sucrose_100g      : 106283
Stopwords and Punctuation
- Library for cleaning:
- Library (NLP)
- Library (tm)
Stopwords and Punctuation
- Wordcloud before removing stopwords and punctuantion
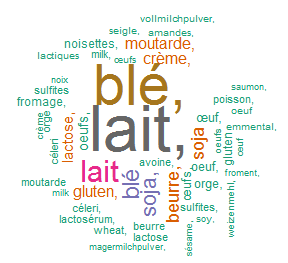
Figure 1
Stopwords and Punctuation
- Wordcloud after removing:
- Stopwords
- Punctuation
- Also after translating words
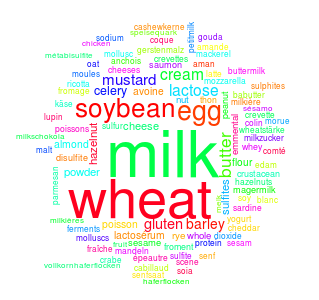
Figure 2
Translation issues
- Couldn't find library for translation
- Manually substitute Non-English words to English words

Case - Senstive
- Because anyone can insert data into the OpenFoodFact database, the database has inconsistent input.
- For example: blé and Blé


Inappropriate Value
- Many cells have inappropriate value, for example in countries_en attribute.


Overview
- Introduction
- Problems
- Cleaning & Preprocessing
- Interpretations
- Predictions
- Conclusion
Inspecting Sweets
- Searched database for sweets-related tags
- Found 661 items (in a database of over 100000 foods)
- Obviously there must be missing (untagged) sweets!
Inspecting Sweets
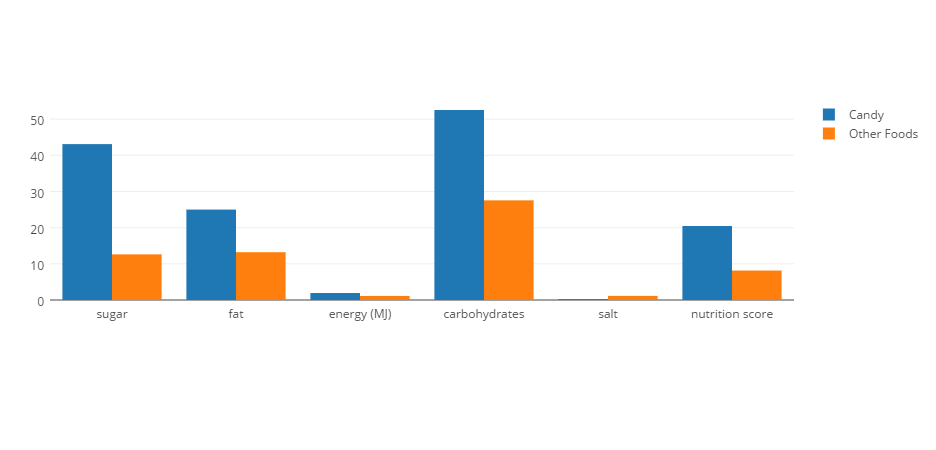
All nutritional values per 100g
Figure 1
Figure 1
Figure 1
Figure 1
Figure 3
Inspecting Sweets
All nutritional values per 100g
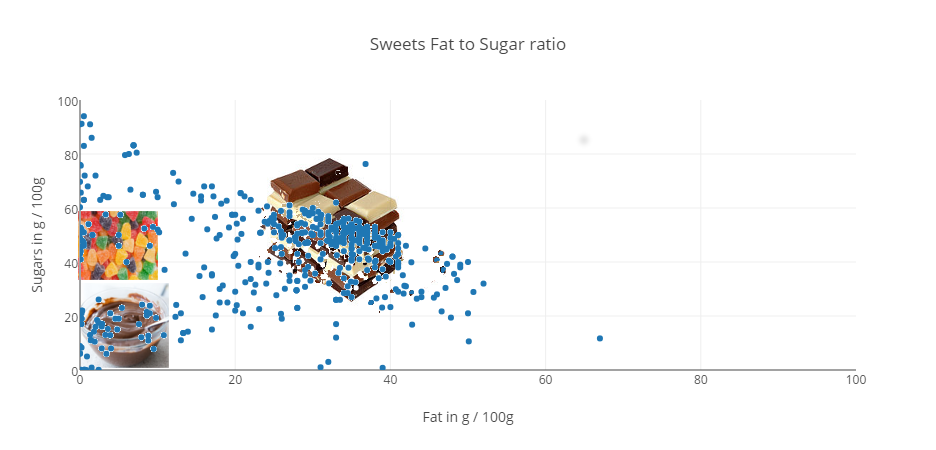
Figure 4
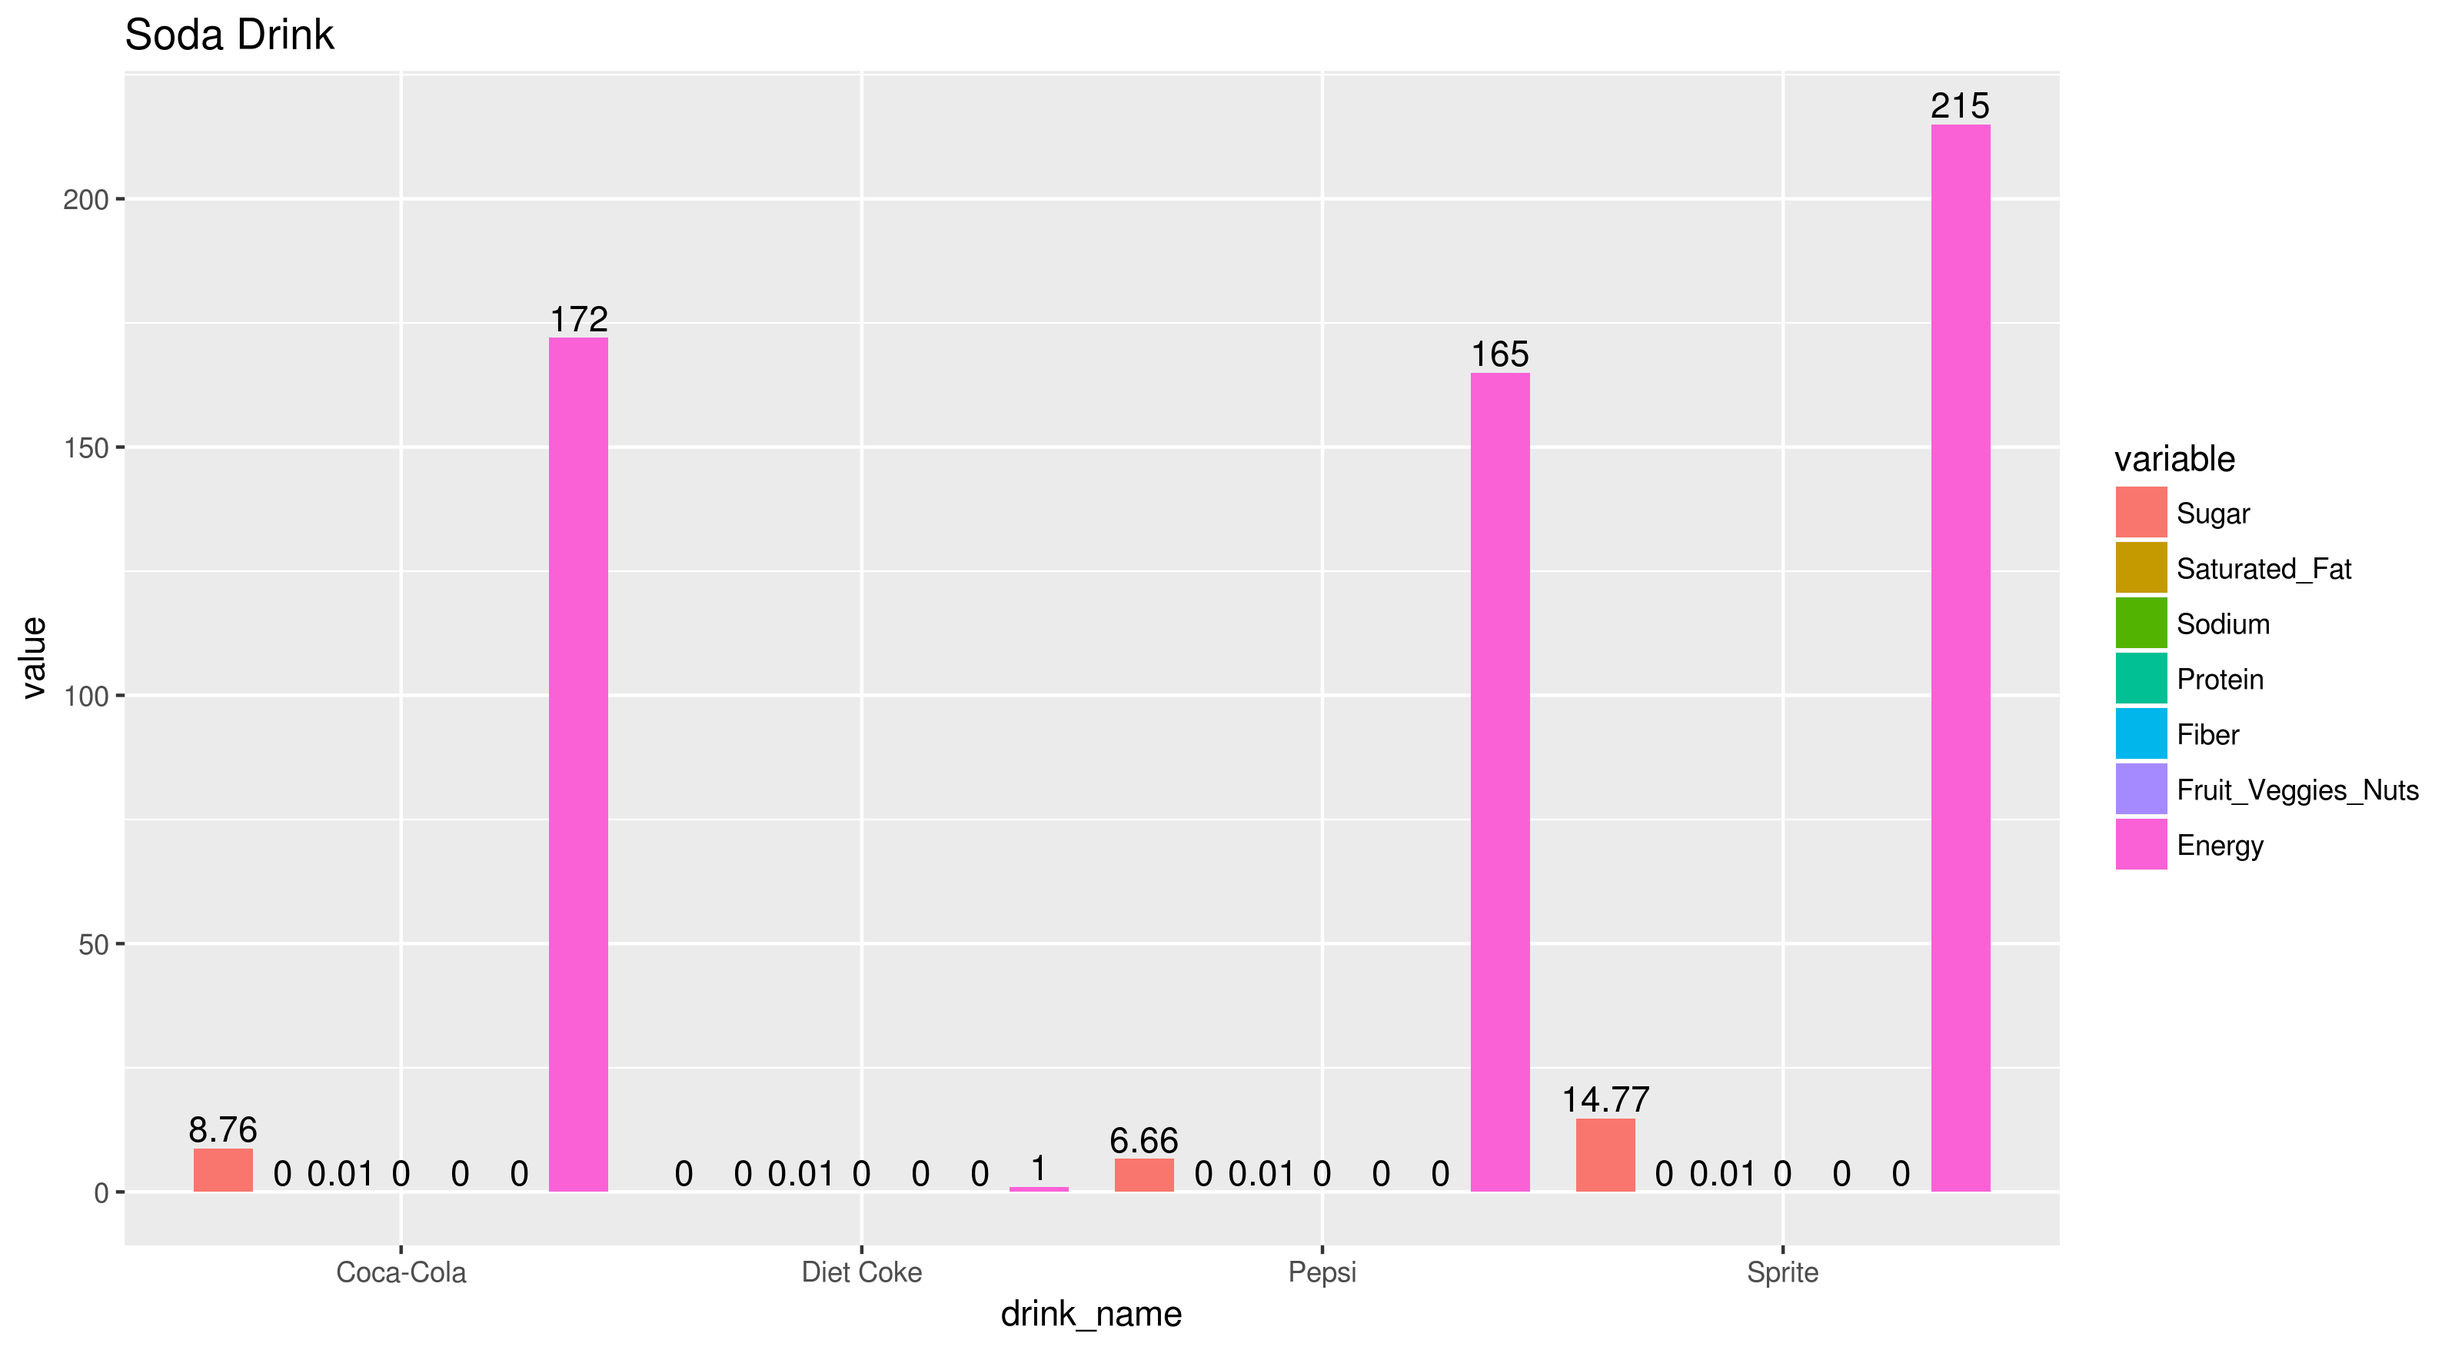
Inspect beverage
Searched the dataset for beverage tag
- Found 71187 entries
- Beverage categories based on its tag:
- Morning drink
- Milk, Coffee, Chocolate Milk
- Soda drink
- Sprite, Coca Cola, Pepsi, Diet Coke
- Healthy drink
- Tea, Juice, Smoothie
- Protein and energy drink
- Protein shake, Power drink
- Morning drink
Inspect beverage
- Formula:
- Were sent to OpenFoodFact contributor by the team of Prof. Hercberg
- The formula has been subject of studies and adaptations for the French market
- There are 2 formulas:
- For calculating "solid food"
- For calculation "beverage"
- Note: based on the website, we need to use formula for calculation solid food to calculate Milk nutrition score
Clustering beverage products
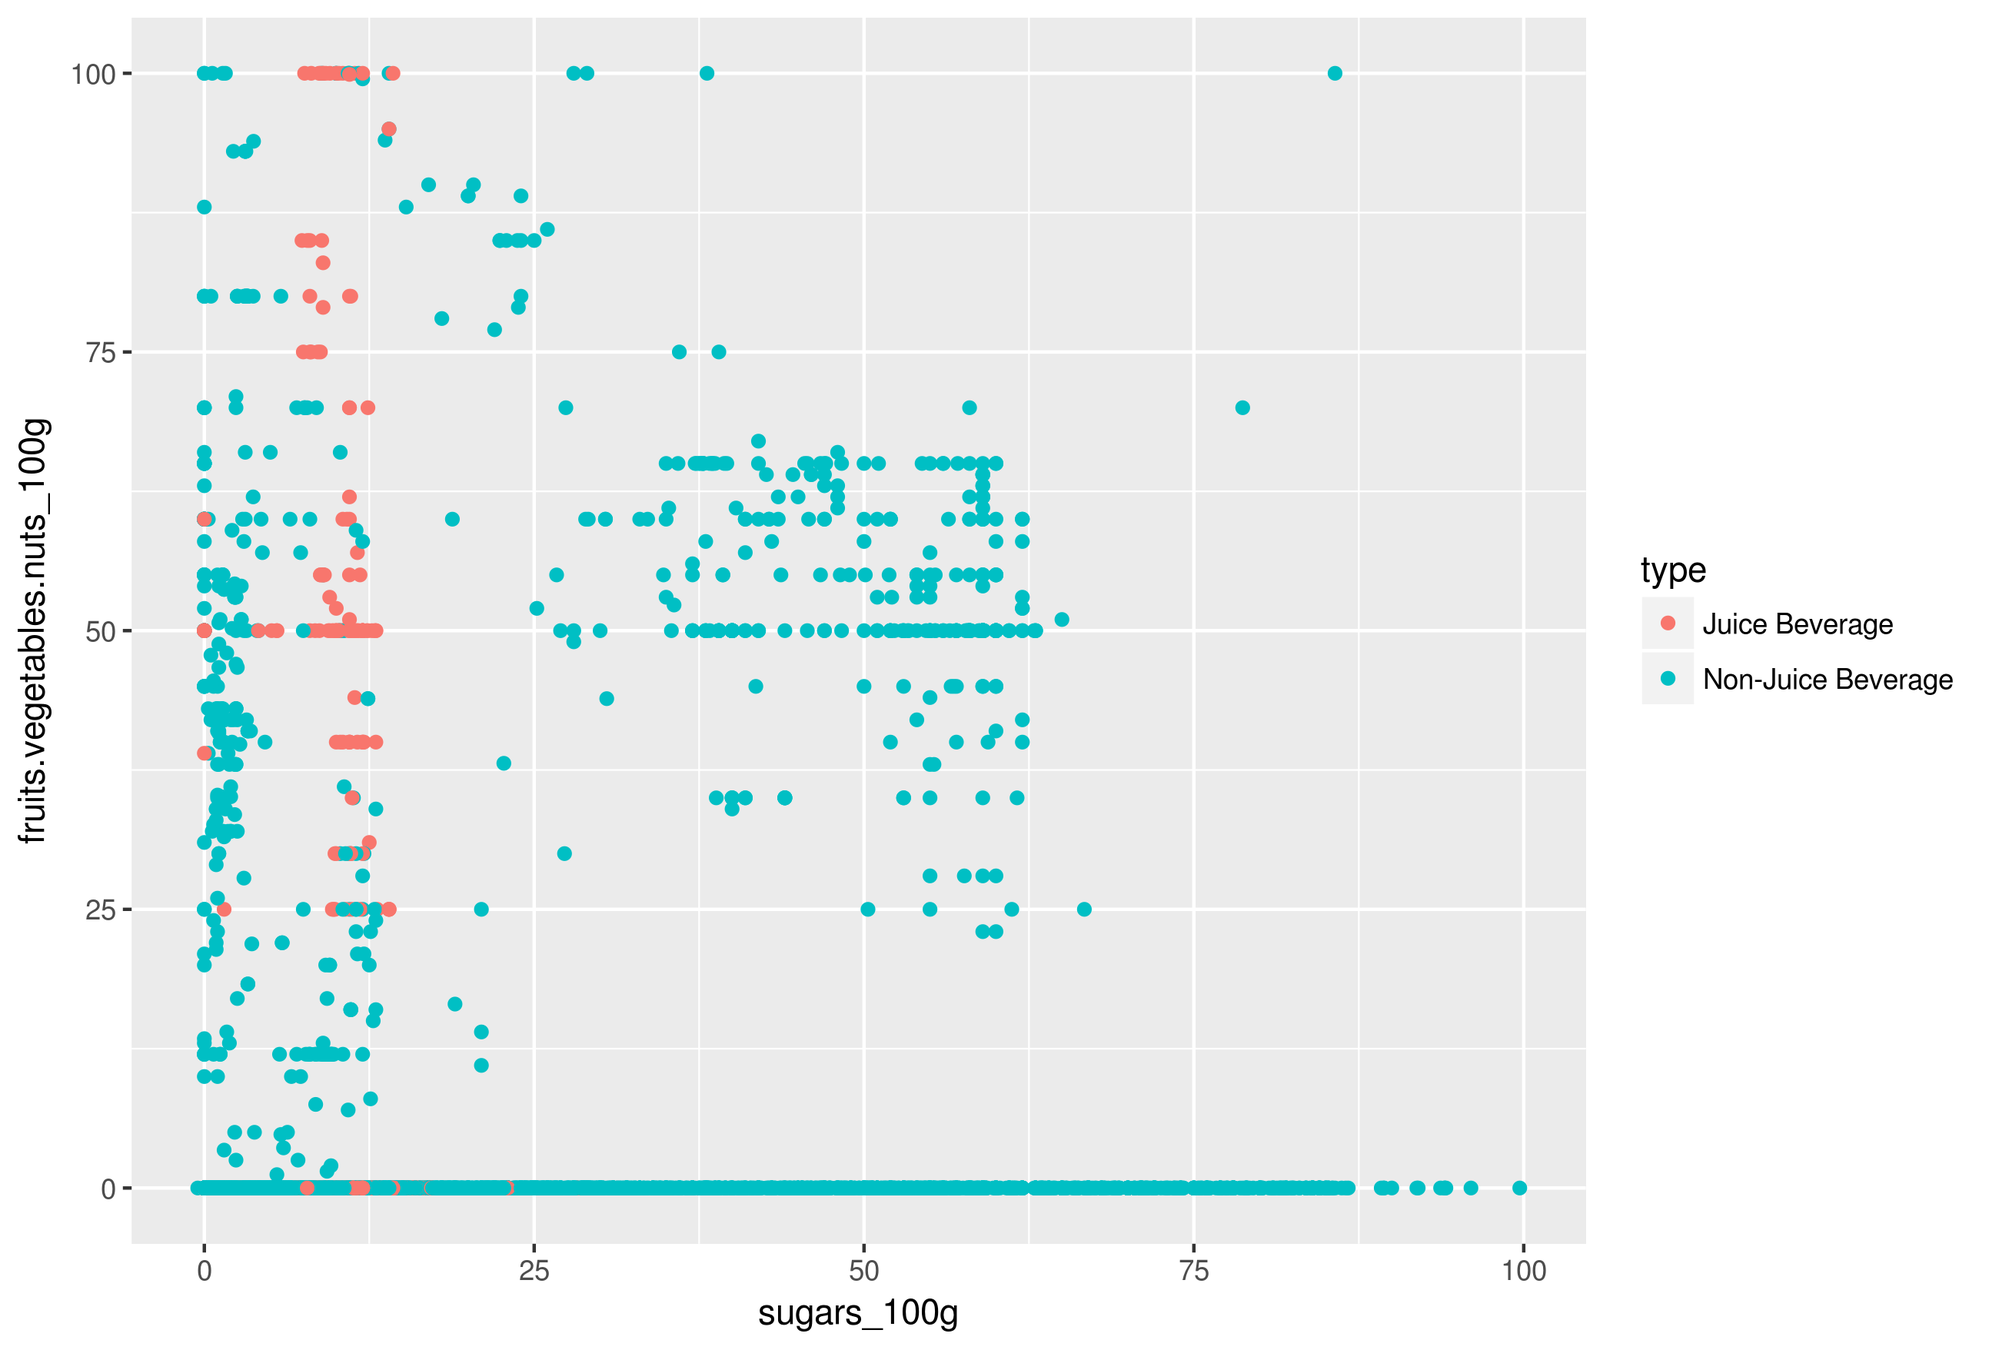
Figure 5
Beverage Nutrition Grade
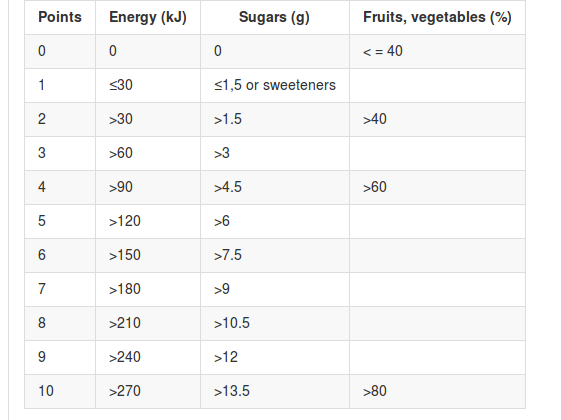
Threshold
Grade
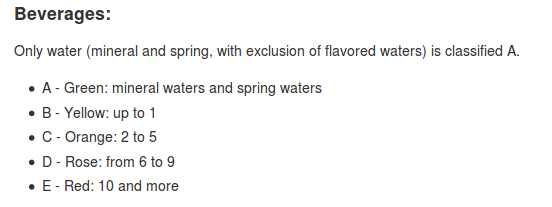
Beverage Nutrition Grade
Points Energy (kJ) Sugars (g) Fruits, vegetables (%)
0 0 0 < = 40
1 ≤30 ≤1,5 or sweeteners
2 >30 >1.5 >40
3 >60 >3
4 >90 >4.5 >60
5 >120 >6
6 >150 >7.5
7 >180 >9
8 >210 >10.5
9 >240 >12
10 >270 >13.5 >80Figure 6
Meat product - Types
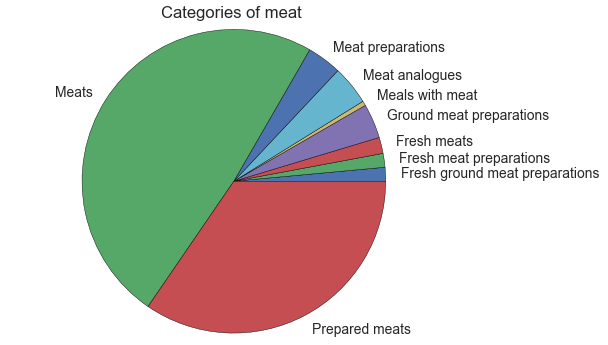
Figure 7
Meat product - Additives used
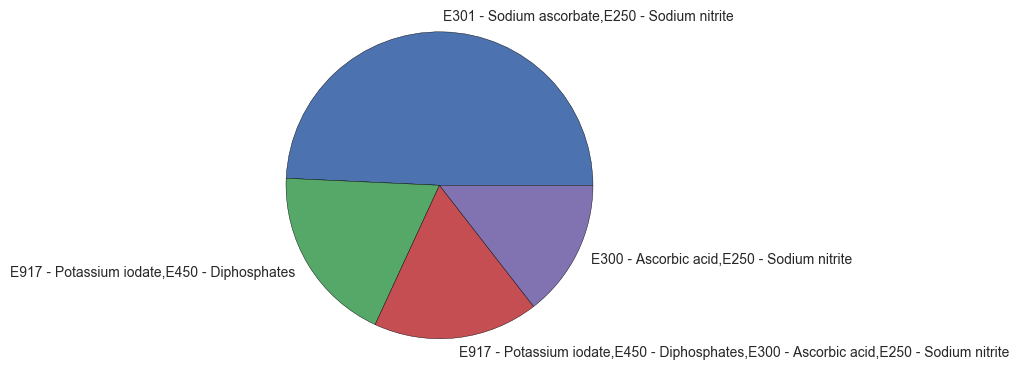
Figure 8
Overview
- Introduction
- Problems
- Cleaning & Preprocessing
- Interpretations
- Predictions
- Conclusion
Predicting Chocolate
The first attempt
- Trained a random forest with items tagged as chocolate
- Used sugar, fat, salt and energy content
- High accuracy due to low percentage of chocolate items -> need better quality measurement
- F1-score: 0.66
Predicting Chocolate
Ideas to improve the predictions
- Predict subtypes of chocolate
- Use more / different attributes
- play around with the number of trees in our forrest

Predicting Chocolate
Dark Chocolate
Figure 9
Predicting Chocolate
Dark Chocolate
- Predicting Dark Chocolate only
- Using Proteins and Carbohydrates in addition to the previous attributes
- F1-score: 0.77
Predicting Chocolate
Milk Chocolate
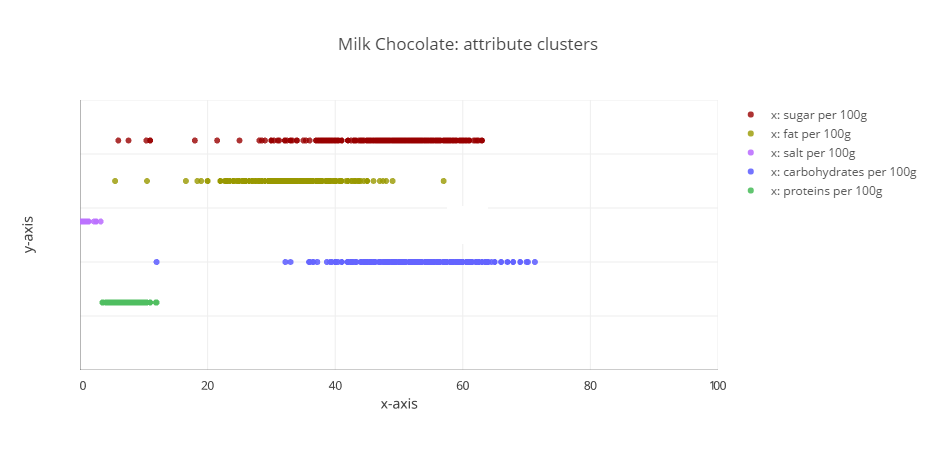
Figure 10
Predicting Chocolate
Milk Chocolate
- Better F1-score when leaving out carbohydrates
- Only chocolate-prediction that had improved results for a higher amount of trees (500 instead of 100)
- Still only F1-score of 0.56
Predicting Chocolate
White Chocolate
- Tried different combinations of attributes
- Still only f1-score of 0.23
- why?
Predicting Chocolate
White Chocolate
- Multiplied every white chocolate in the dataset x20
- Removed half of them before training and added them back in for testing
- The other half was split randomly between training and test set
- Result: F1-score of 0.88
Predicting Juice in Whole dataset
- Data consist (after removing empty categories_en cells):
- 1963 categorized as Juice
- 69234 categorized as non-Juice
- Split the data into:
- Train set (60%)
- Test set (40%)
- Using randomForest:
- Number of trees : 500
- F1-score : 0.695
Predicting Juice in Beverage dataset
- Data consist (after removing non-Beverage items):
- 1925 categorized as Juice
- 25852 categorized as non-Juice
- Split the data into:
- Train set (60%), Test set (20%), Validation set (20%)
- Attributes: fat, sugar, energy, sodium, fruits, fibre, protein
- Use 2 different methods to see which is better:
- randomForest
- naiveBayes
Predicting Juice in Beverage dataset
Result
- Naive Bayes: 0.22
- Random Forest: 0.73
Predicting missing Plant-based products
- Data :
- Missing category entries: 23443
- Attributes used: protein, fat, sugar, carbohydrate, energy
- Split the data into:
- Train set (60%), Test set (20%),Validation set (20%)
- Method : Random Forest Regressor
- Result:
- Recall: 0.79
- Precision: 0.85
- F1-score: 0.82
Predicting missing Plant-based products
- Total missing values : 2315 ( w.r.t to non NAN values for protein, sugar, carbohydrate, fat and energy)
- Labelled : 434
- We manually checked 30 values and 25 out of them were plant based.
Overview
- Introduction
- Problems
- Cleaning & Preprocessing
- Interpretations
- Predictions
- Conclusion
Conclusion & Lessons-learnt
- We learnt about different data mining techniques.
- How to apply machine learning techniques
- Learning R and Python for data exploration
- Using different tools like Python Notebook
Tools


THANK YOU
World Food Facts
By Vivek Sethia

