Interactive Debugging in PHP
What we're doing now?
var_dump($var);
print '<pre>' .print_r($var, true) . '</pre>';
var_dump(debug_backtrace());
dump($var); die();
Any more cool know-hows?
What is debugging?
- Finding broken code.
- Figure out why.
- Fix.
- Check.
- Repeat.
How can we improve?
- Use Symfony VarDumper
- Use Xdebug's dump
- Use Firebug with FirePHP for anyc requets
An even better option!
Interactive debugging:
- ZendDebugger
- XDebug
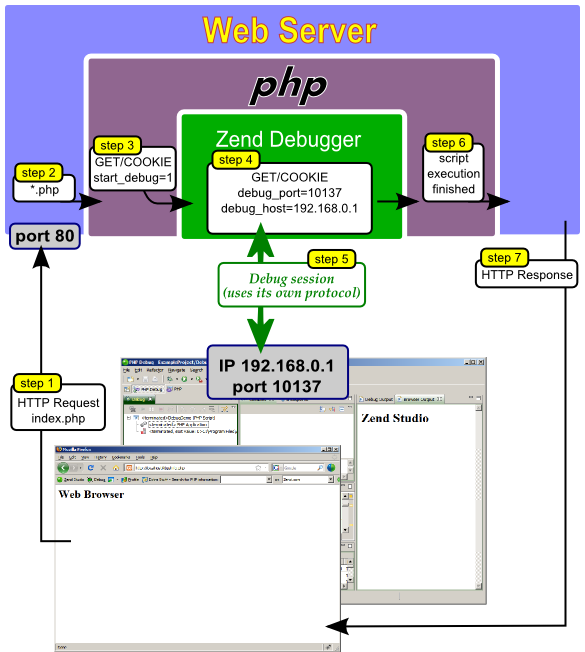
Understanding HTTP Requests
GET / HTTP/1.1
Host: example.com
Cookie: XDEBUG_SESSION=PHPSTORM
Xdebug:
Zend Debugger:
GET / HTTP/1.1
Host: example.com
Cookie: debug_host=192.168.50.1; debug_port=10137; debug_start_session=1
Query params are also possible:
GET /?debug_host=192.168.50.1&debug_port=10137 HTTP/1.1
Host: example.com
Server Environment
printenv
vagrant@fusion:~$ printenv
SSH_AGENT_PID=14079
XDG_SESSION_ID=3
TERM=xterm
SHELL=/bin/bash
php -i
PHP Variables
Variable => Value
_SERVER["SSH_AGENT_PID"] => 14079
_SERVER["XDG_SESSION_ID"] => 3
_SERVER["TERM"] => xterm
_SERVER["SHELL"] => /bin/bash
_SERVER["argv"] => Array()
_SERVER["argc"] => 0
_SERVER["PHP_SELF"] =>
_SERVER["DOCUMENT_ROOT"] =>
So... How what do you do next?
- Setup a debugger
- Install and IDE that supports debugging
- Either set the cookie or query params
- Send the request
- ???
- Profit!
Setting up Xdebug
- Connect to your Vagrant box
- sudo vi /etc/php5/mods-available/xdebug.ini
- Add a remote host: 192.168.50.1
- :wq
- sudo service php5-fpm restart
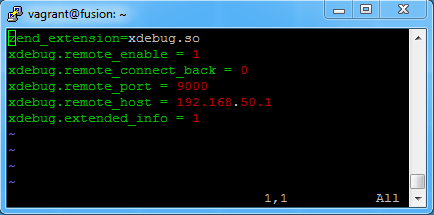
Your xdebug.ini should look like this:
Debugging with phpStorm
- Create a debug bookmarklet
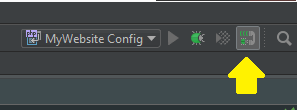
- Listen for Debug connections
- Set a Cookie in the browser
- Send the request
- Open phpStorm and respond to an incoming connection
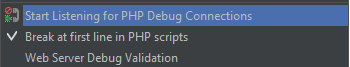
Run > Start Listen for PHP Debug Connections
2.
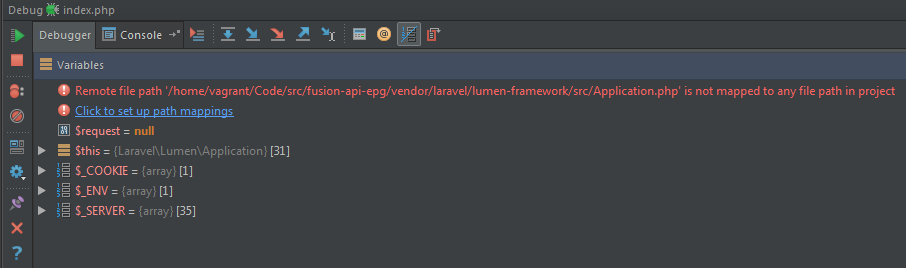
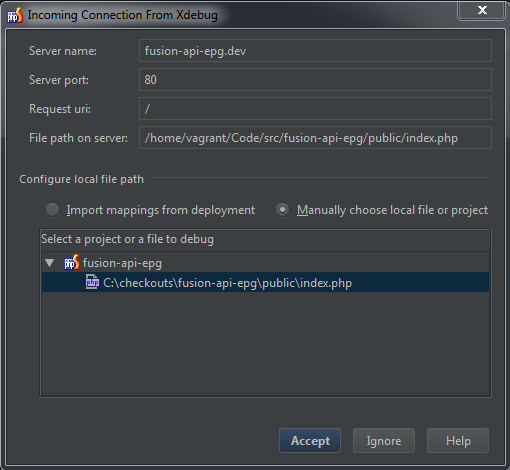
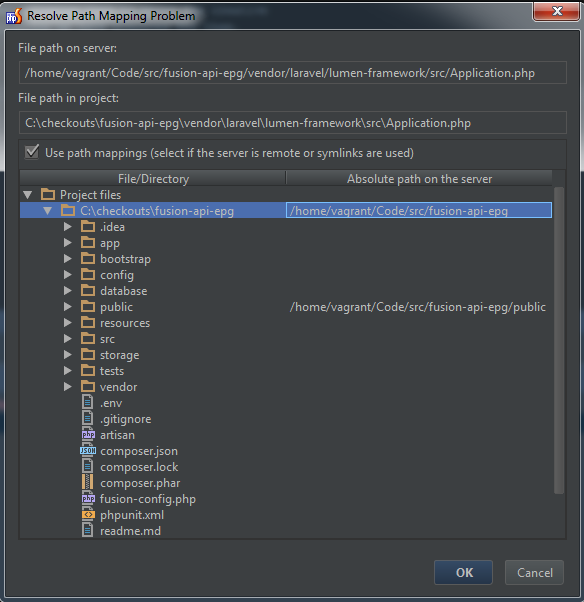
Map the root of the project
In this case we map to: /home/vagrant/Code/src/fusion-api-epg
phpdebug
By Alex Niedre
phpdebug
Debugging in PHP