Data Visualization

Introduction, Tools and Practice

Amr Eleraqi

Data Journalist - Co-founder of @TnfoTimes

Course Overview

  • What is Data Visualization?
  • Why to Visualise?


  • Data Viz Goals
  • Thinking and Seeing


  • From Data to Graphics
  • Data Viz Techniques


  • Tools
  • Effective Data Viz

Introduction


Foundation & Theory


Building Blocks


Construction


What is Data Visualisation?

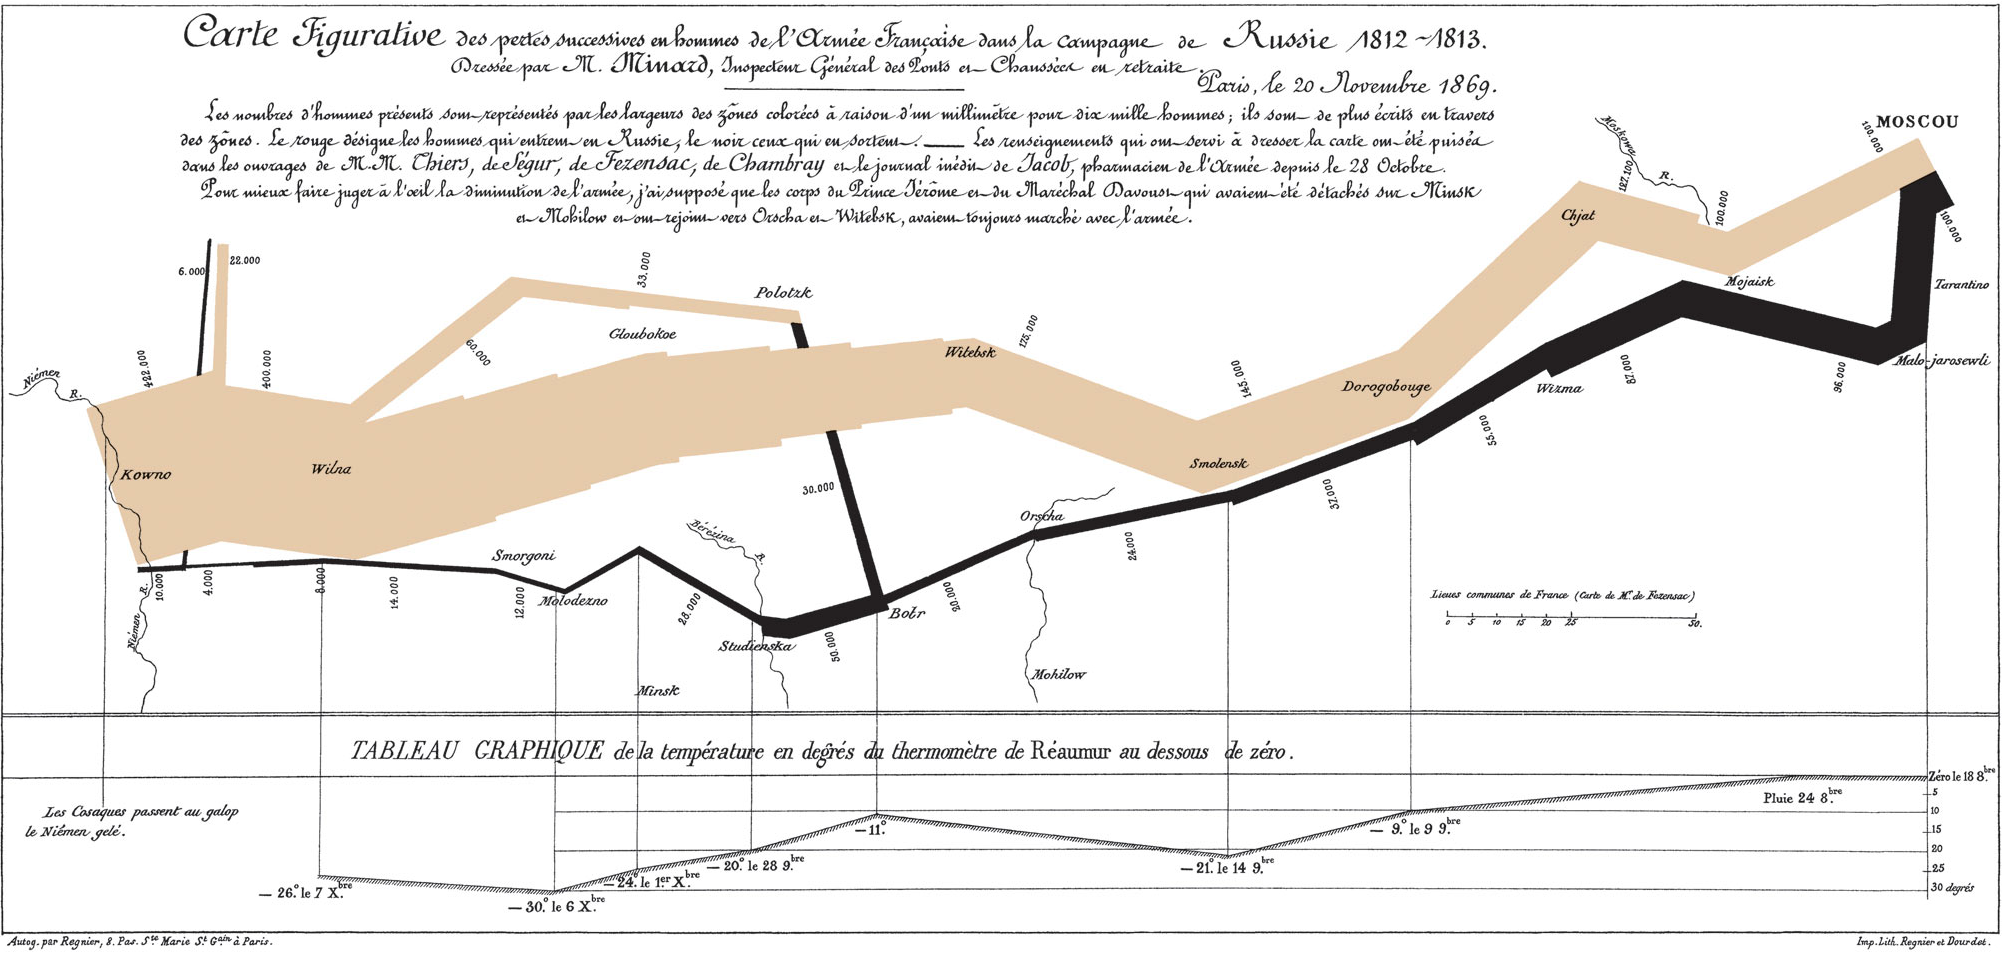
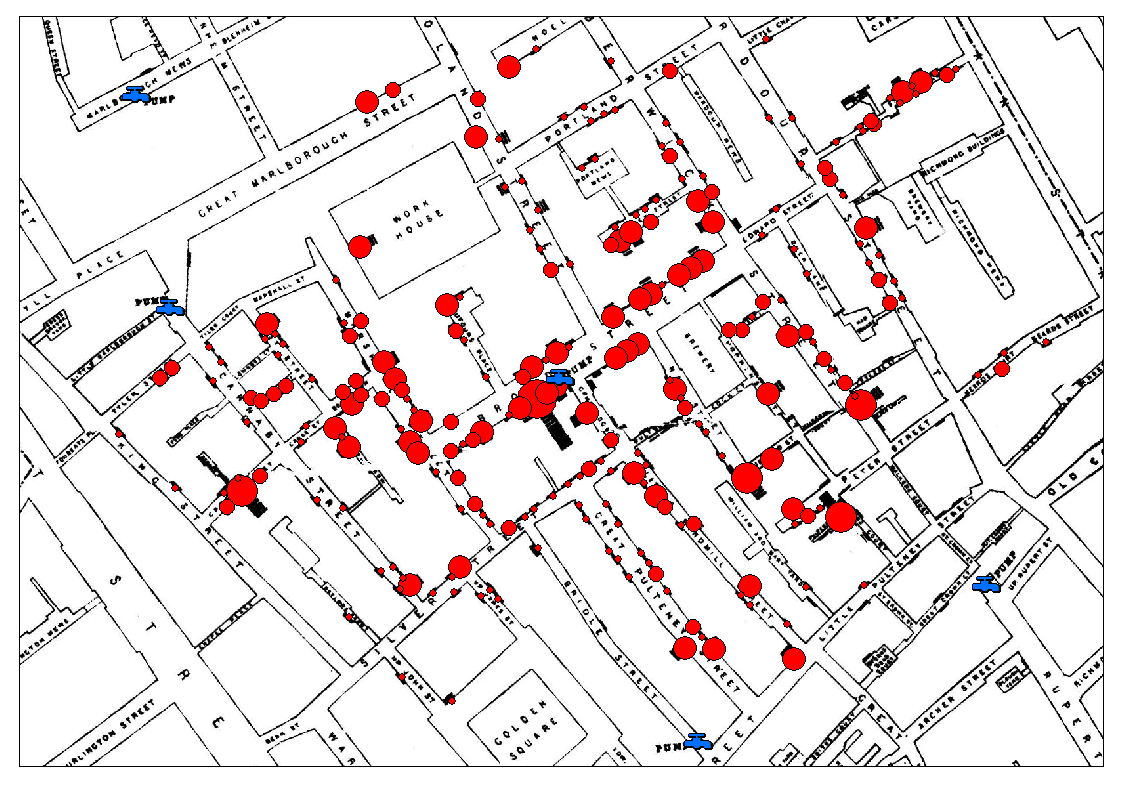
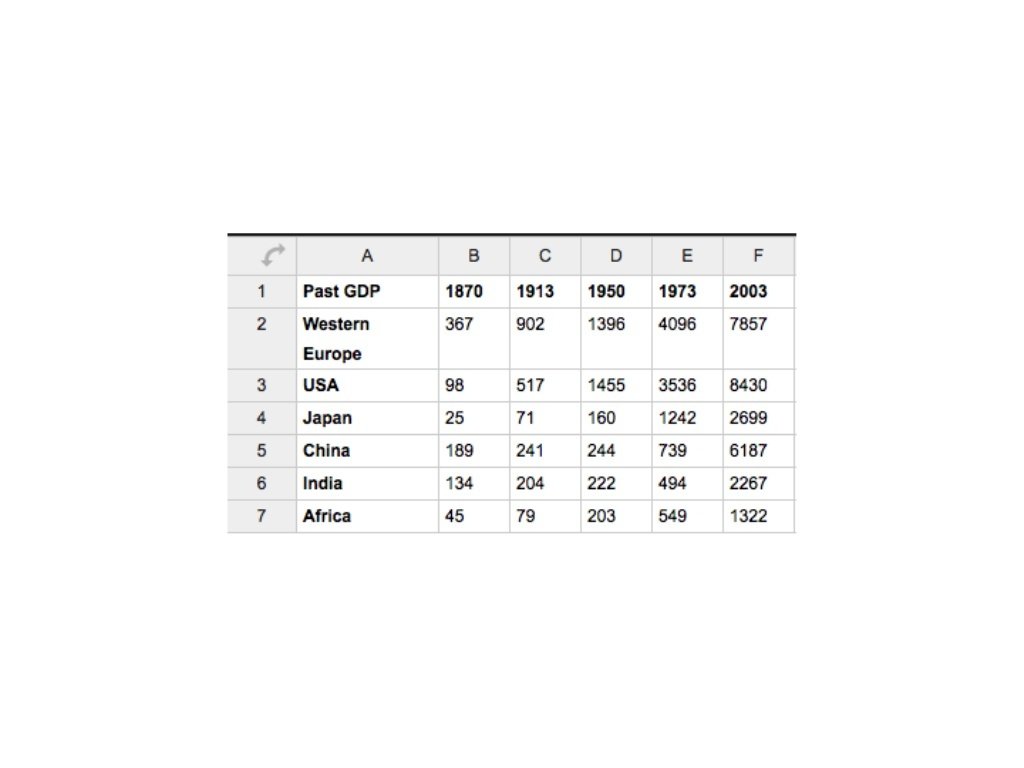
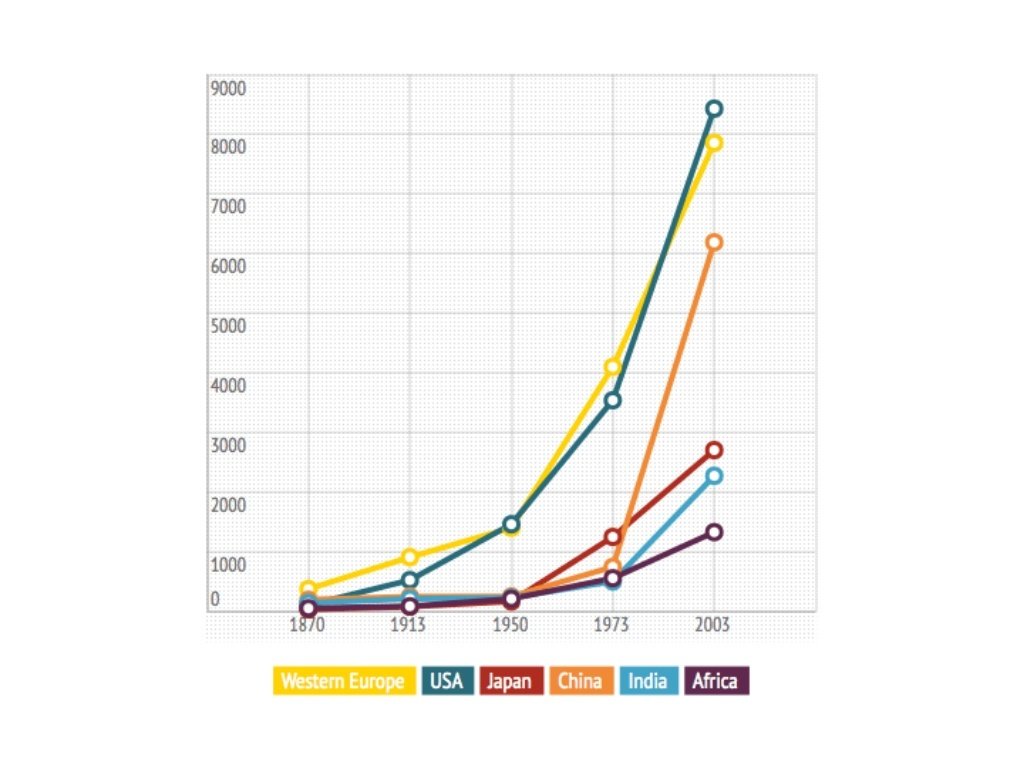
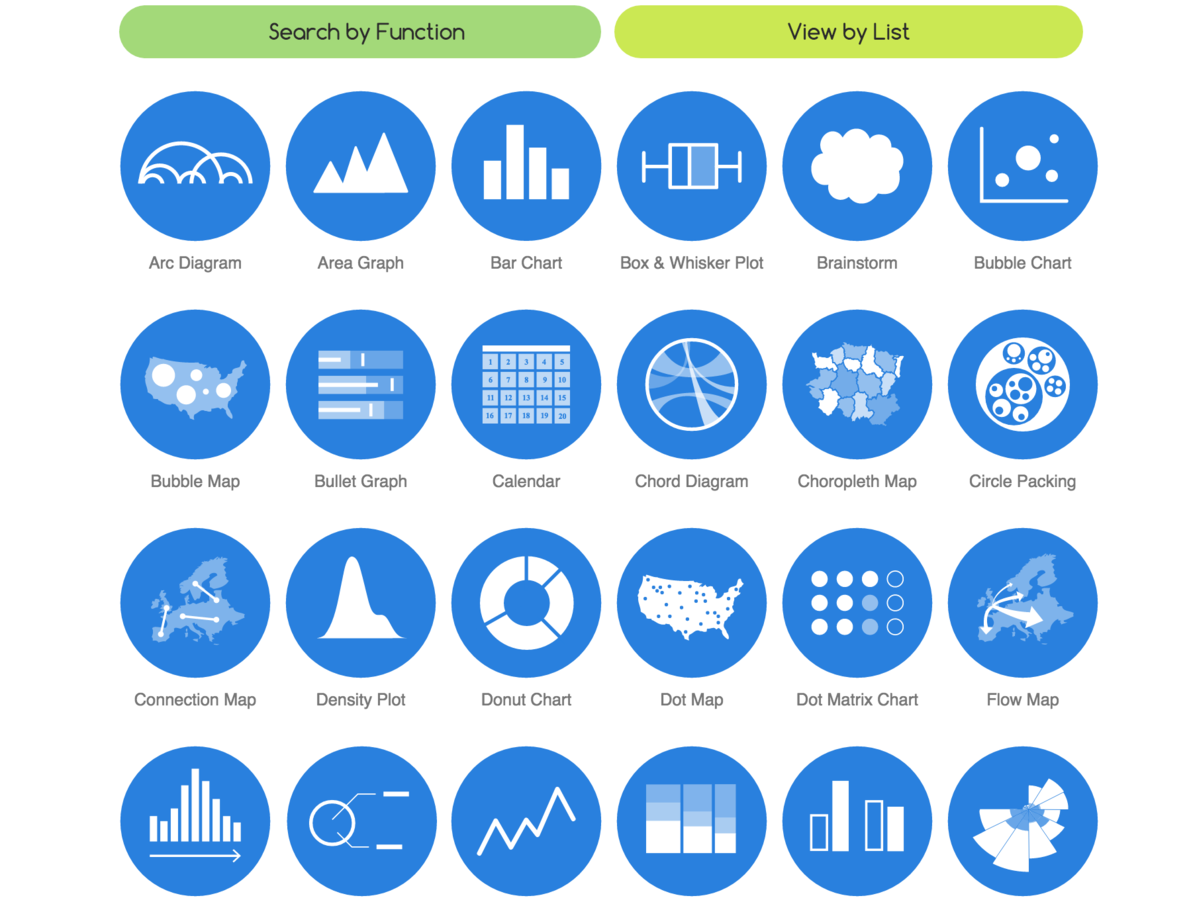
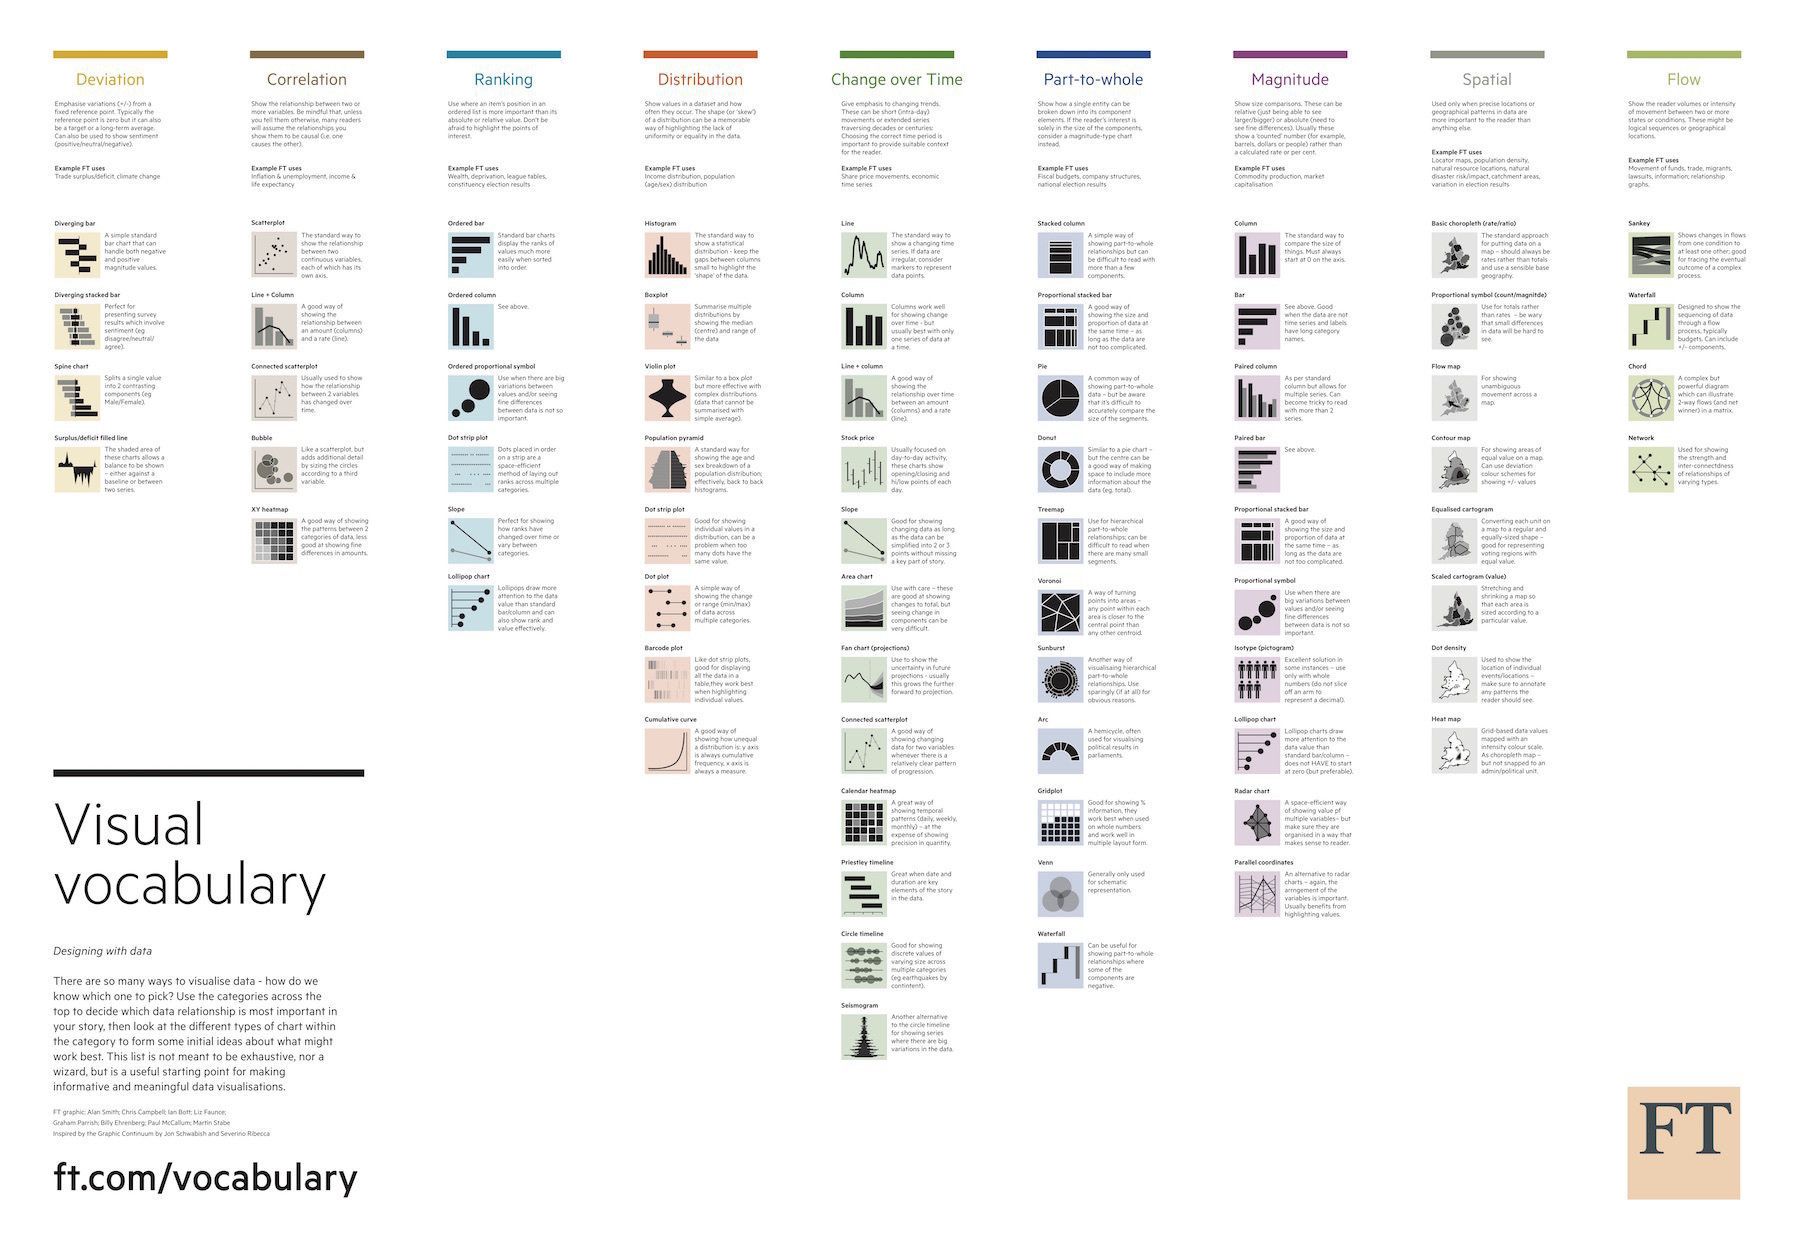
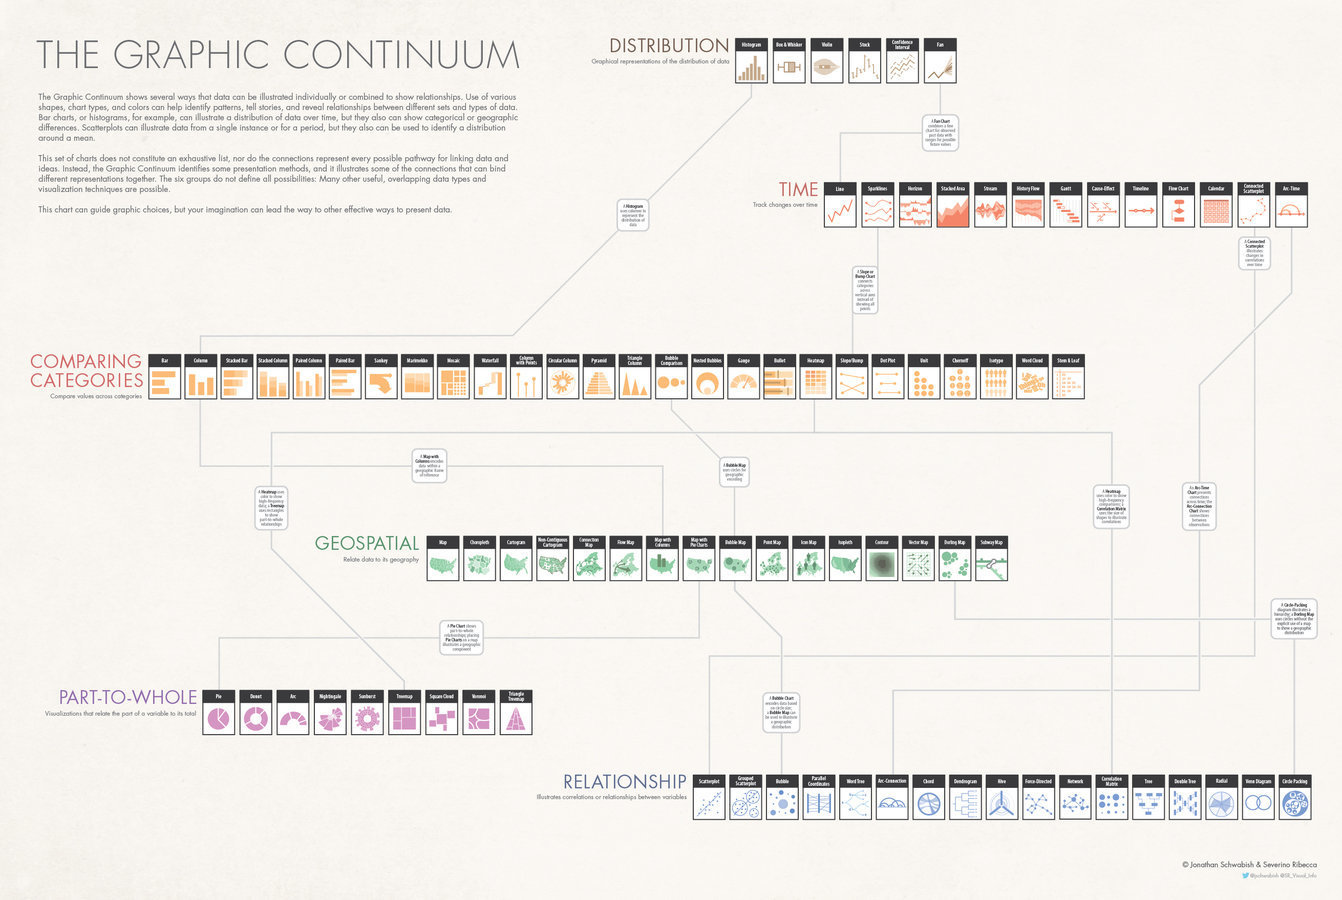
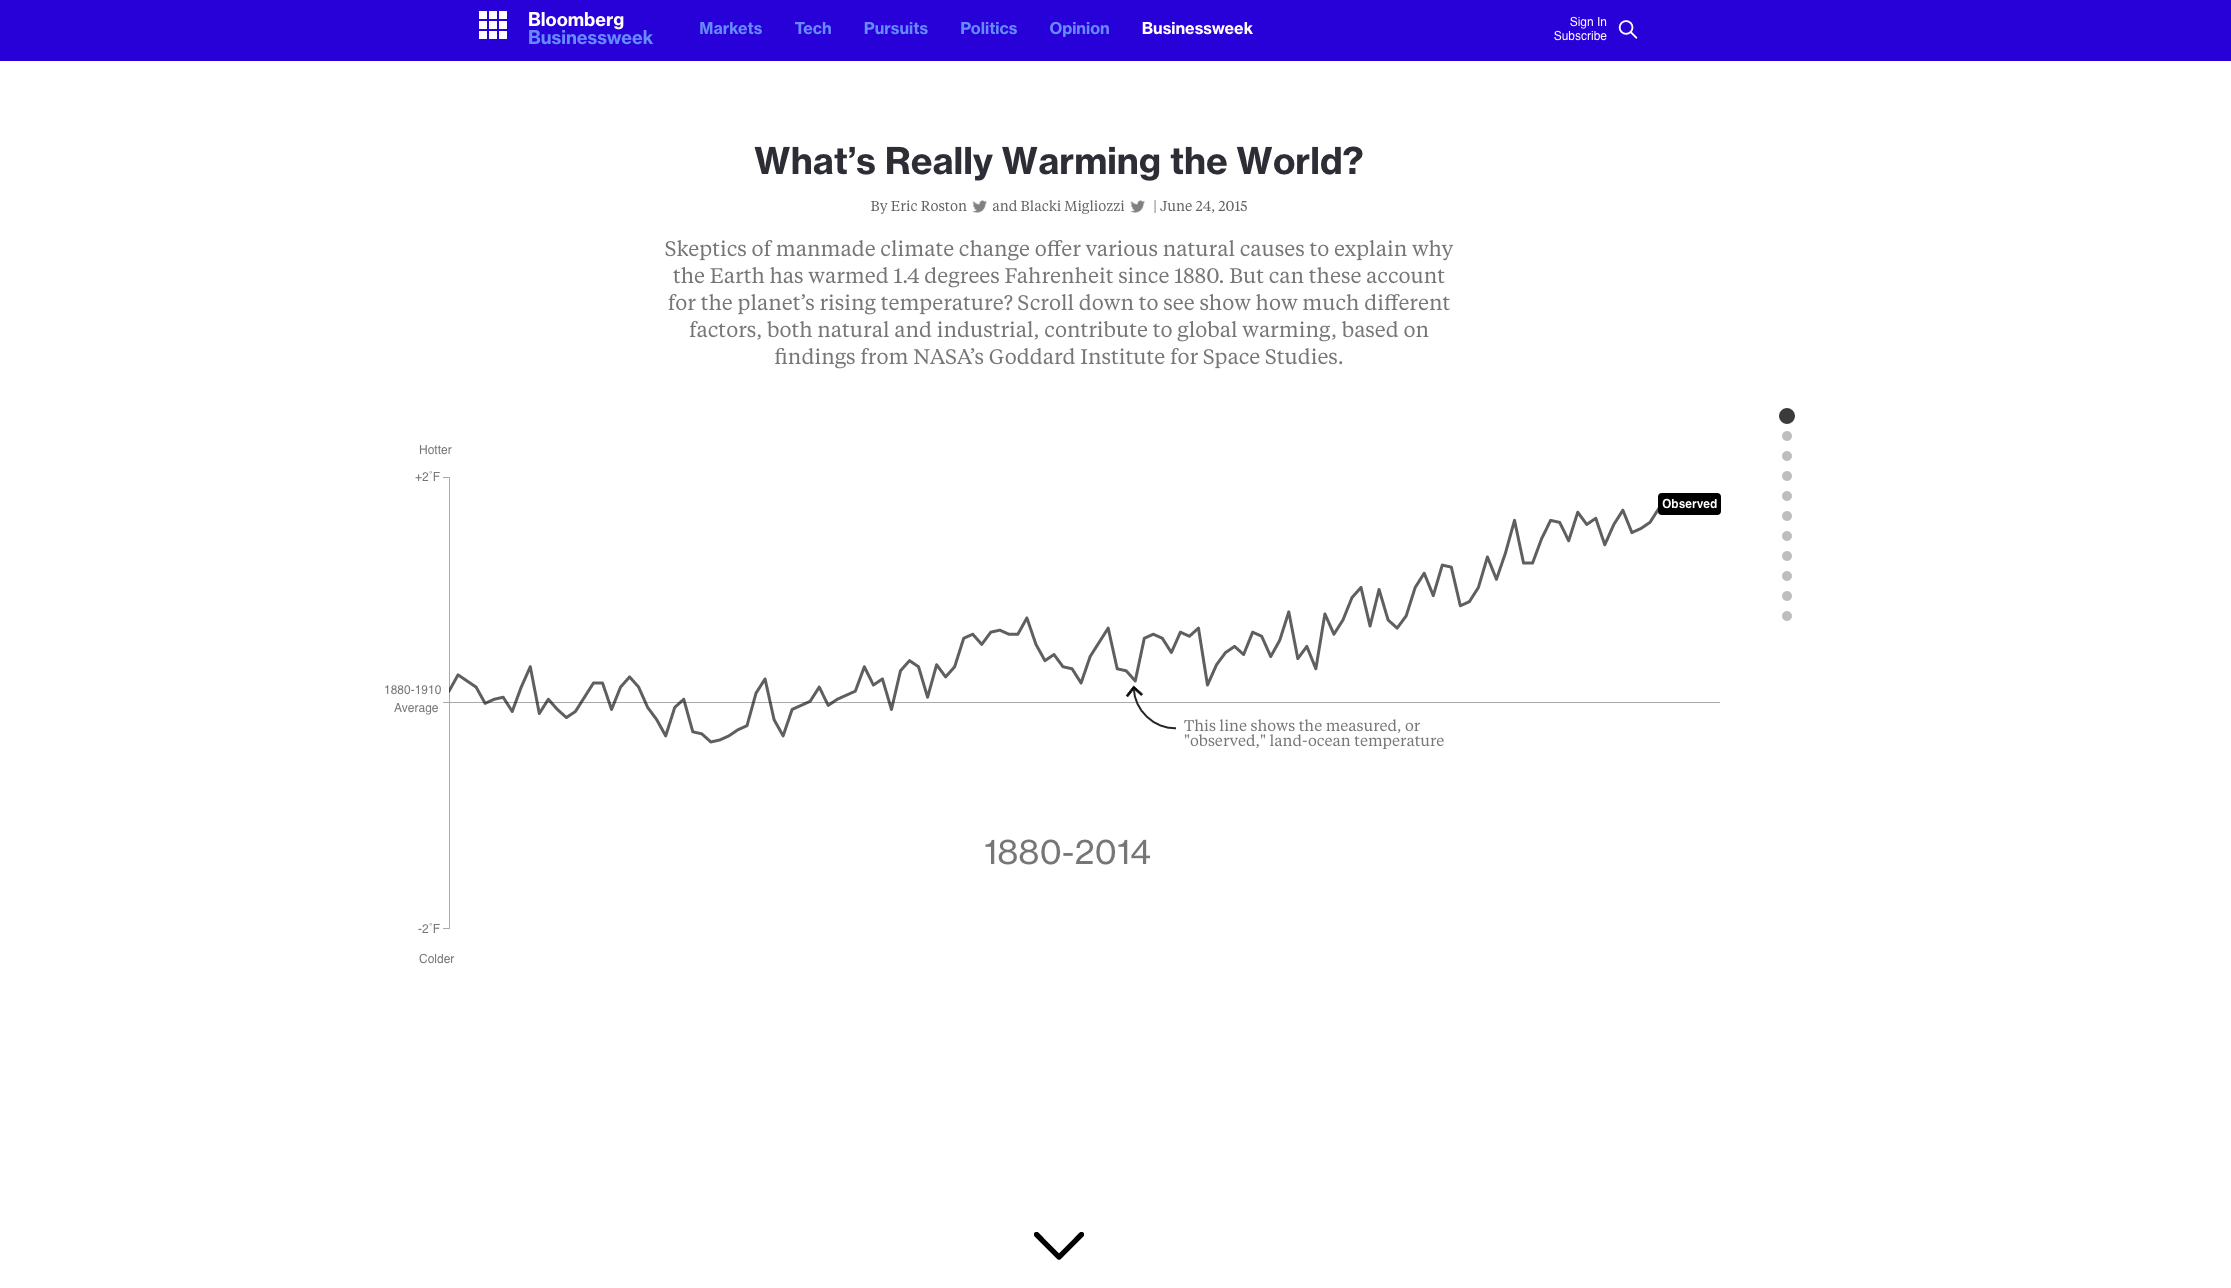
Data visualization is broadly defined as a method of encoding quantitative, relational, or spatial information into images.

Images: Menard's figurative map (left) and Snow's dot map (right), from Wikimedia


"Everything that can be expressed in numbers can be represented by lines."
       

John Playfair

Why to Visualise?

Title Text

Why to Visualize

  • Perception of information
  • From complex to simple
  • Explore the data
  • Quick answers
  • Resolve ambiguity
  • Locate outliers
  • Understand structure and patterns
  • .................

Data Viz Goals

Explanatory

Explaratory

INSPIRATION

Thinking and Seeing

From Data to Chart

Title Text

Data Viz Techniques

Data Viz Tools

Title Text

Effective Data Viz

Accuracy

Don't cut bars

Don't cut time

Label directly

Label directly

Save the pie for desert

Save the pie for desert

Don't do 3D

Don't do 3D

Thanks!

Dataviz

By Amr Eleraqi

Dataviz

  • 1,021