


Andy Rutkowski
Visualization Librarian at USC Libraries
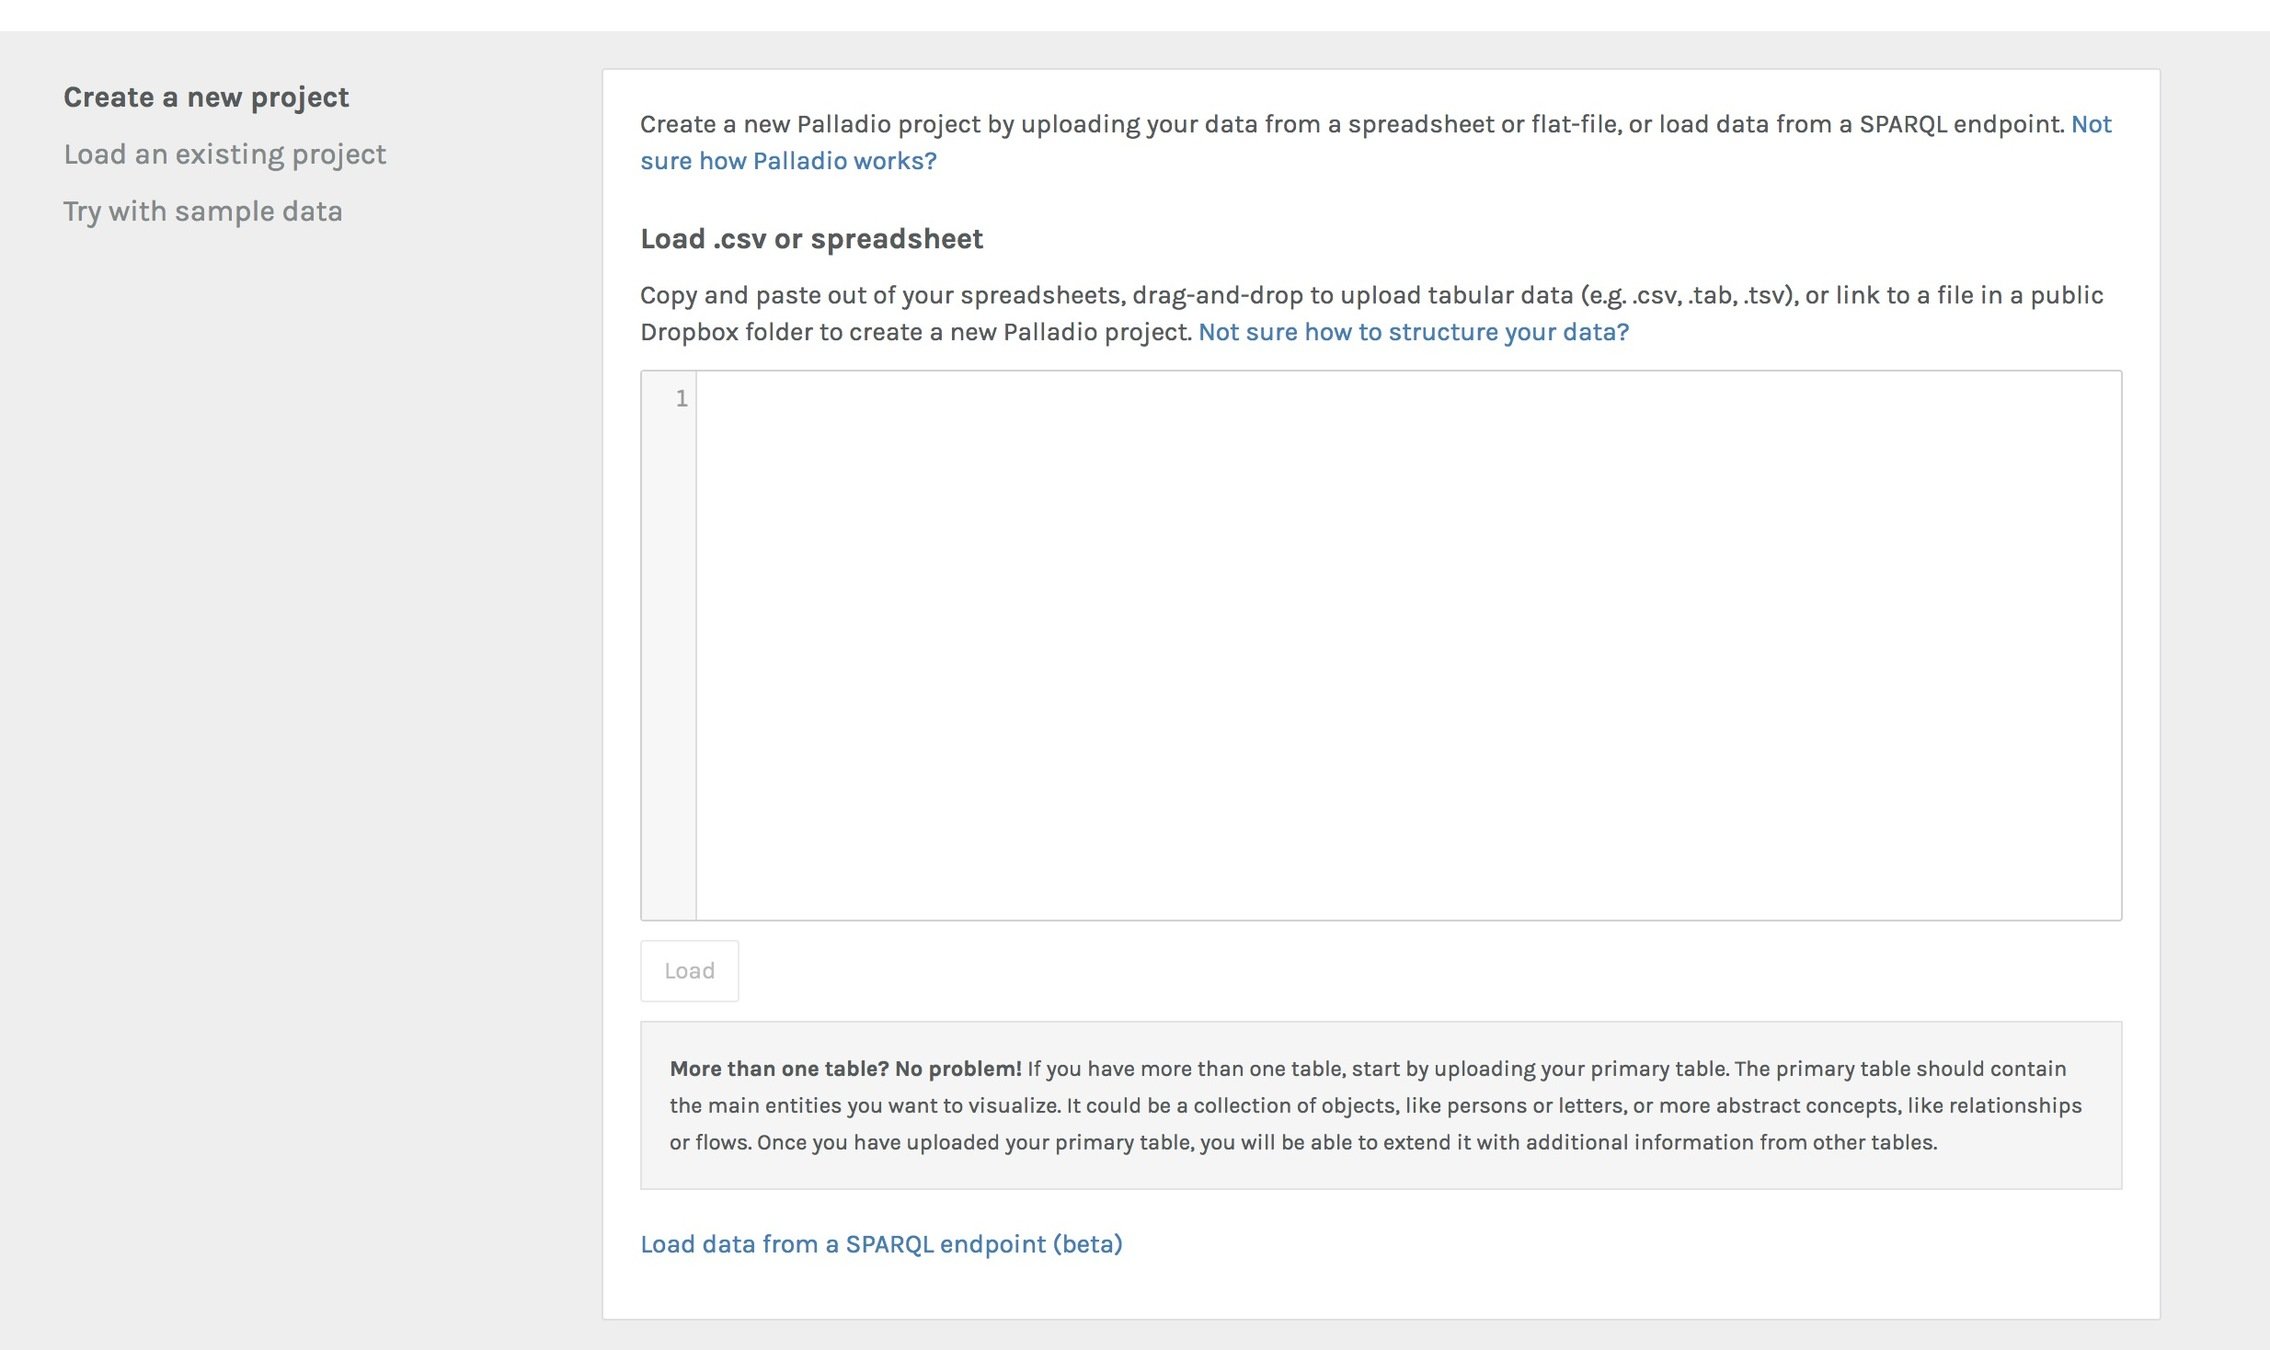
Use the links on the research guide to download data files
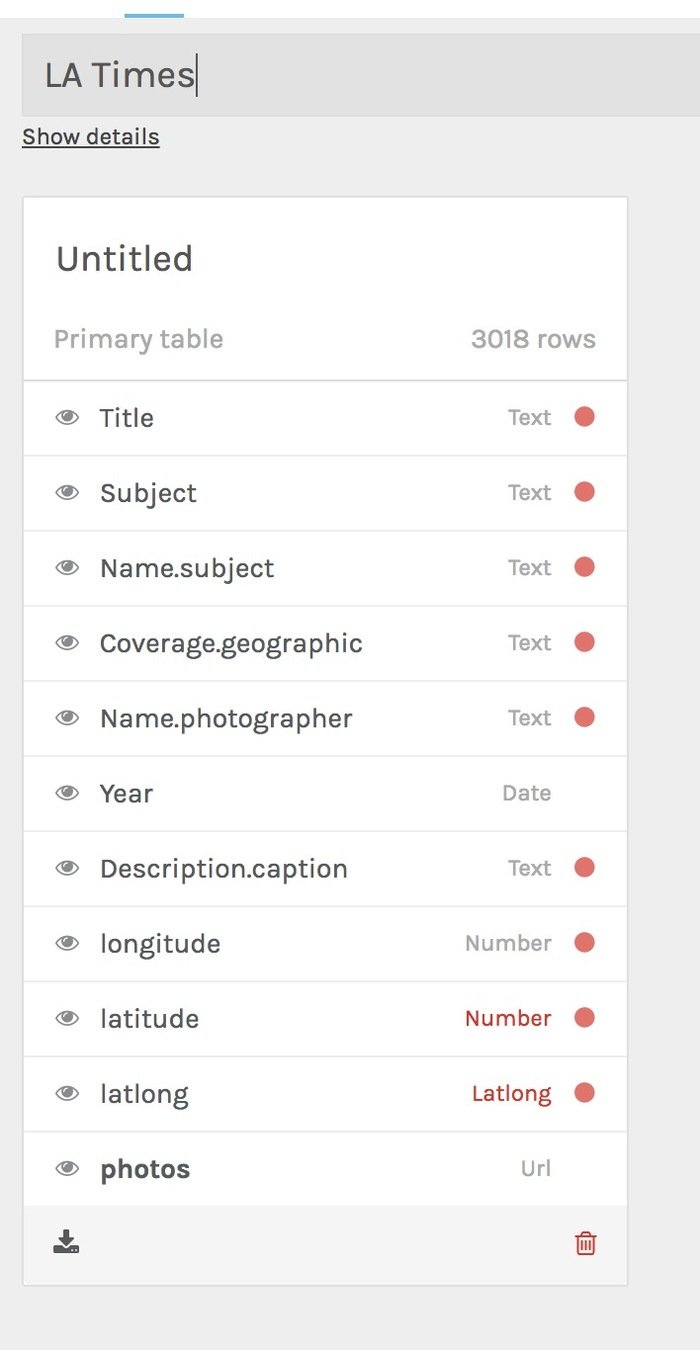
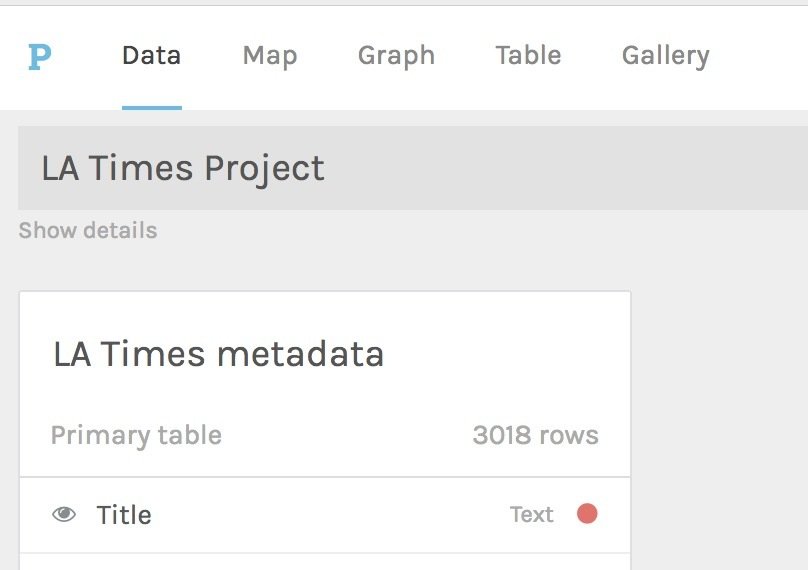
Name your project and look at your data!
At this point you can select any data and change formats - text, number, Latlong, etc.
Once your data is set you can then move onto making a map, graph, table, or gallery
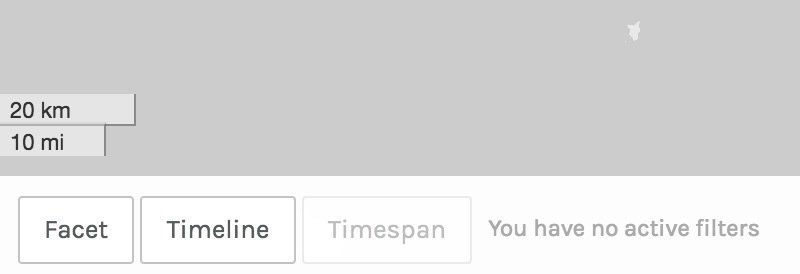
Map it!
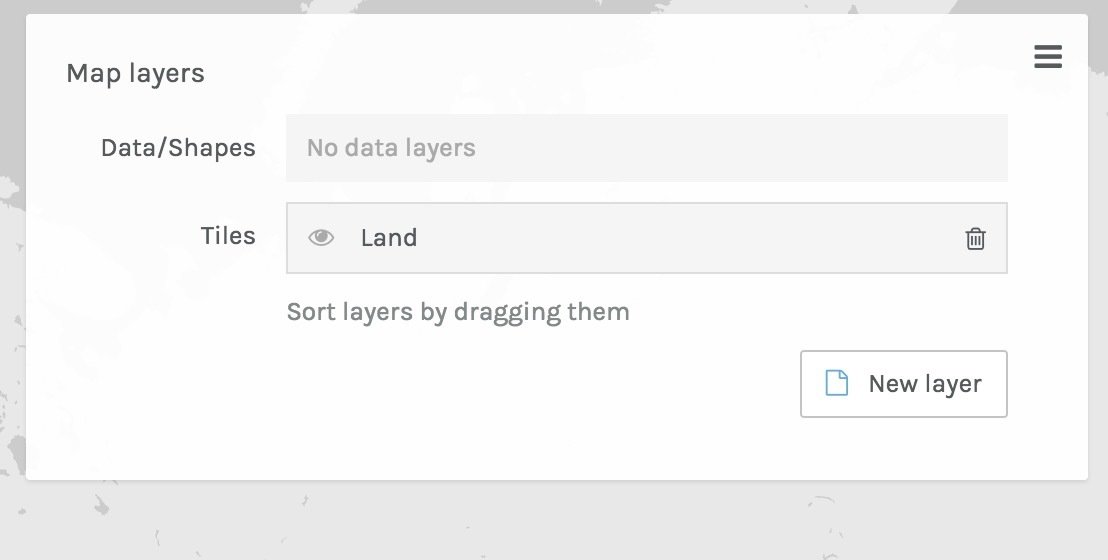
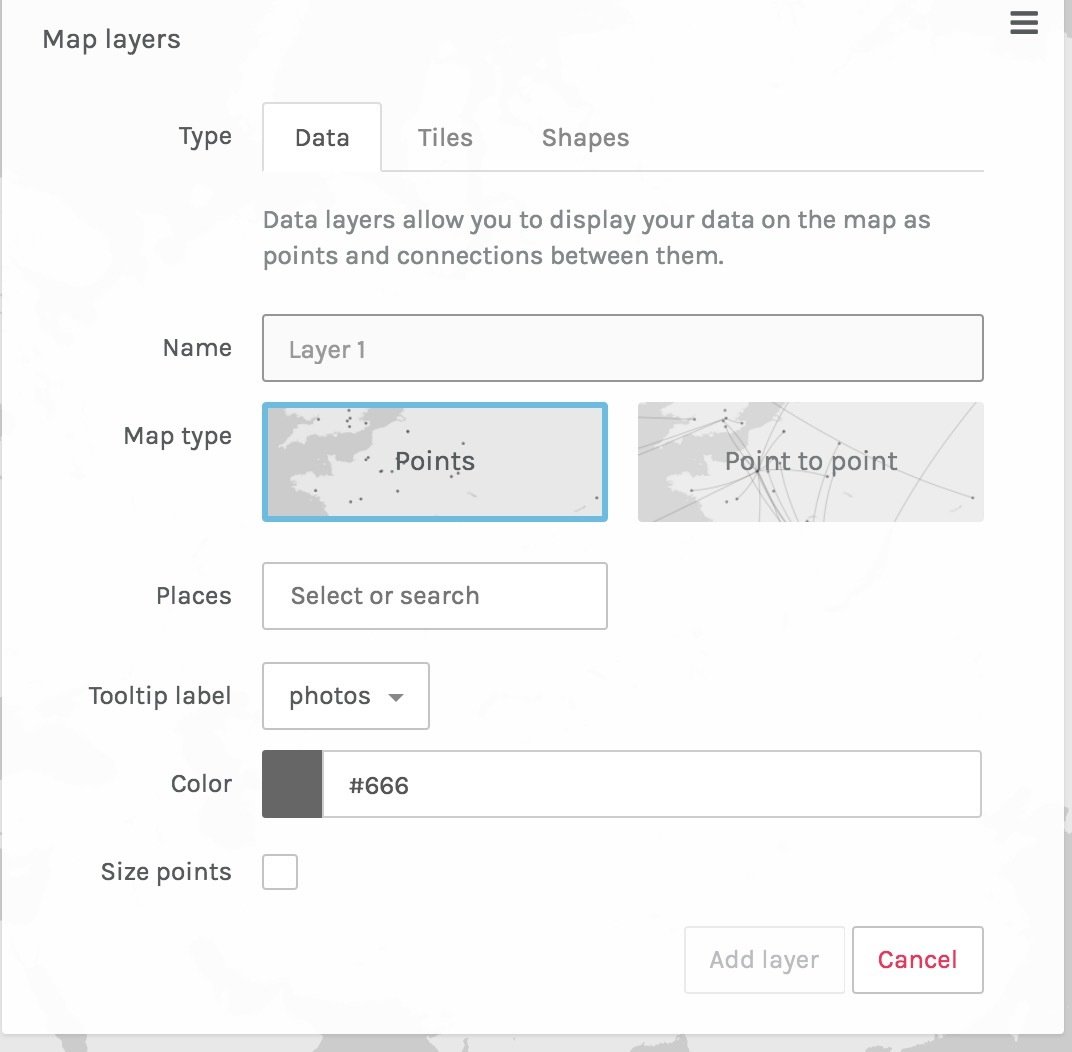
Click on New layer
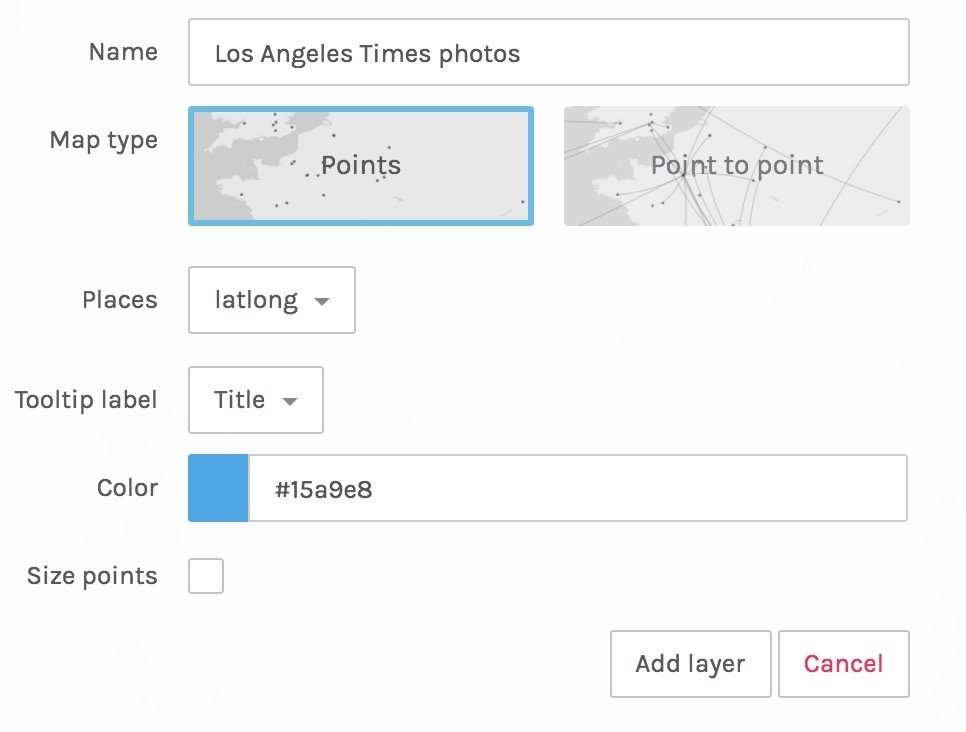
Name it and then from the places select "latlong". Select a tooltip and pick a color. And finally add the layer.
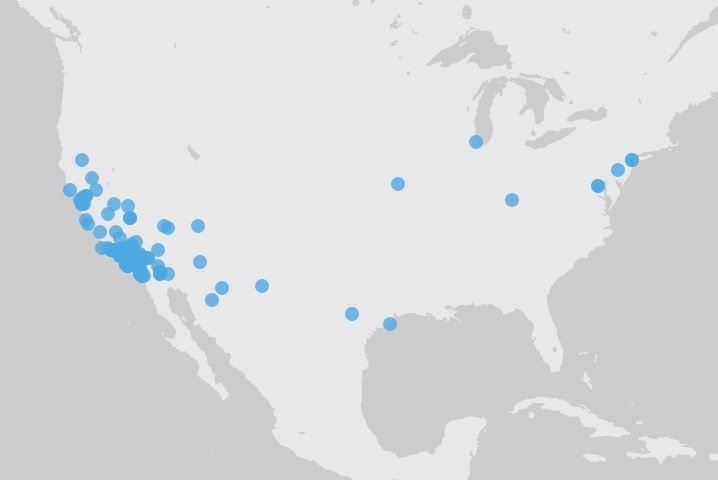
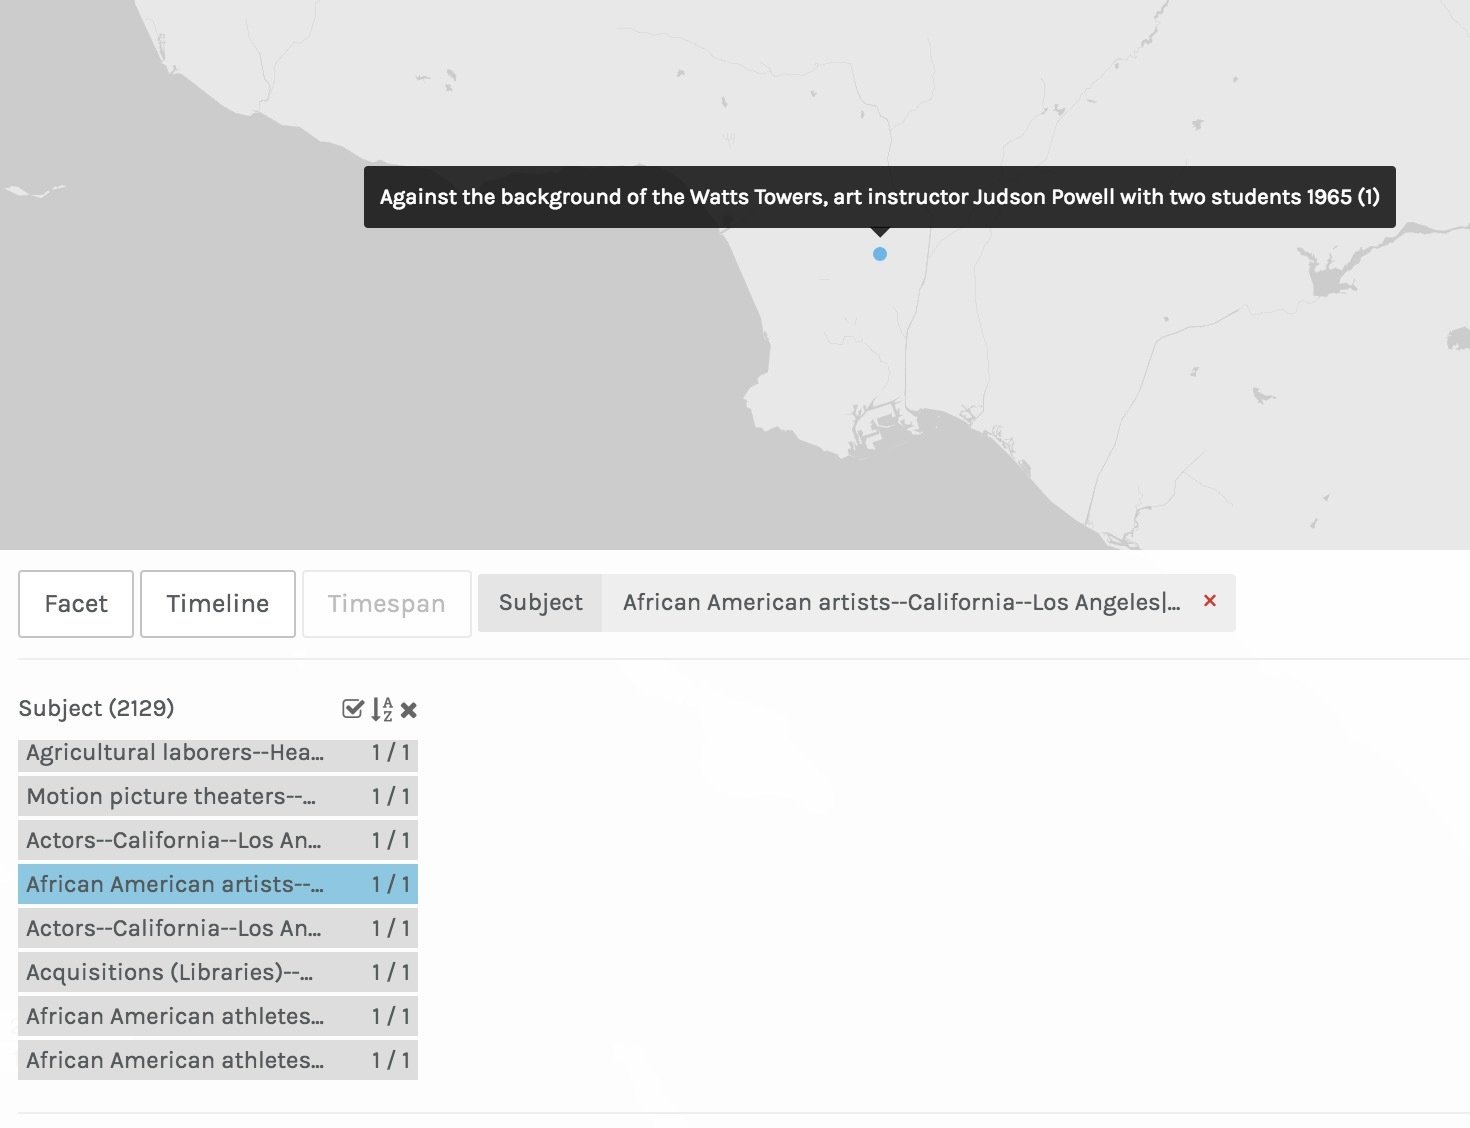
You should now see a simple map.
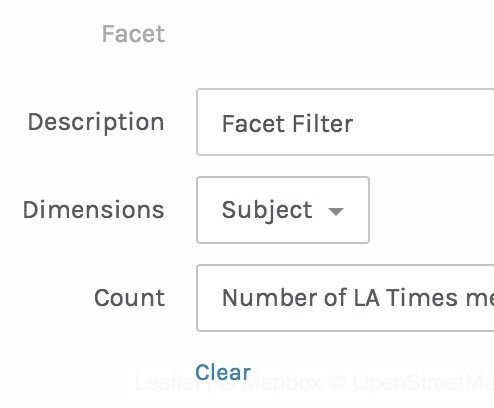
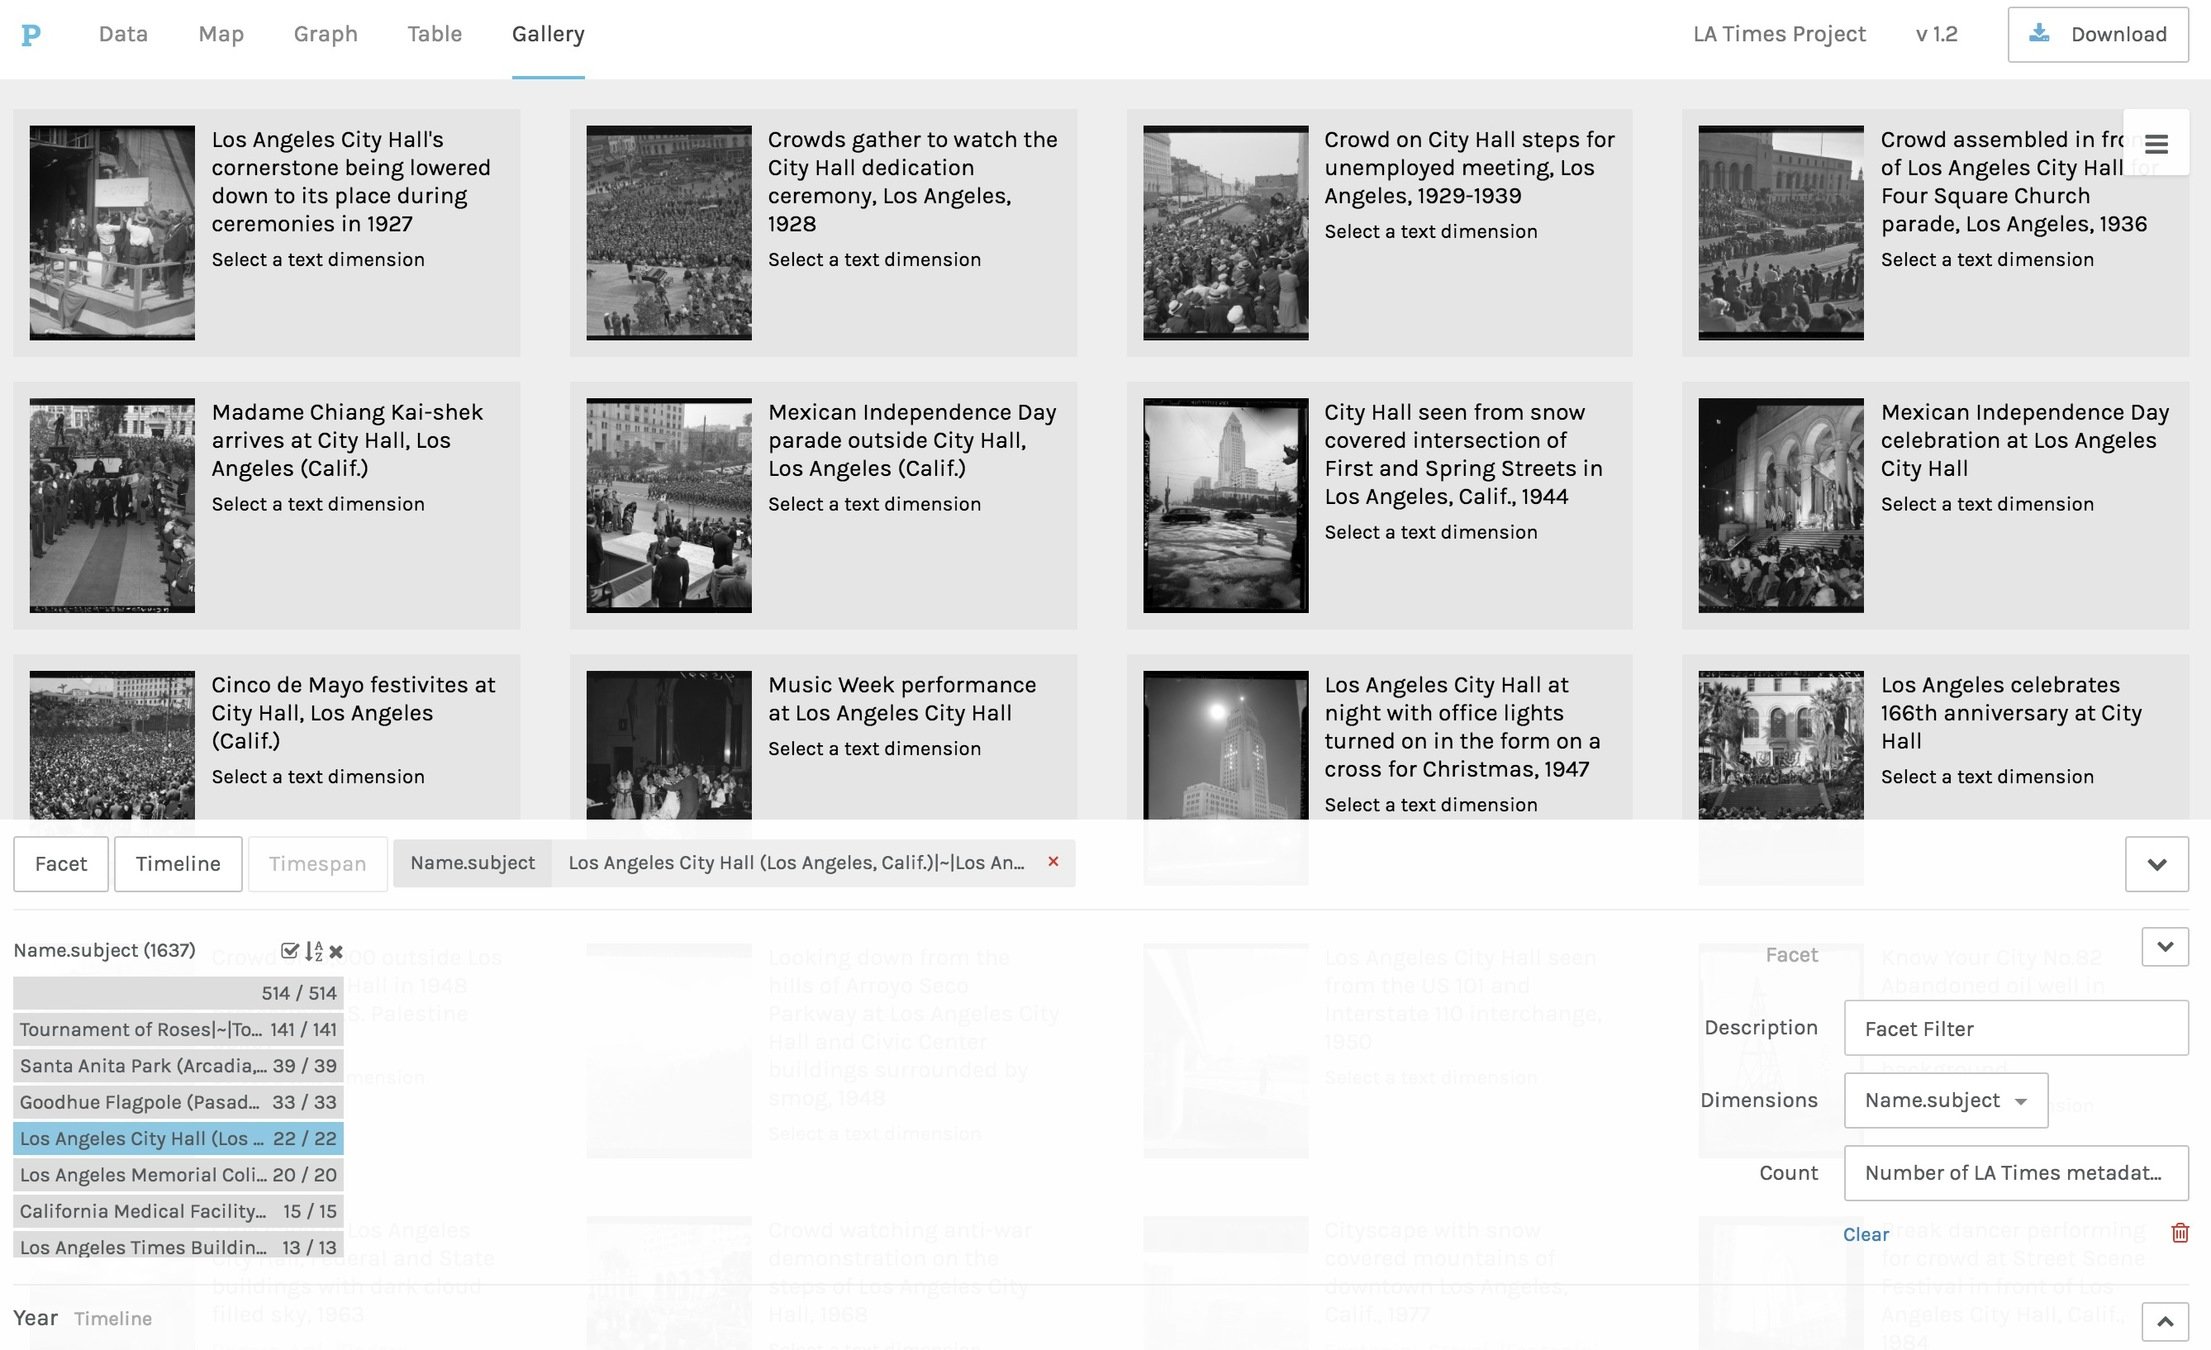
Choose subject for dimension
You can now scroll through all 2129 subjects and easily pick one and see all photos associated with it.
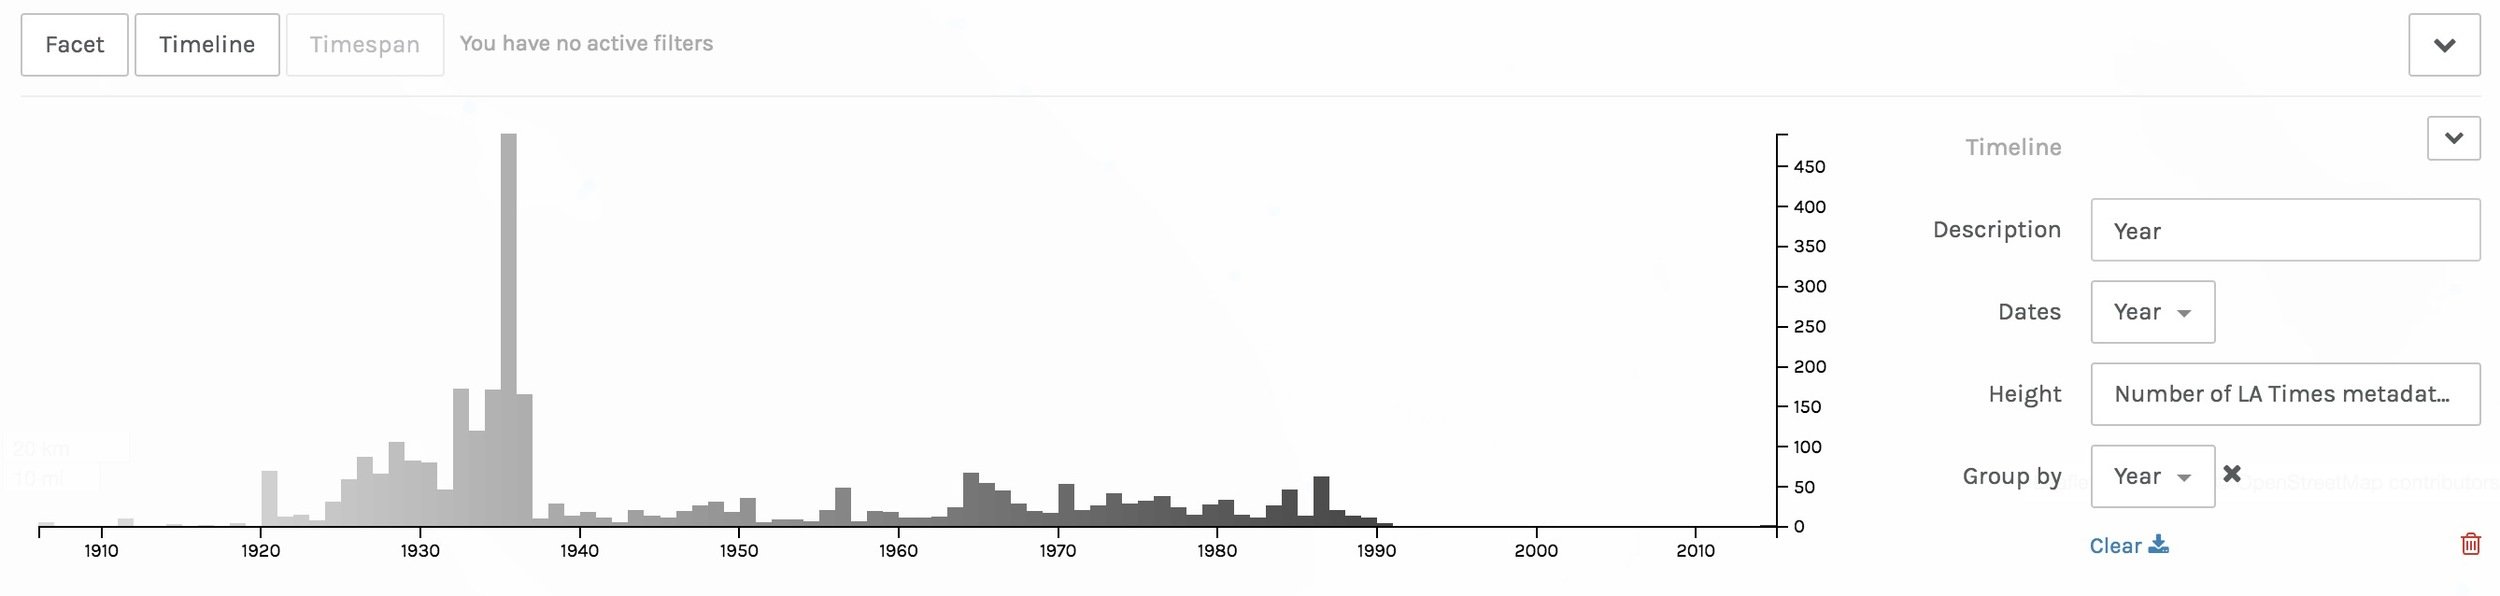
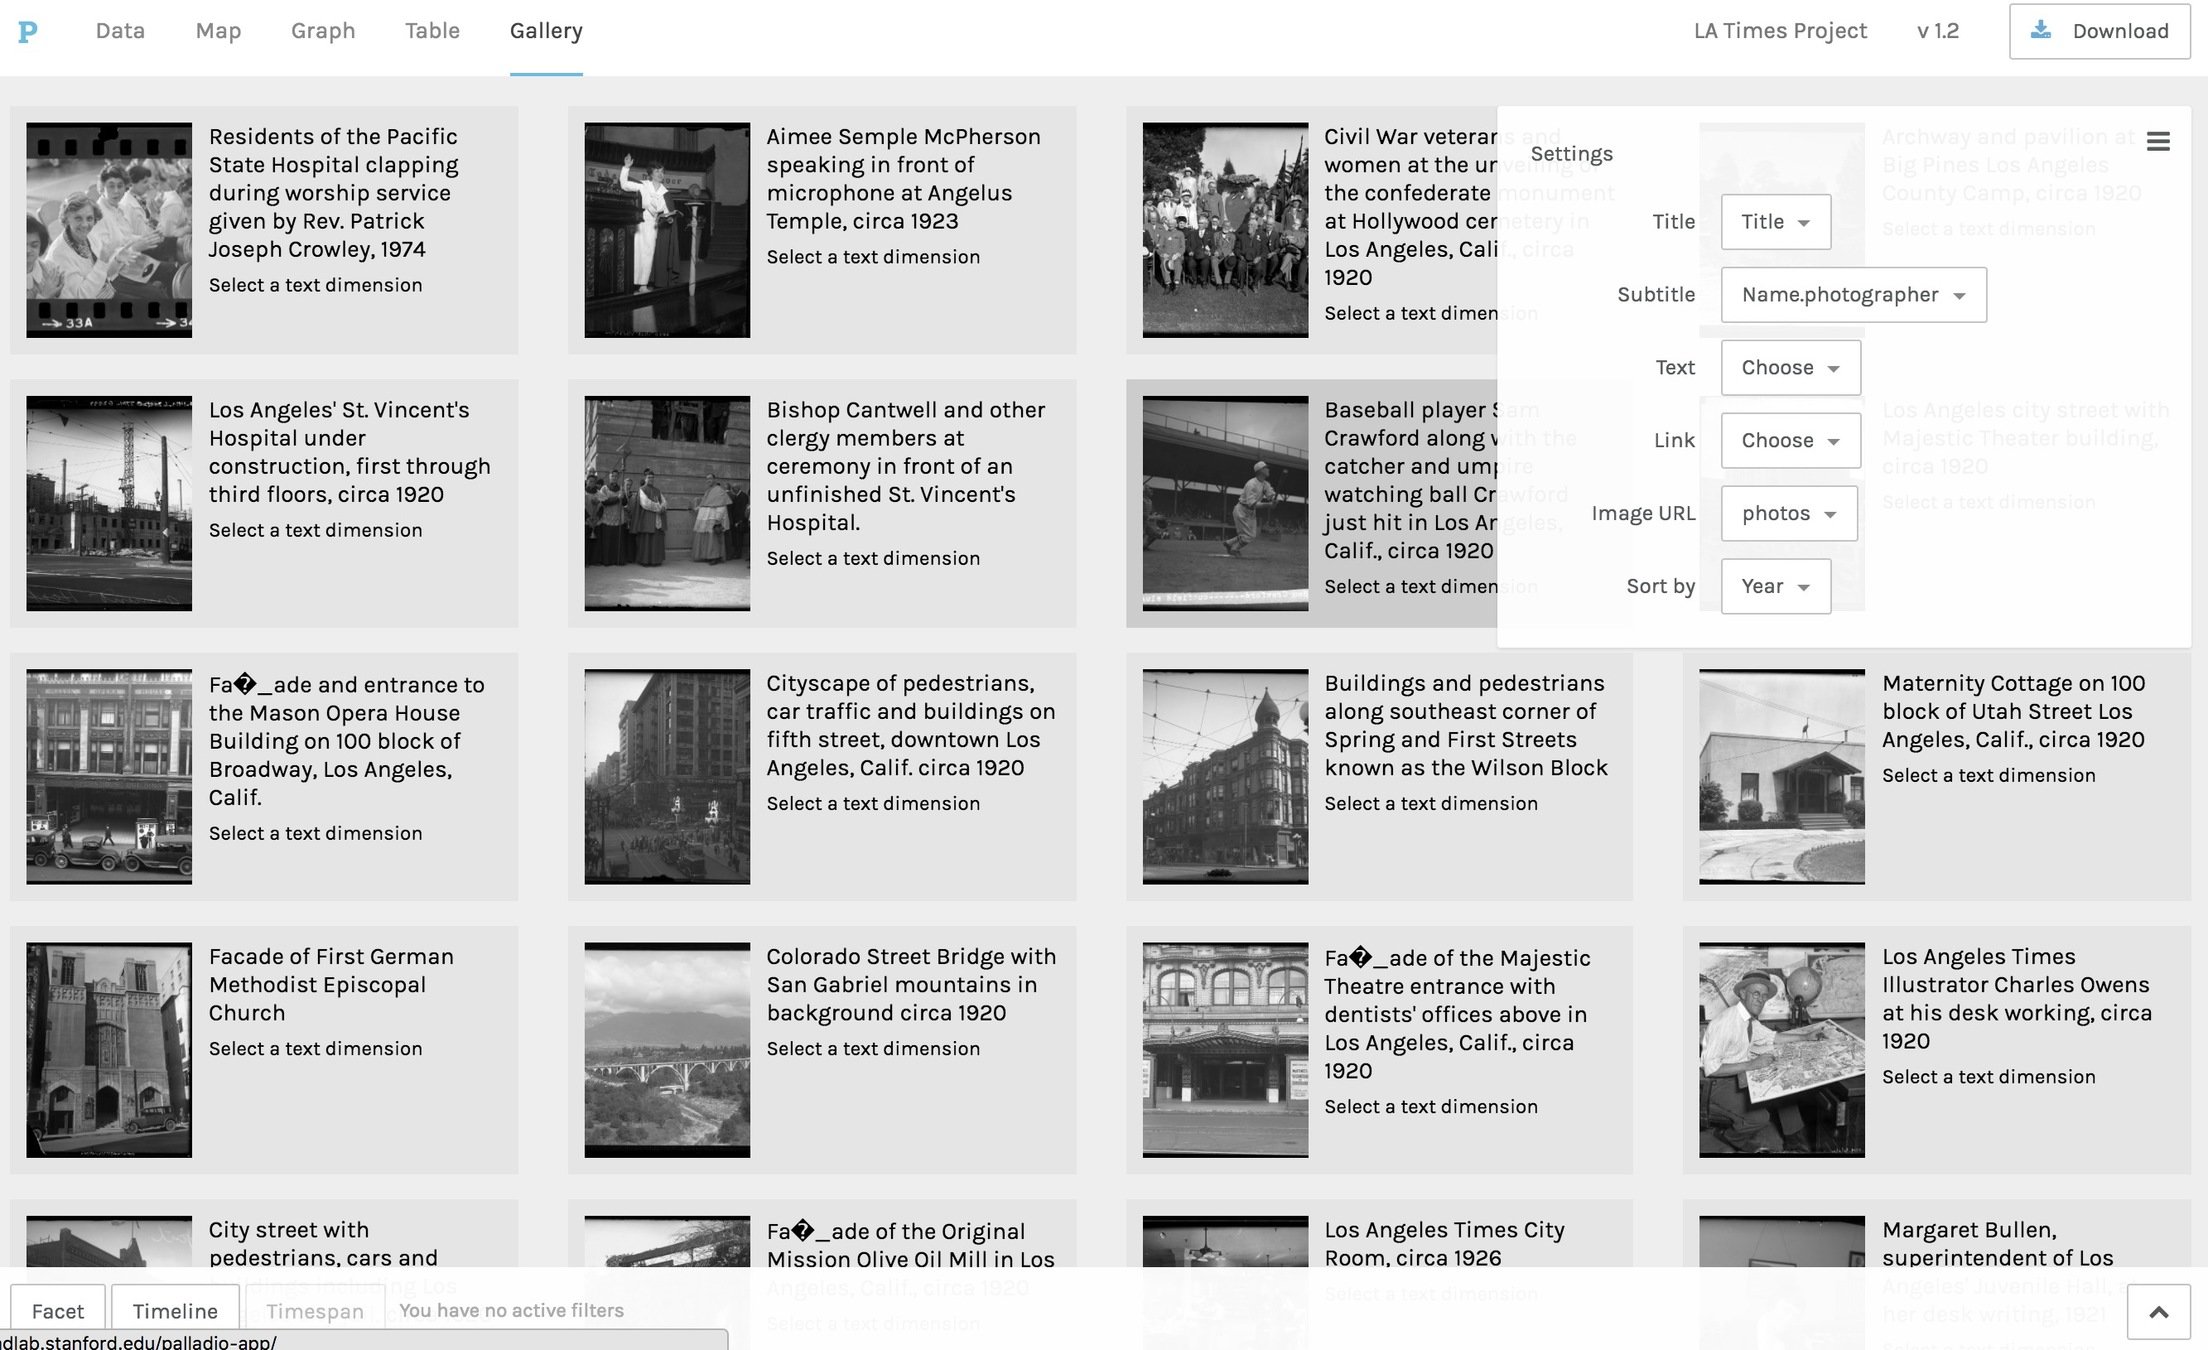
Text
Text
Text
Text
Text
You can download a project and work on it or use it later without having to re-input the facets, etc.
that is it for now. check out this excellent blog by UCLA Professor Miriam Posner with further tips and examples.
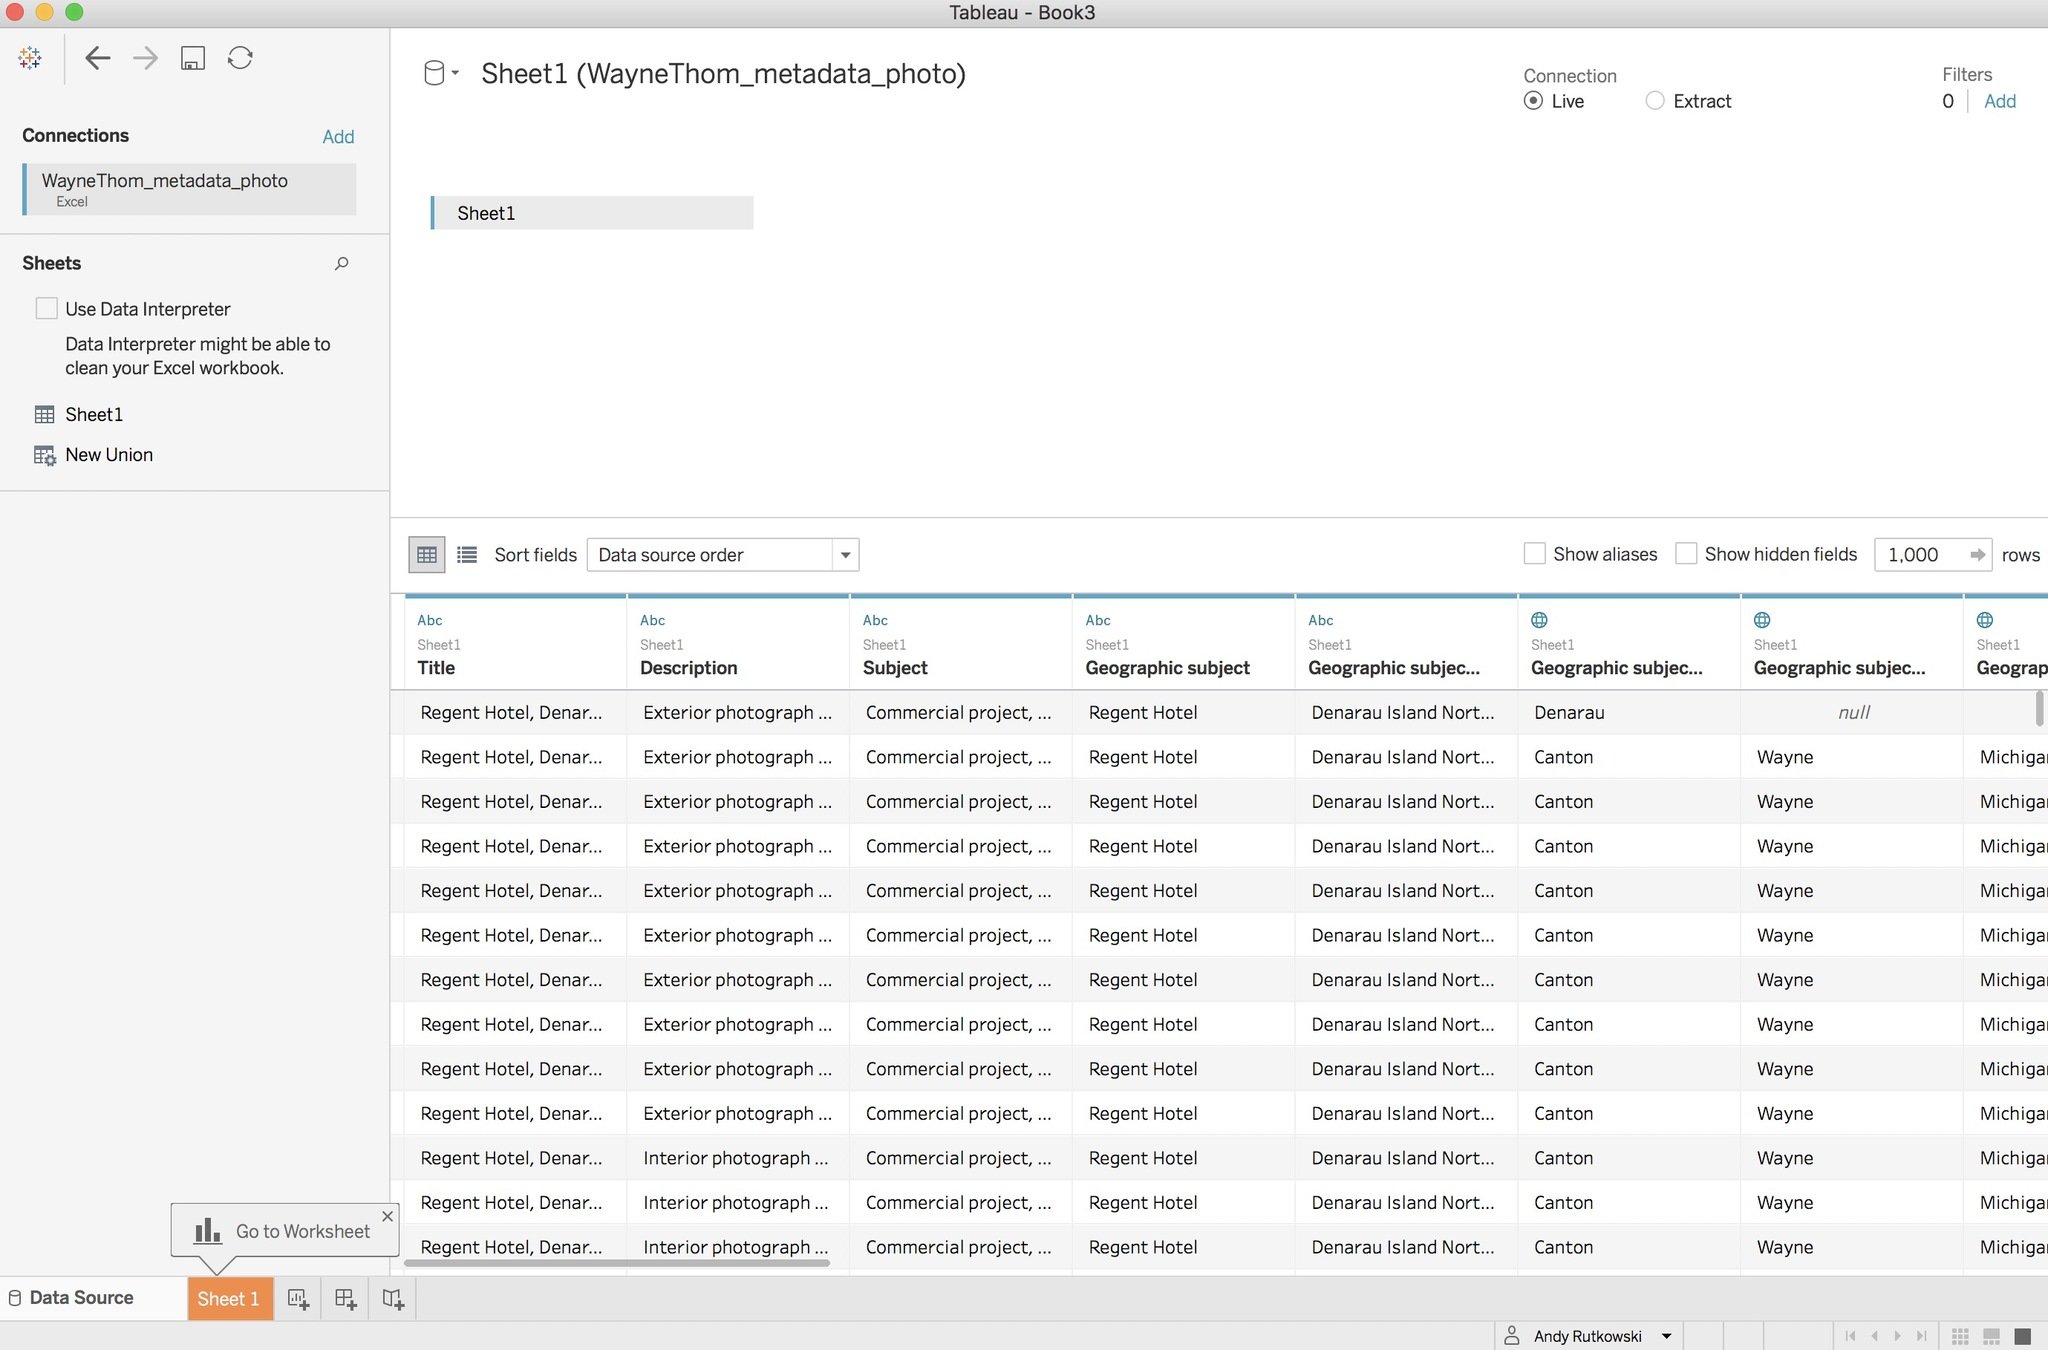
Connect WayneThom_metadata_photo.xlsx
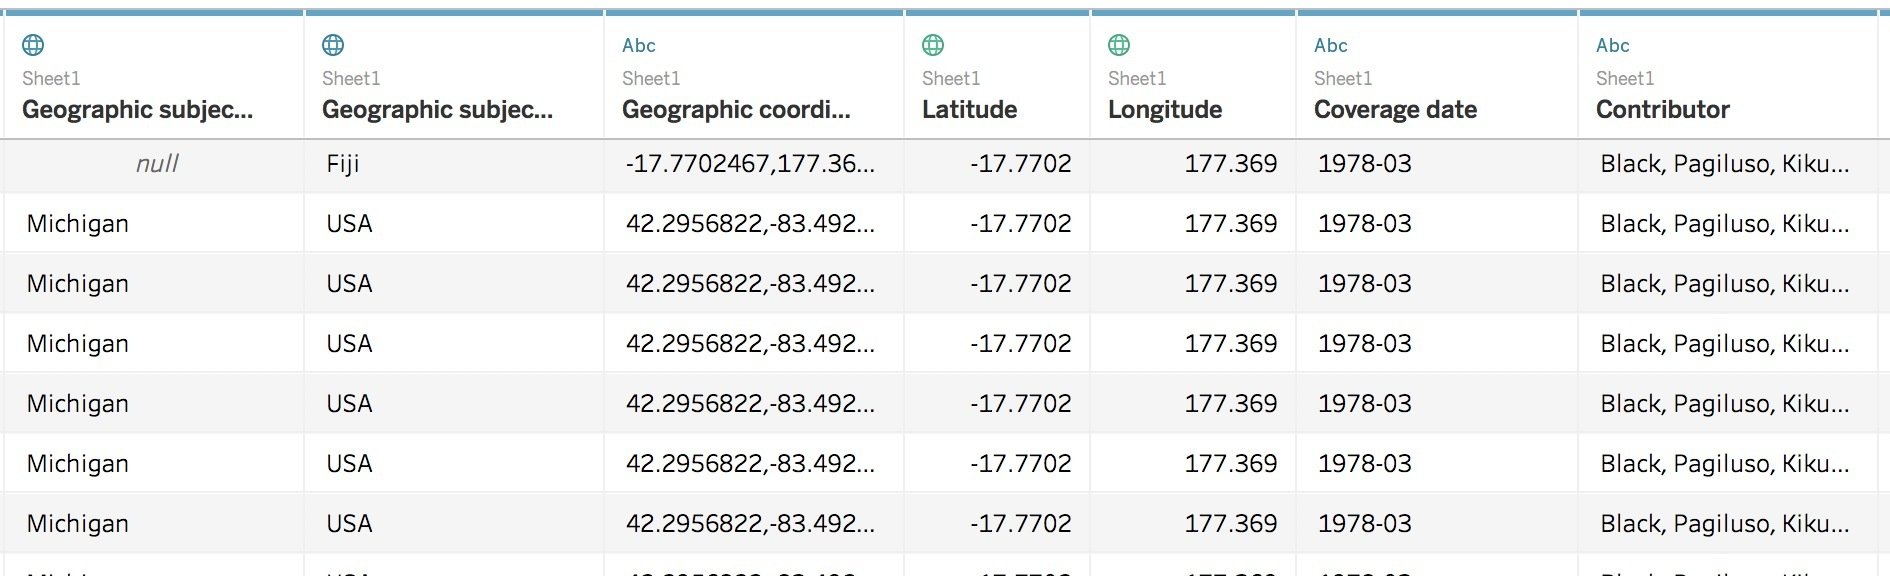
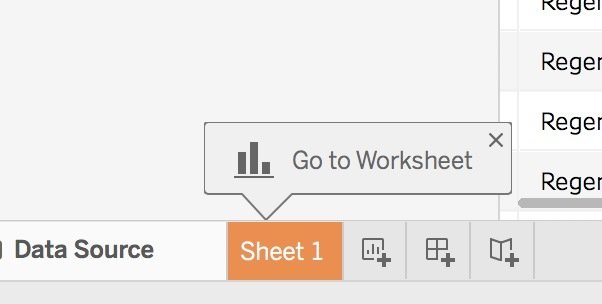
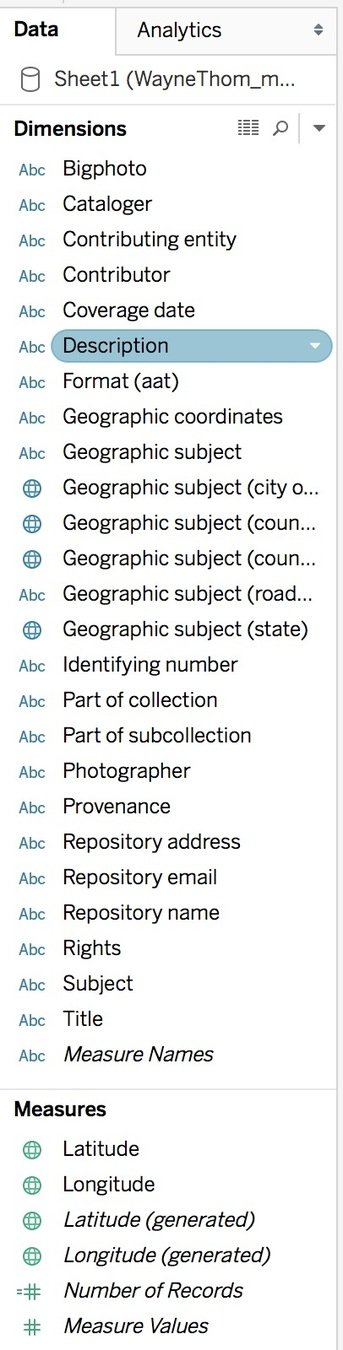
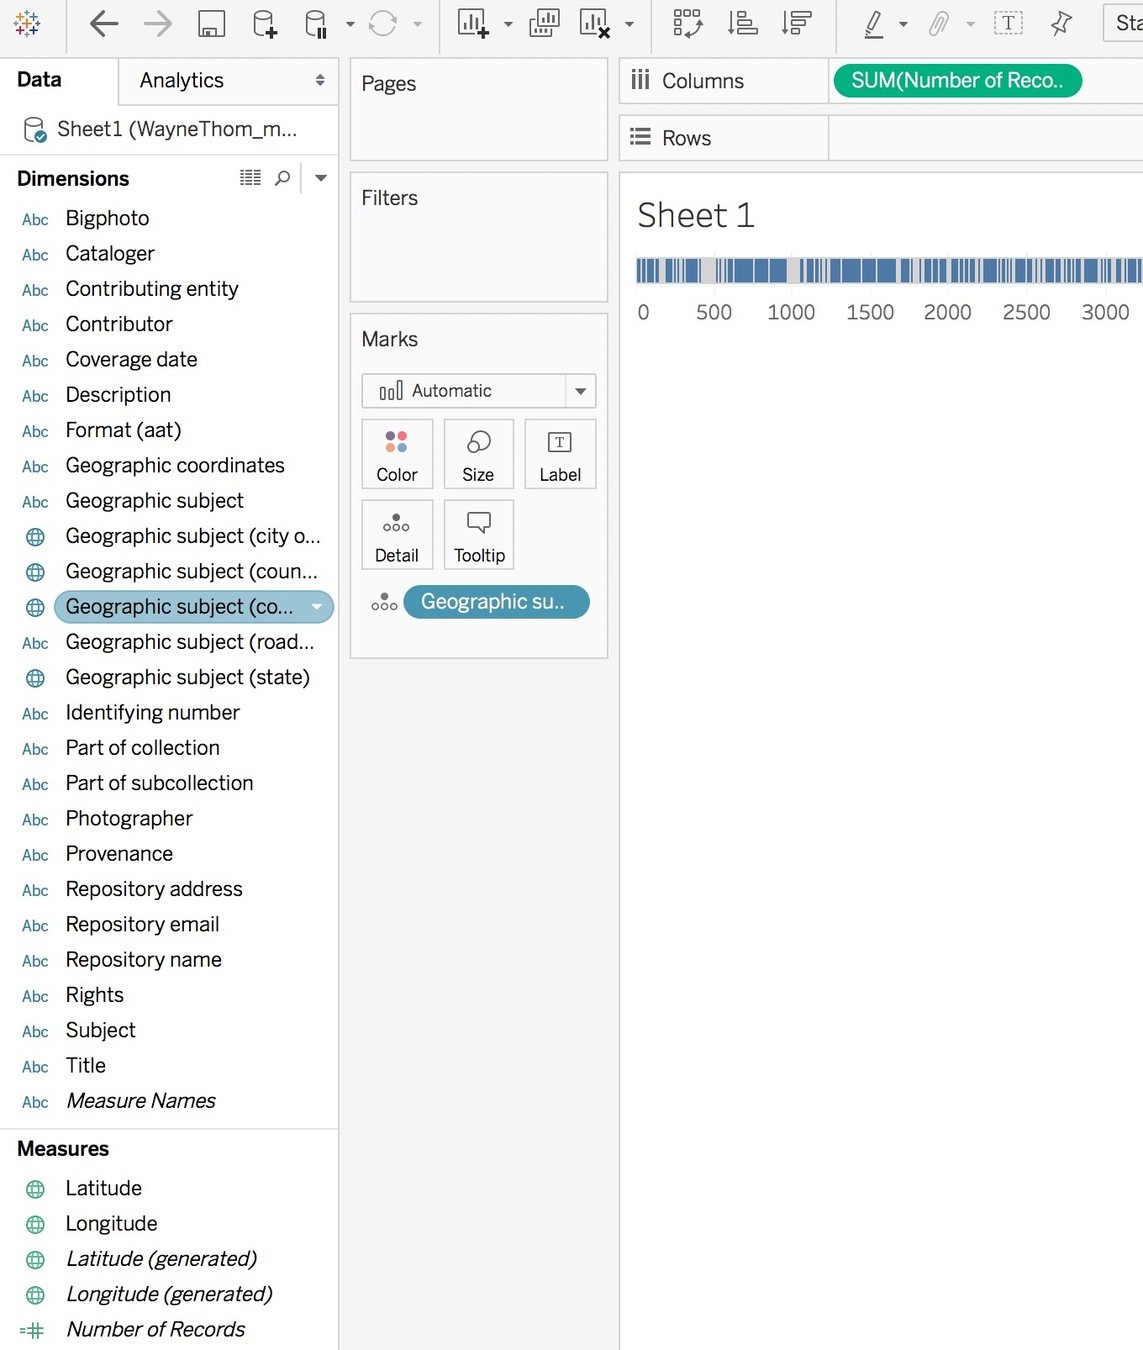
similar to Palladio. look at data and make sure data looks OK. when you are ready go to worksheet.
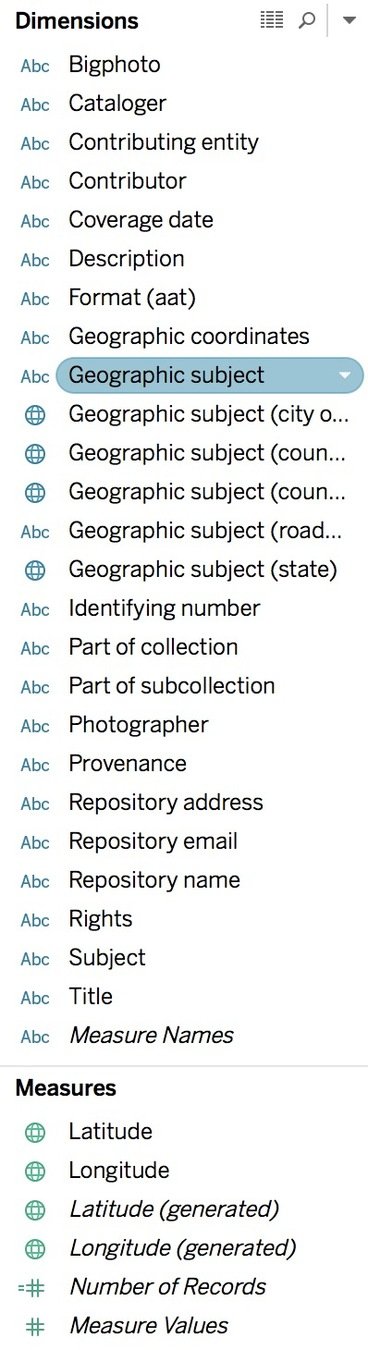
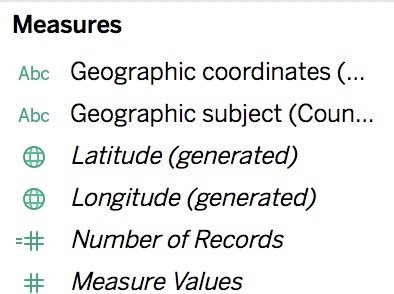
tableau has dimensions and measures that help you create a variety of different visualizations
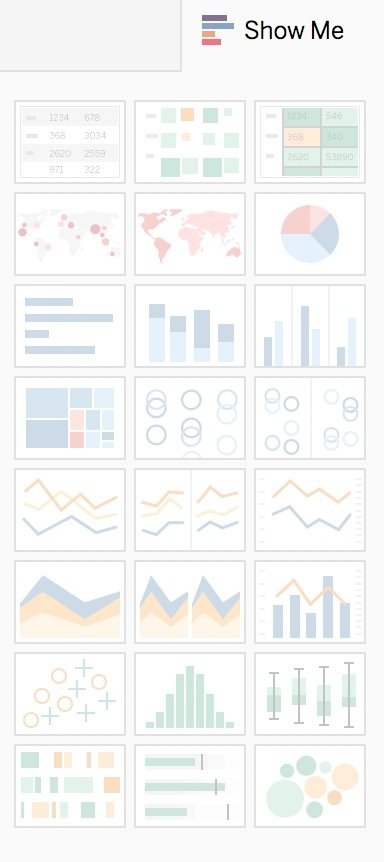
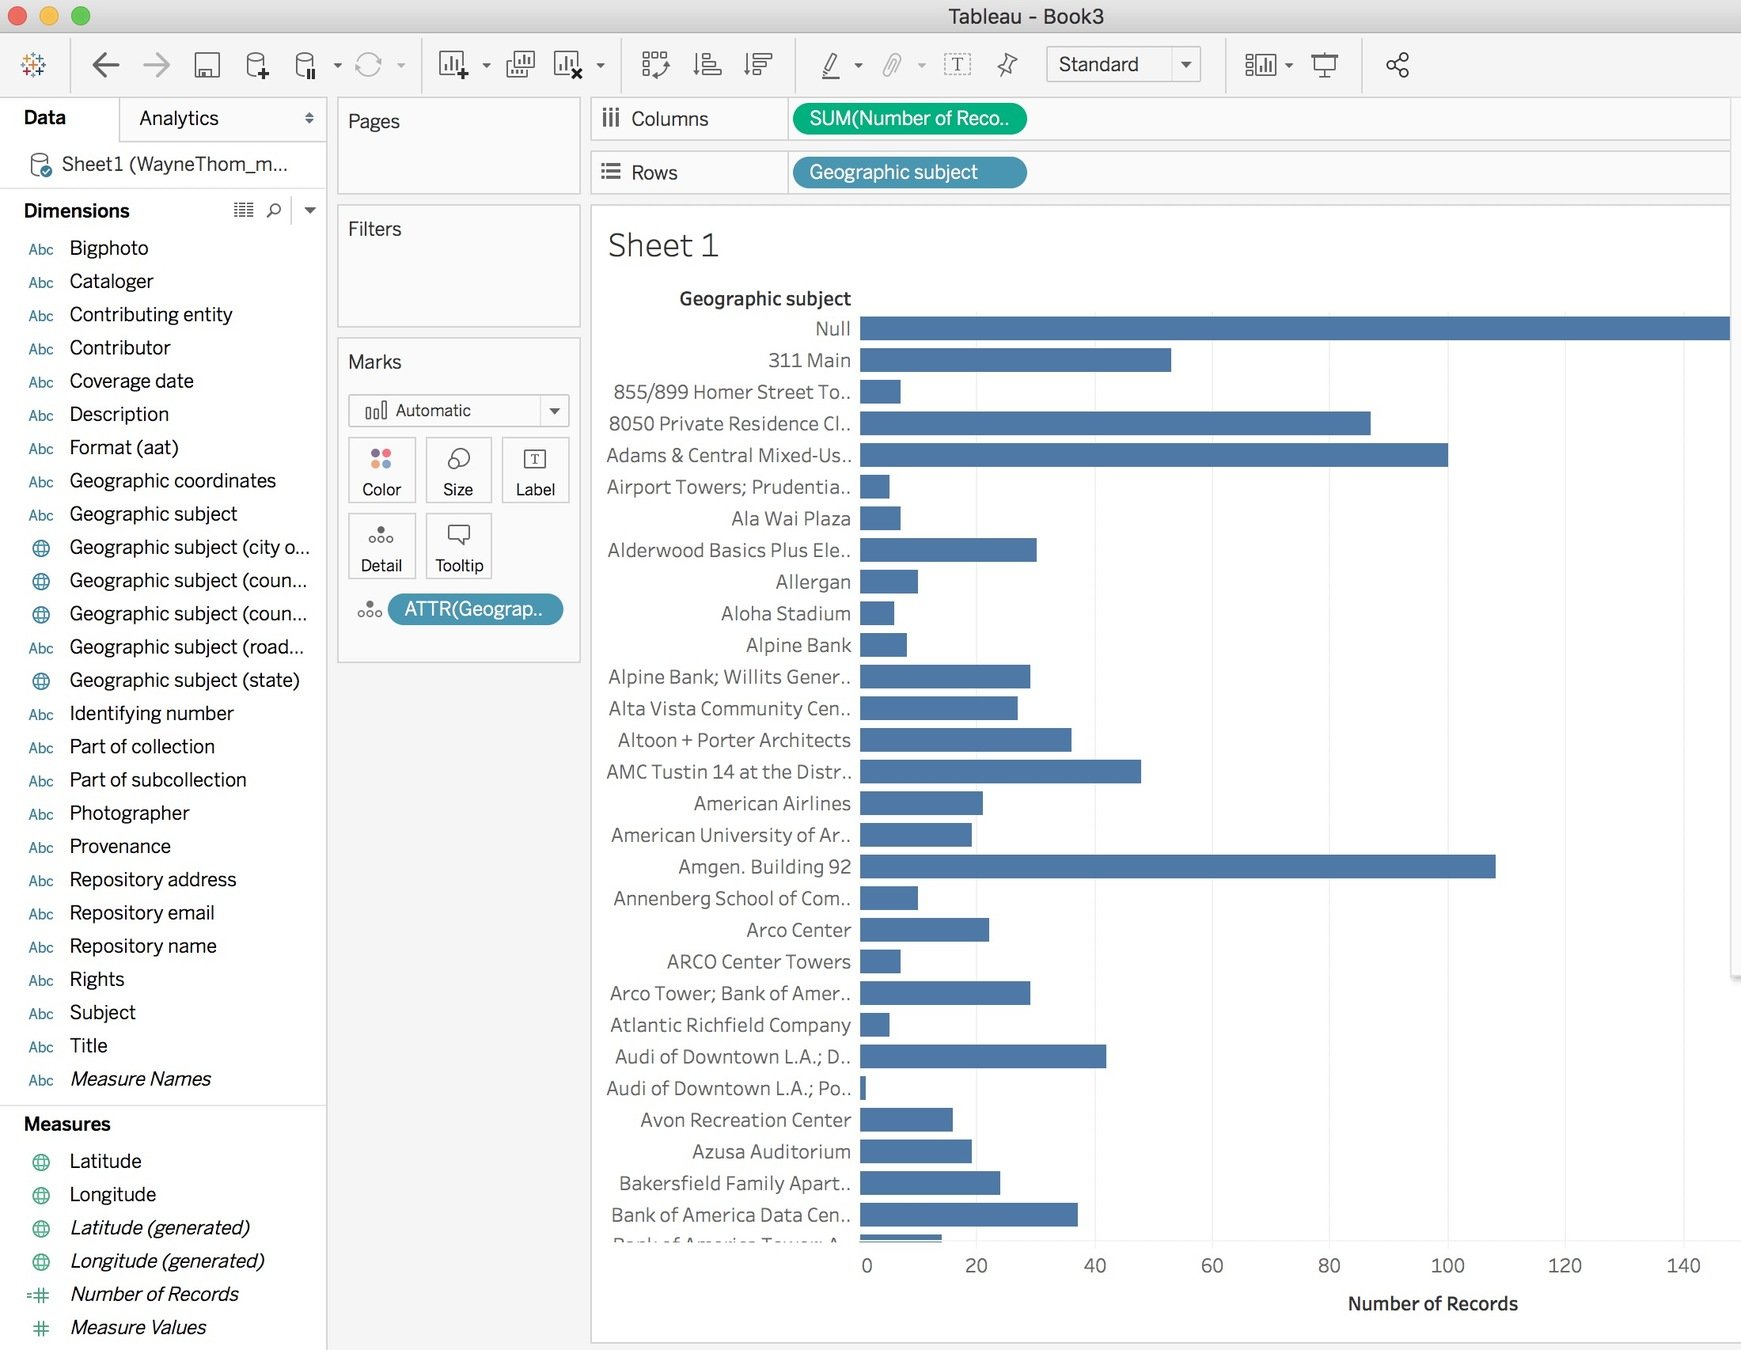
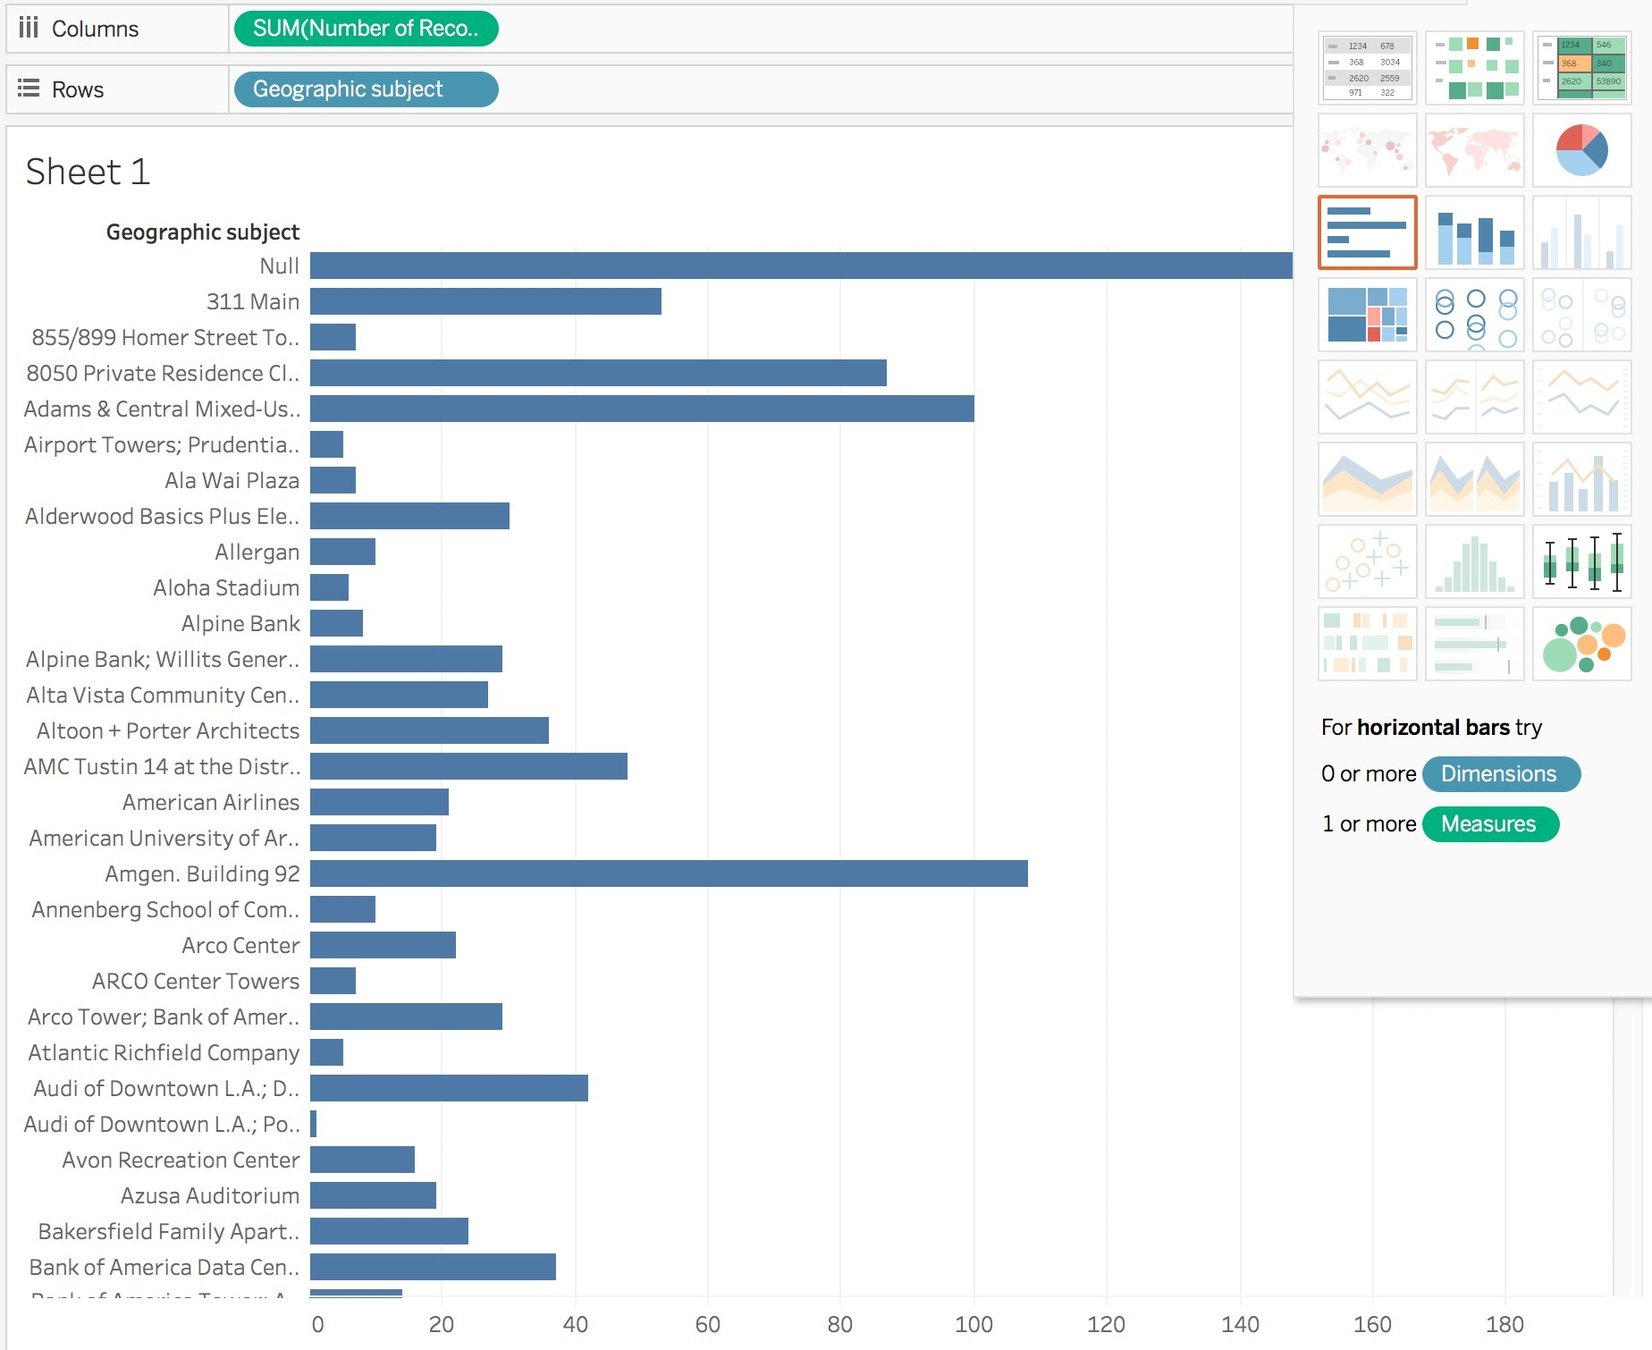
1. take the geographic subject and drag to the marks section.
2. take number of records from the measures and move to the Columns
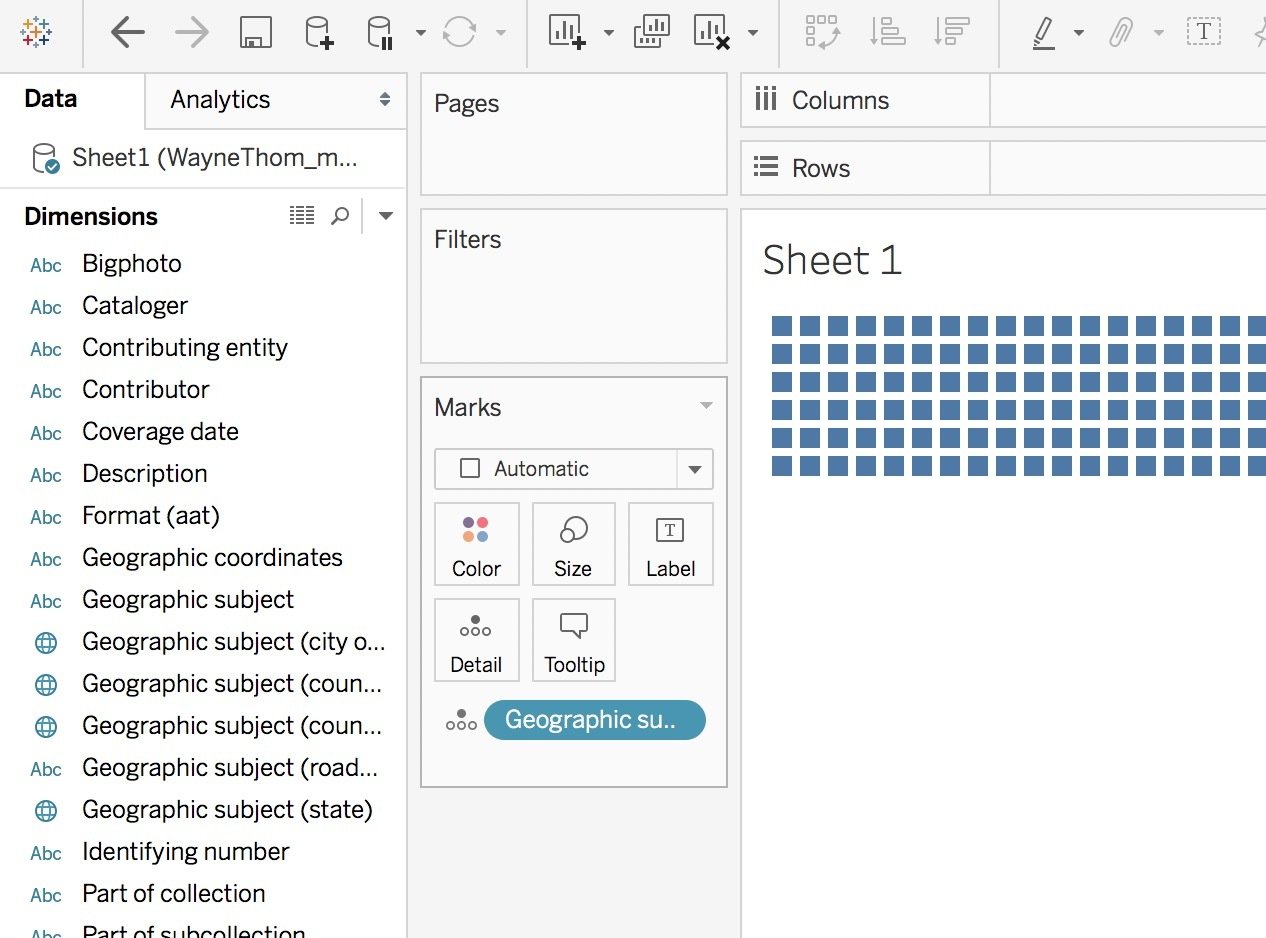
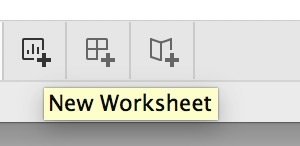
Lets make another sheet
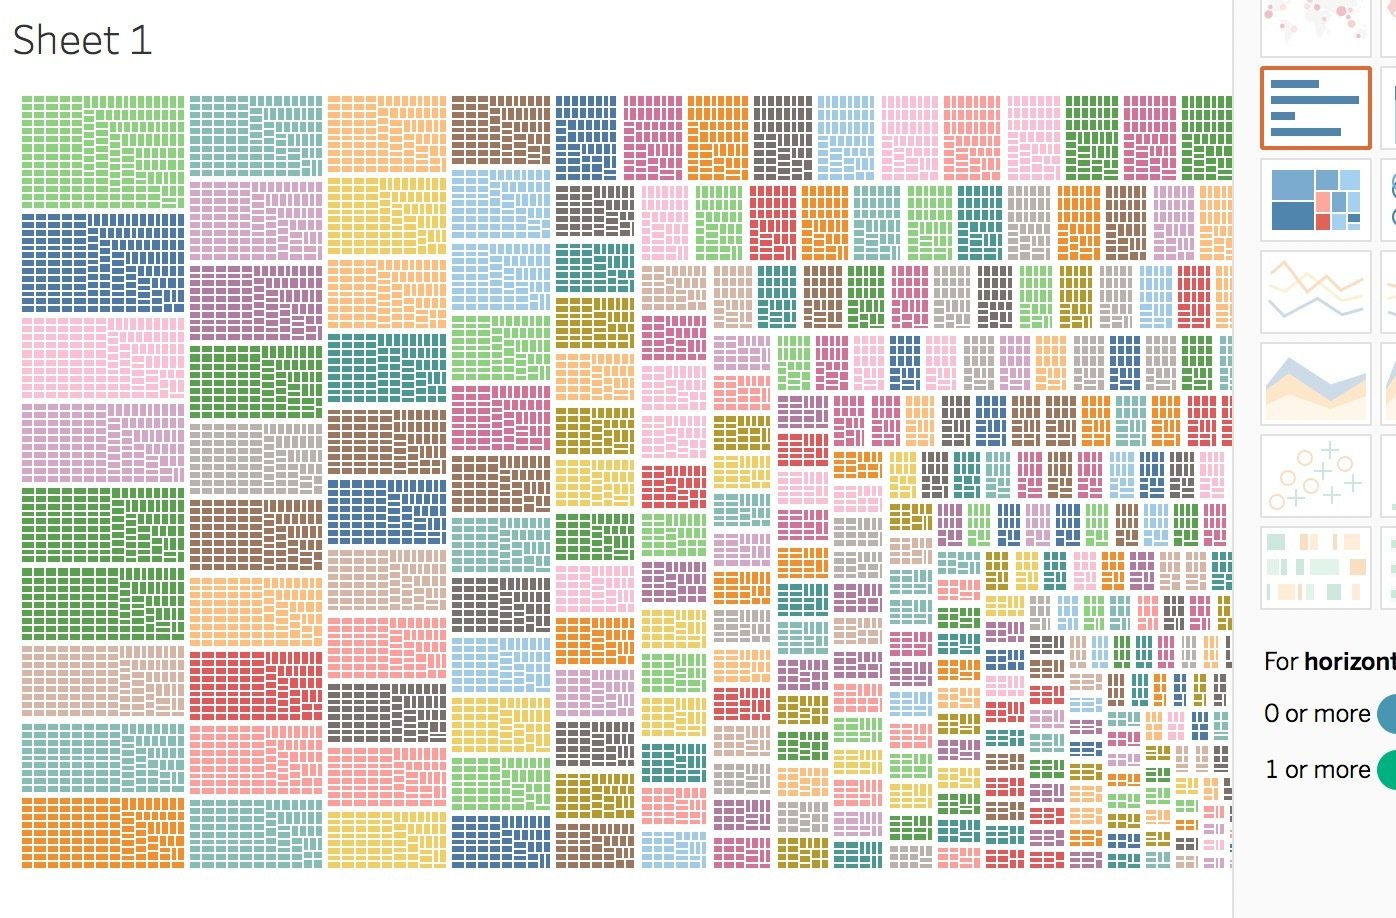
This time lets see every single record visually
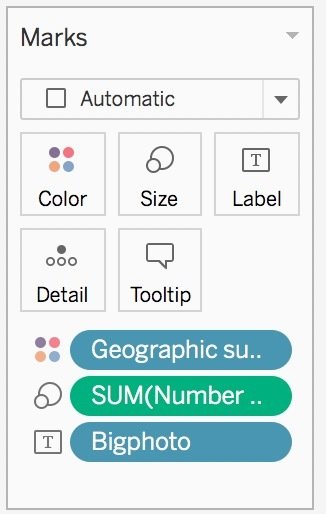
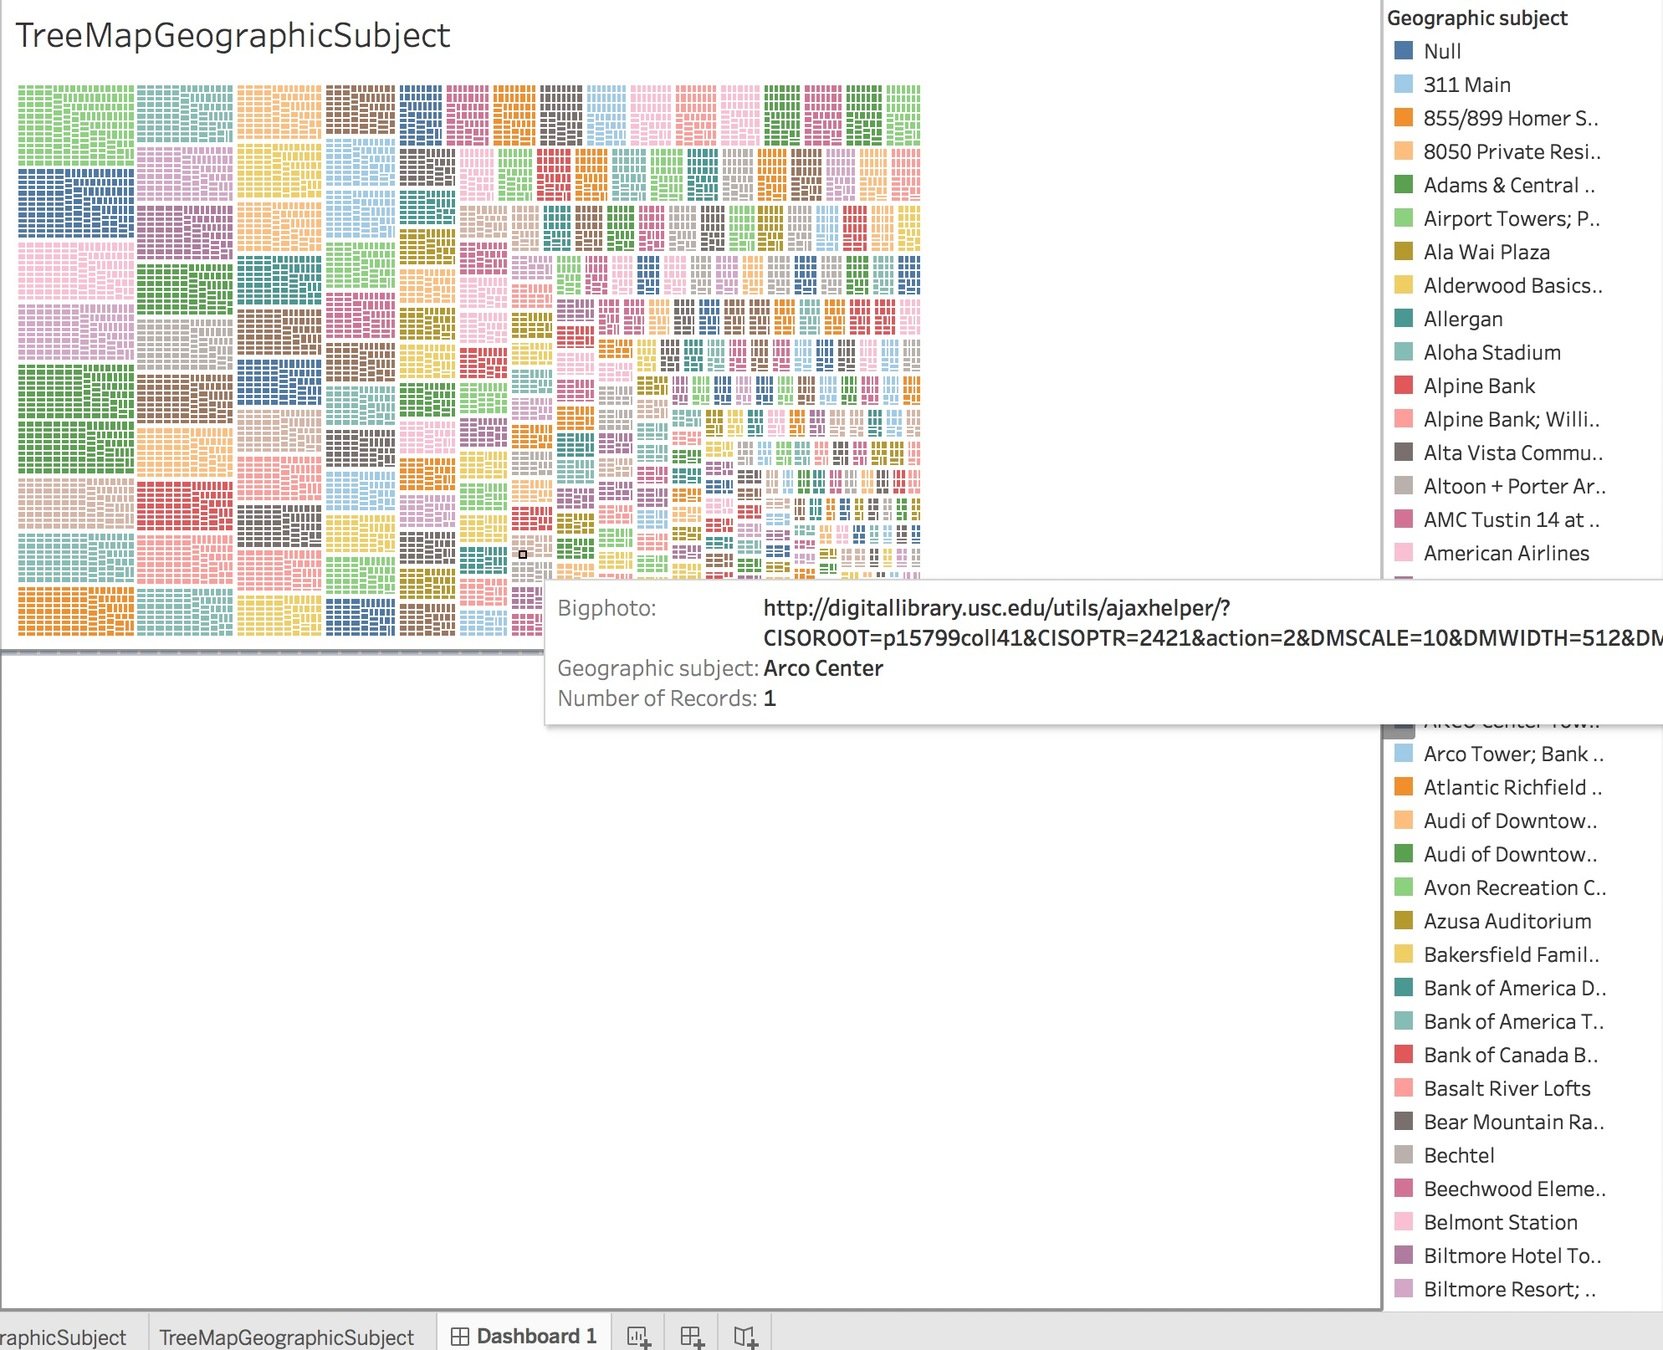
Add geographic subject, number of records, and Bigphoto to the marks section
Then click and drag each one to the corresponding symbols - color, size, and text.
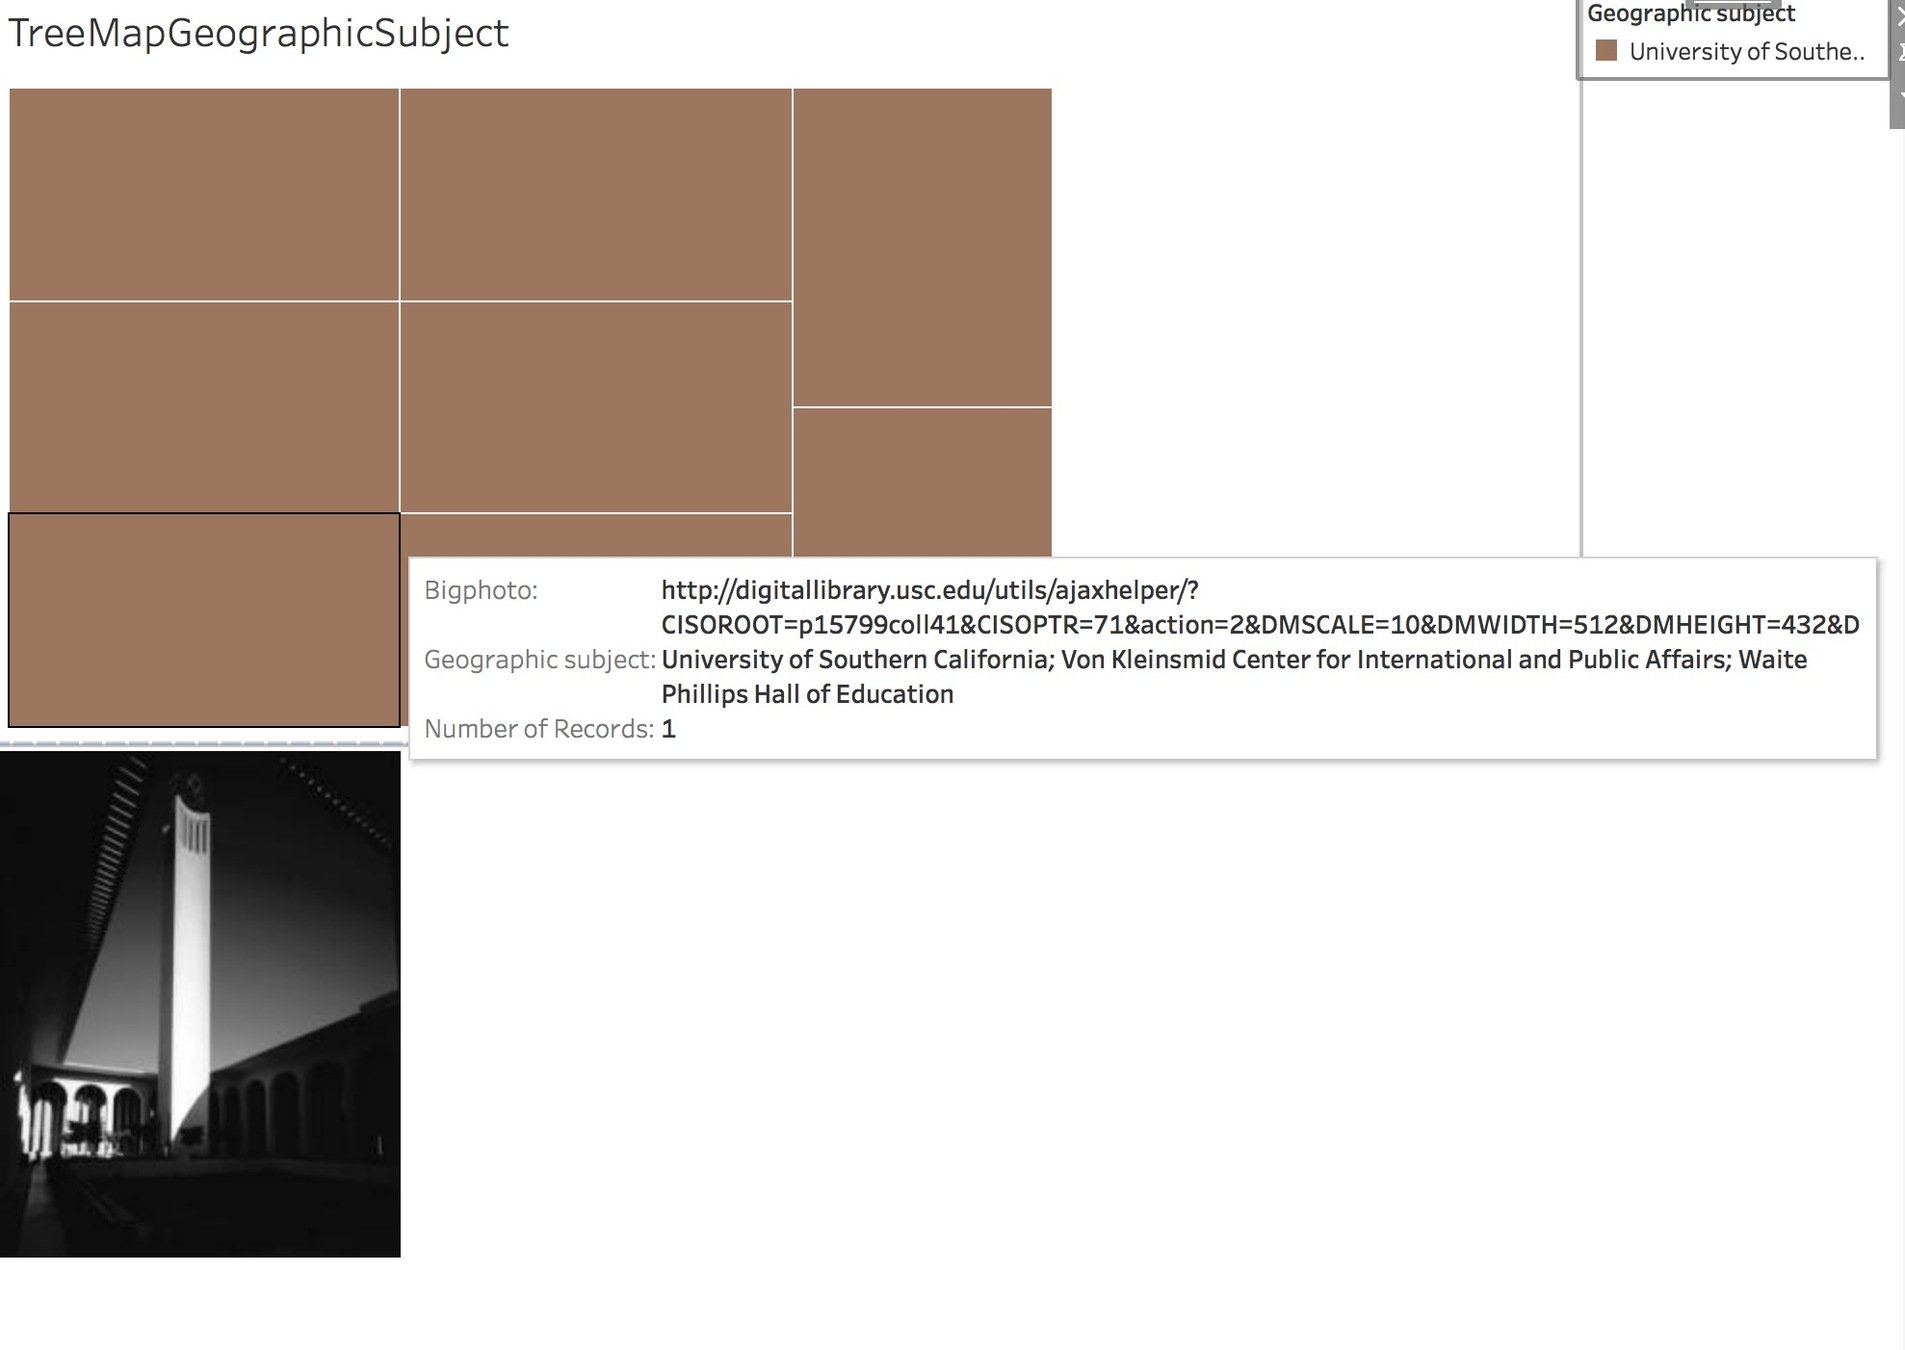
Now lets create an image viewer so we can quickly browse through every photo by geographic subject. click and create a new dashboard.
Then click and drag the TreeMap sheet to the work area
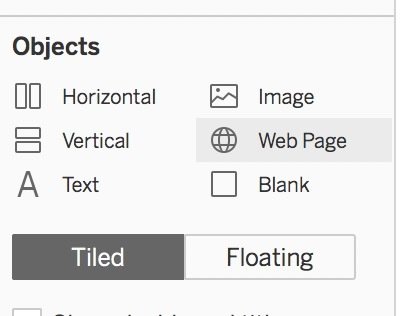
Now click and drag over "web page" into the same work space and click OK.
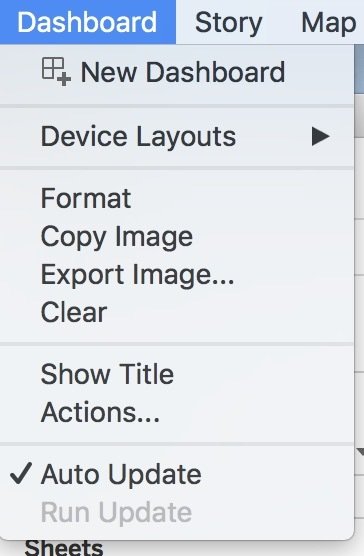
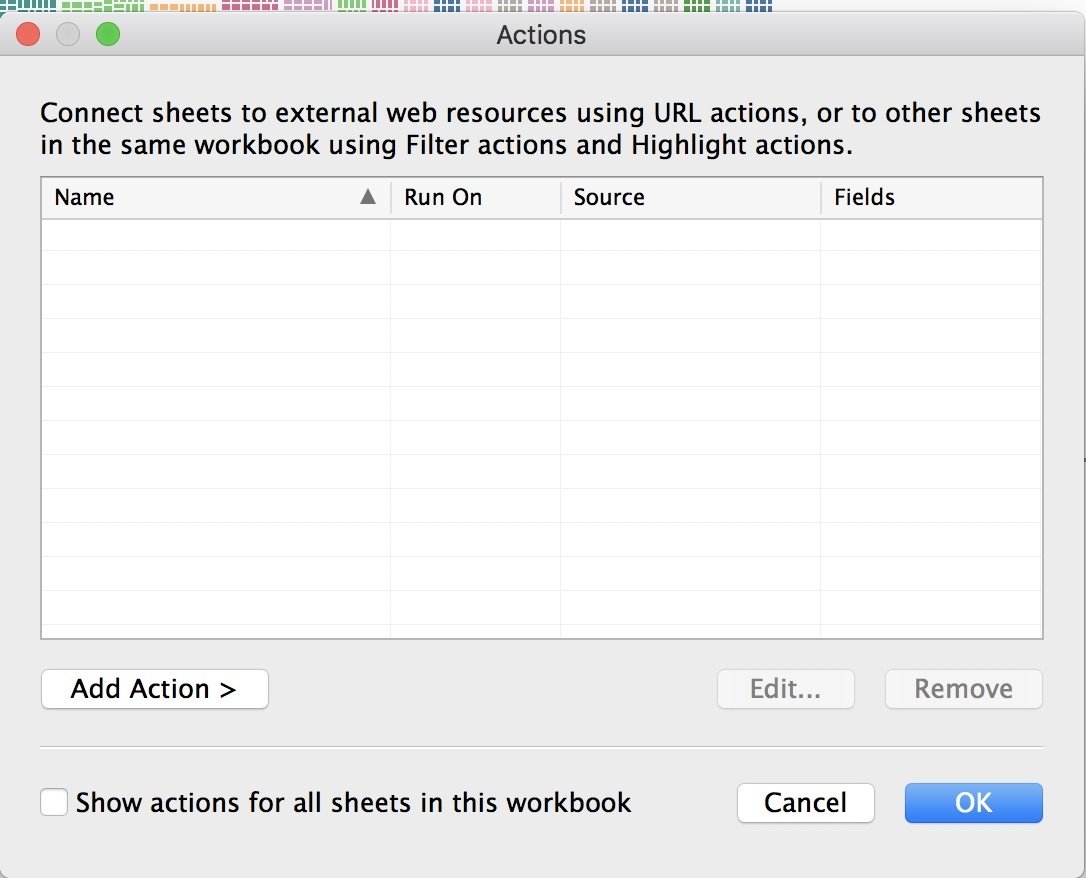
go to the Dashboard tab and select Action
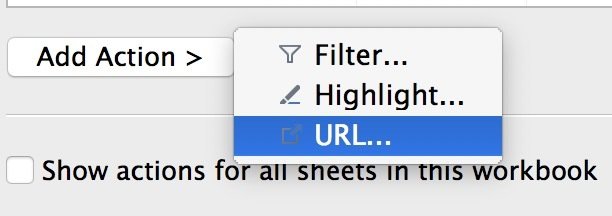
click on Add Action and add URL
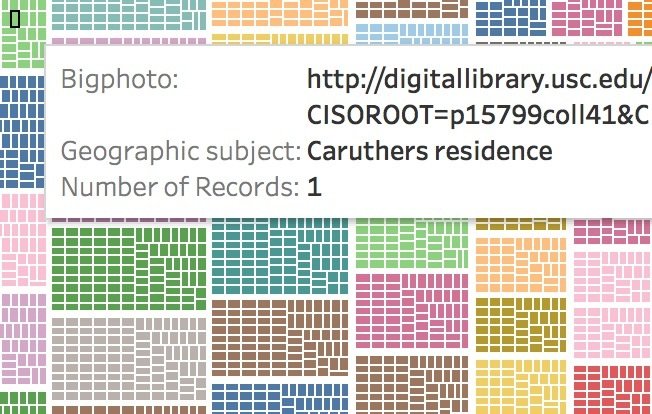
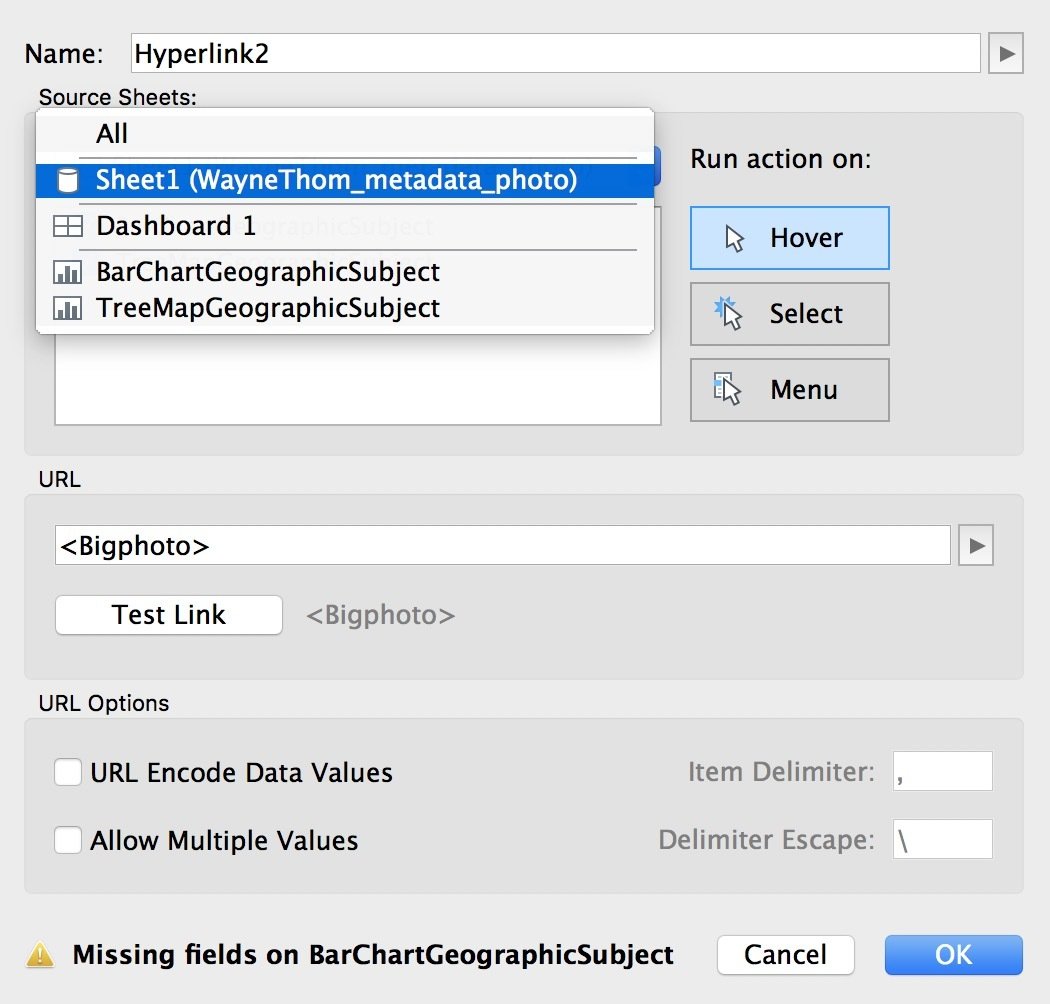
Now we will build an action so that an image will appear using the url link that we have in the metadata.
Select Sheet1. Run action on Hover. Select BigPhoto from URL arrow menu and then click OK.
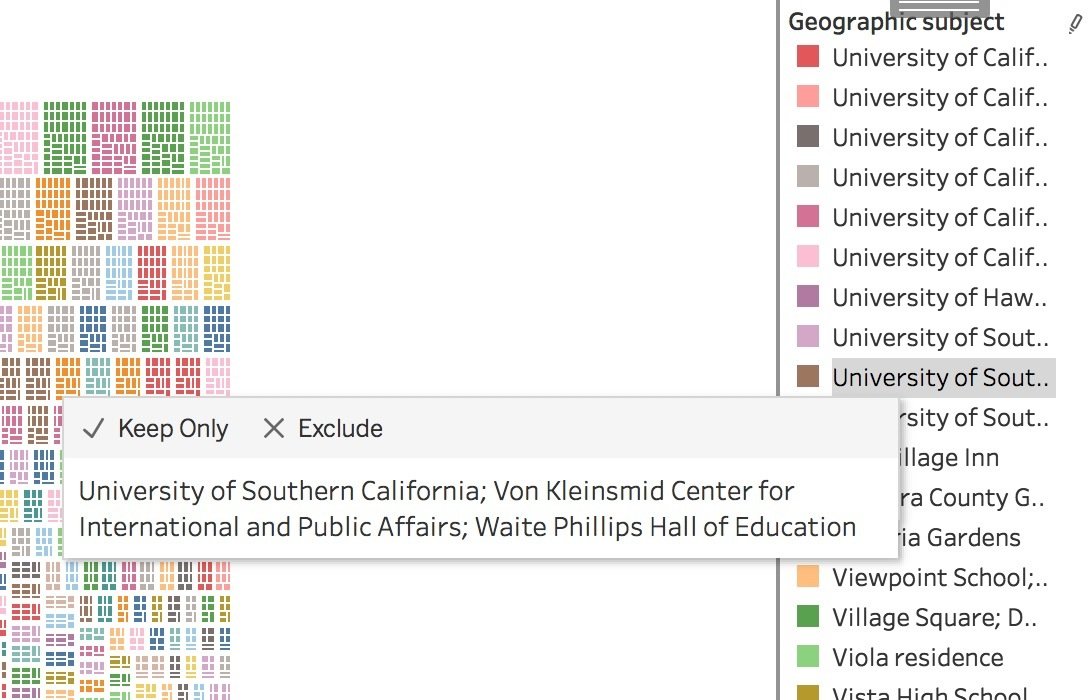
every single photo and record grouped by geographic subject
Lets just pick one subset. University of Southern California VKC . . .
Lets do a final new worksheet
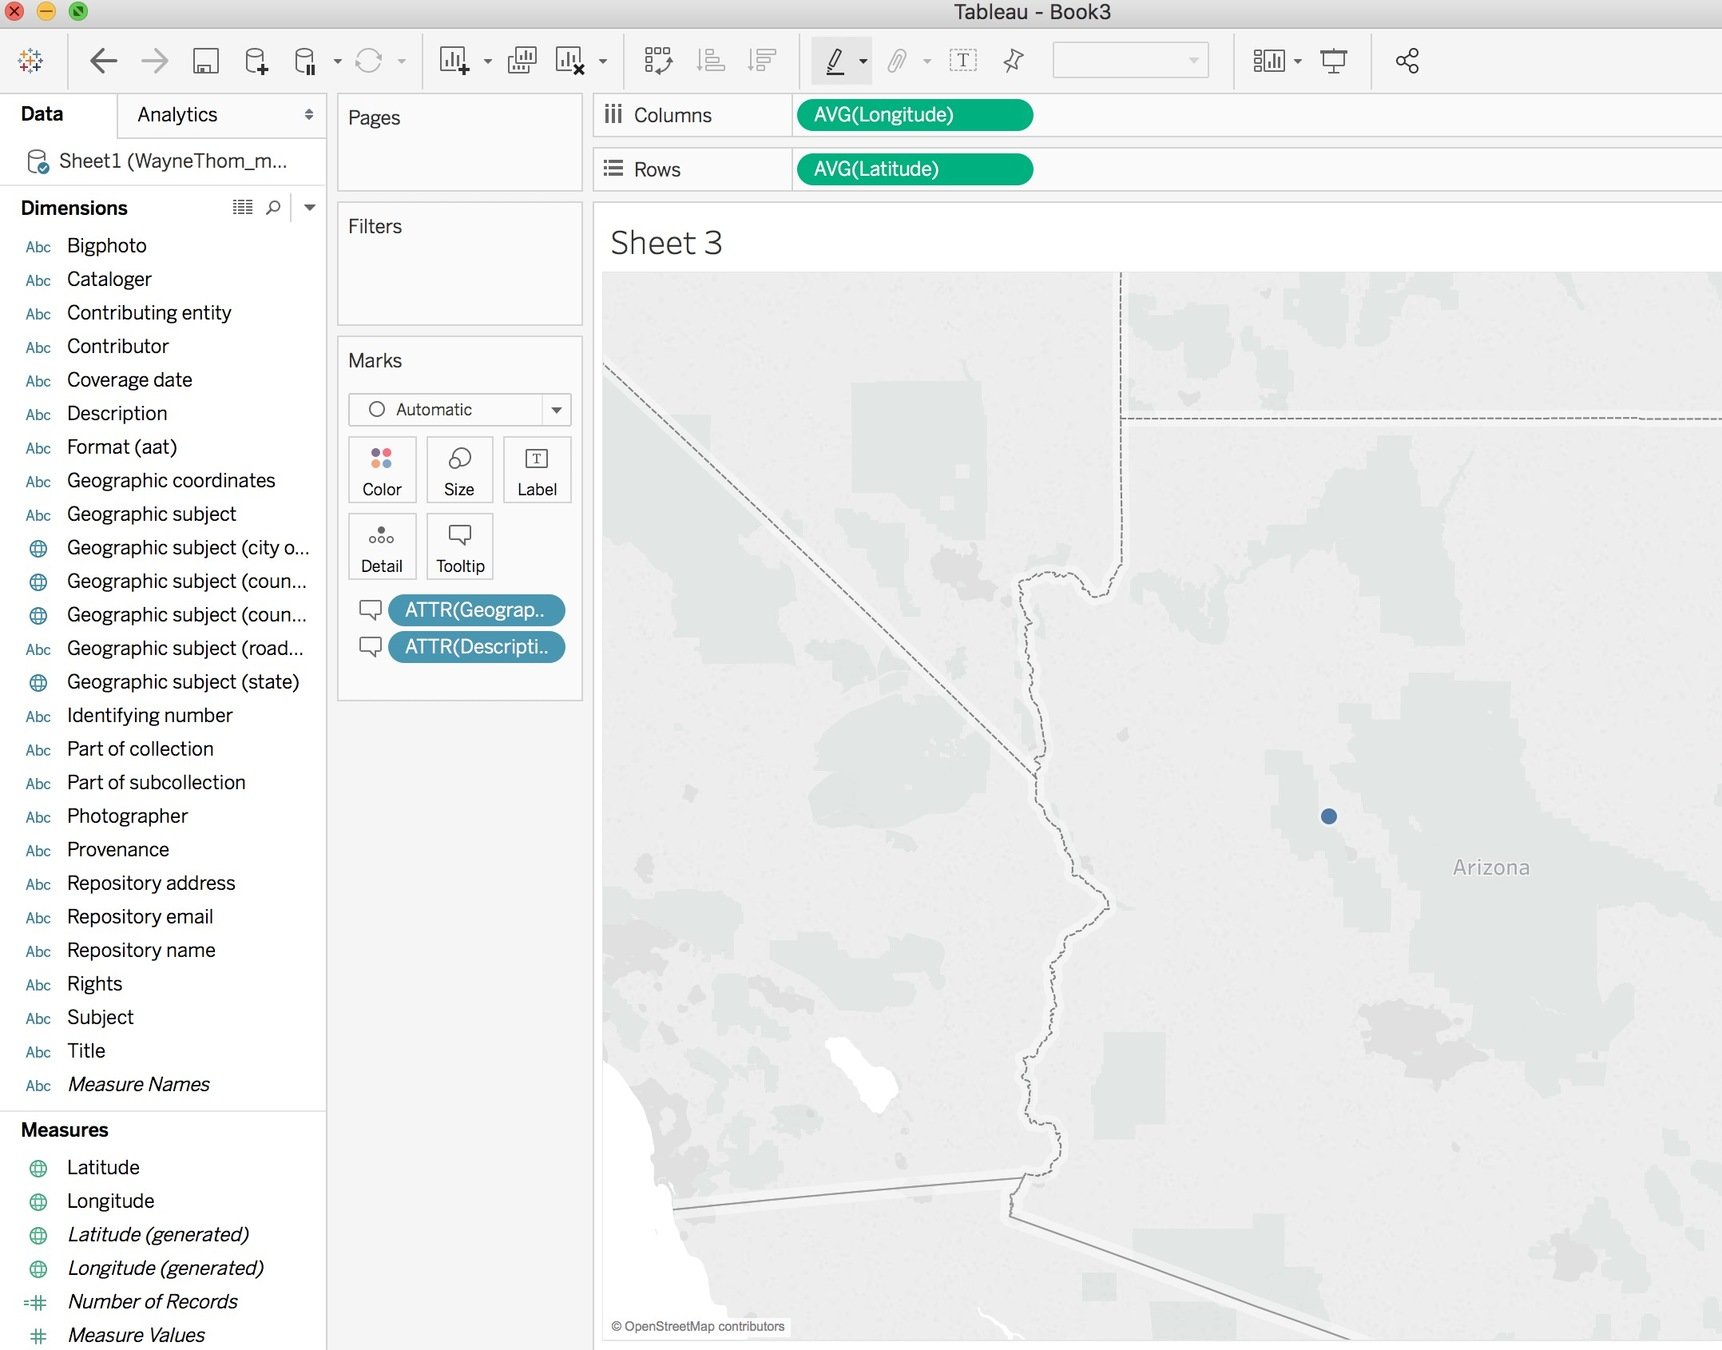
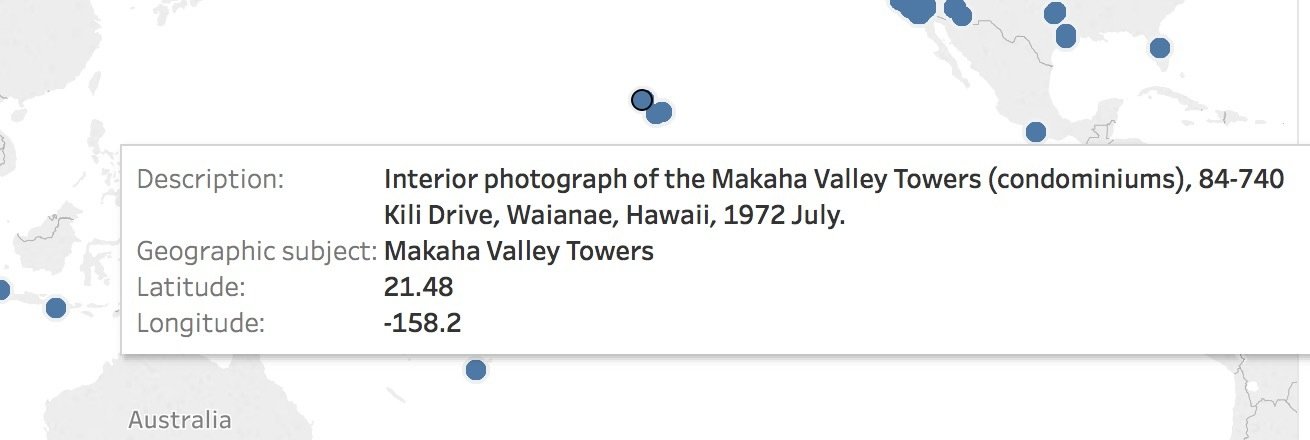
Add geographic subject and description to the marks section and then Longitude and Latitude to the columns and rows
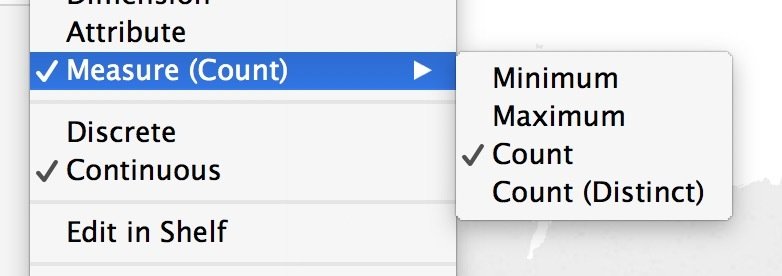
then double-click on measure values which should add up the points
we will also need to count measures
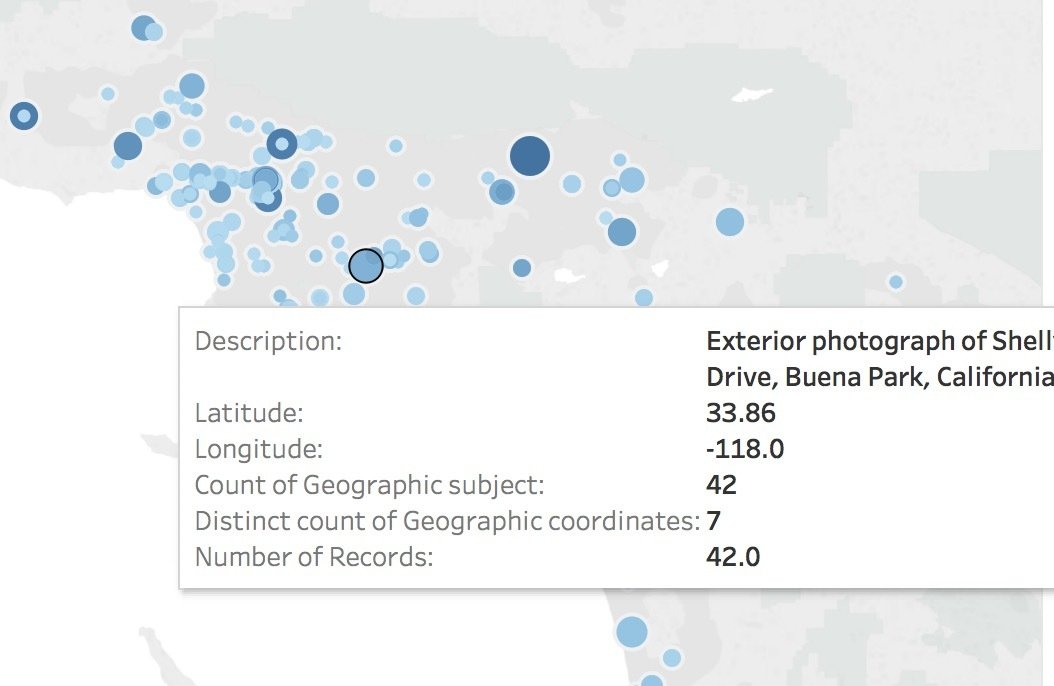
map should now look like something like this...with counts adding up to the total number of records for a subject
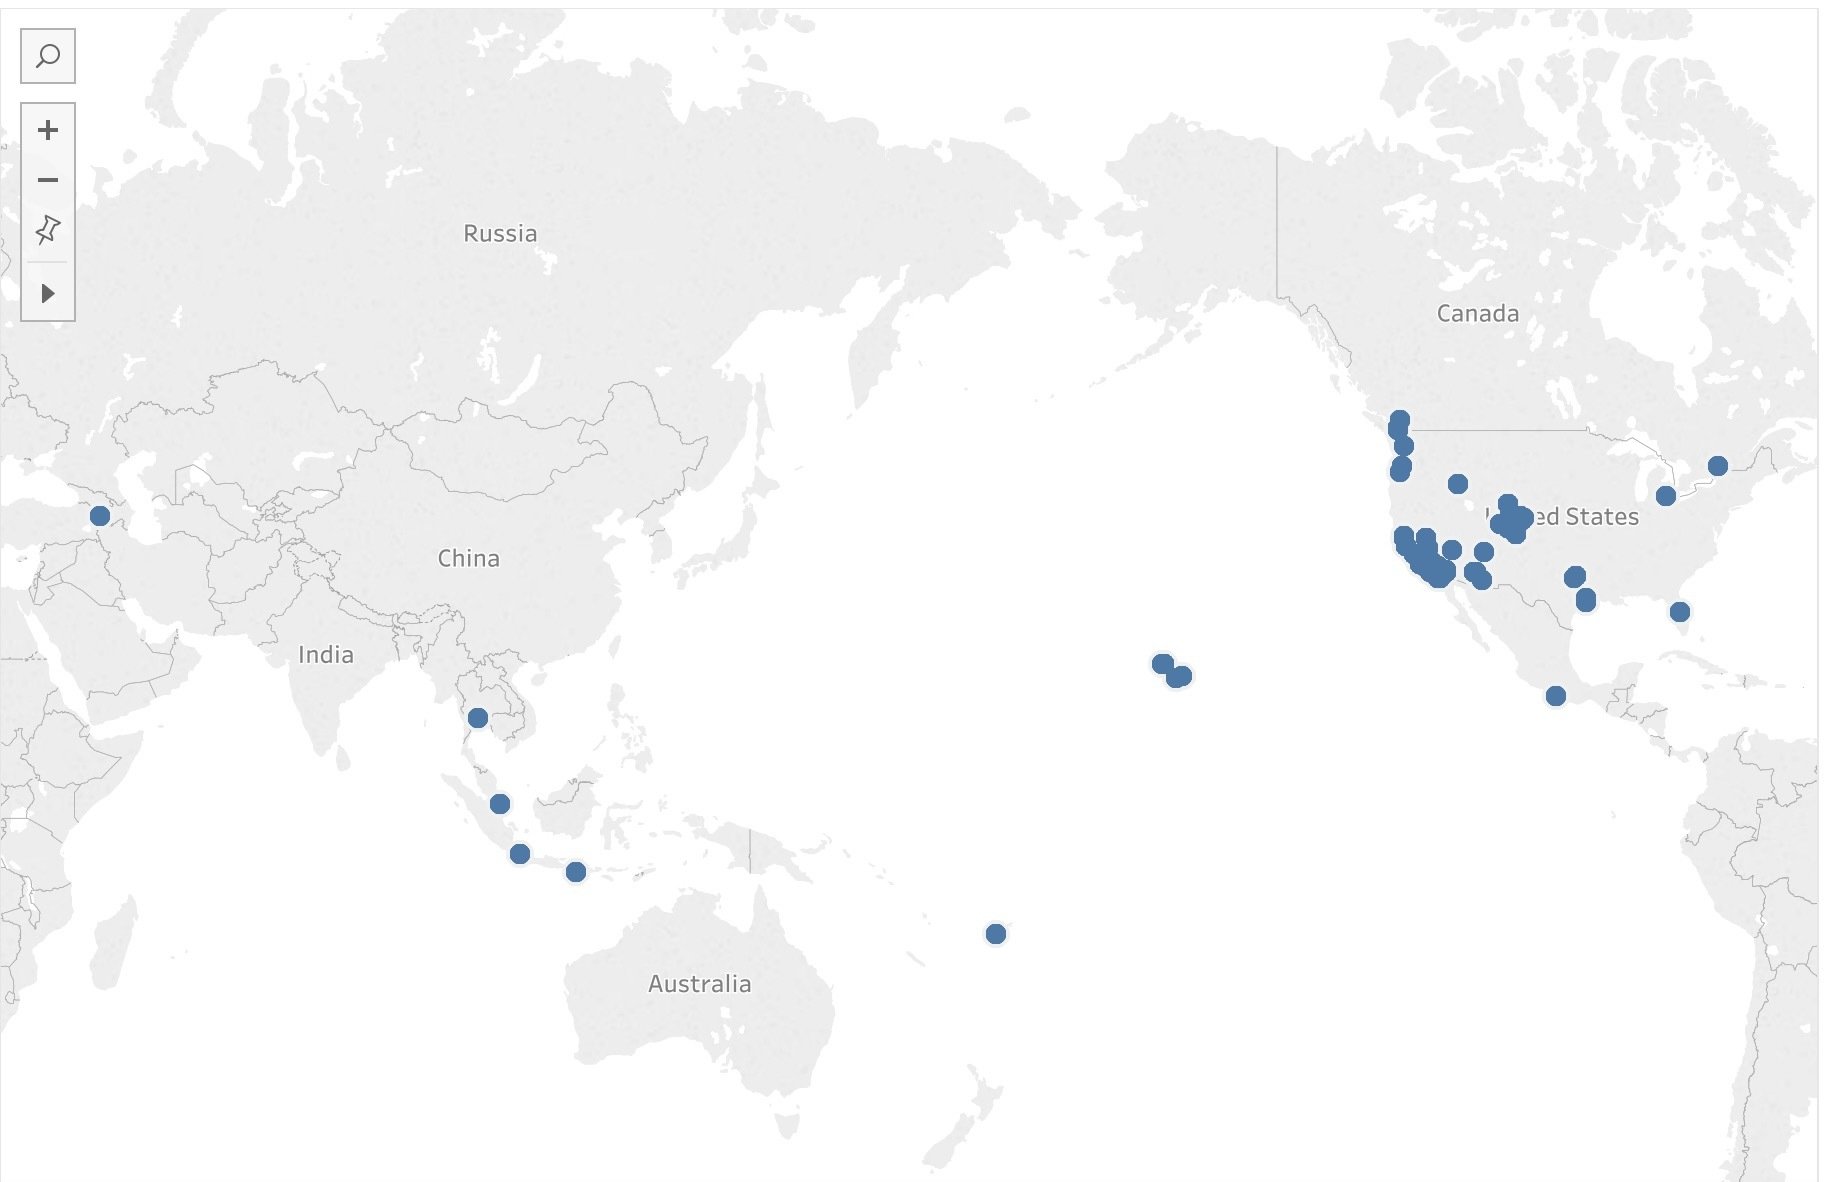
Go to analysis and check off aggregate measures. Once you do you should get points all over the map, rather then the one point which was the sum average of all the records.
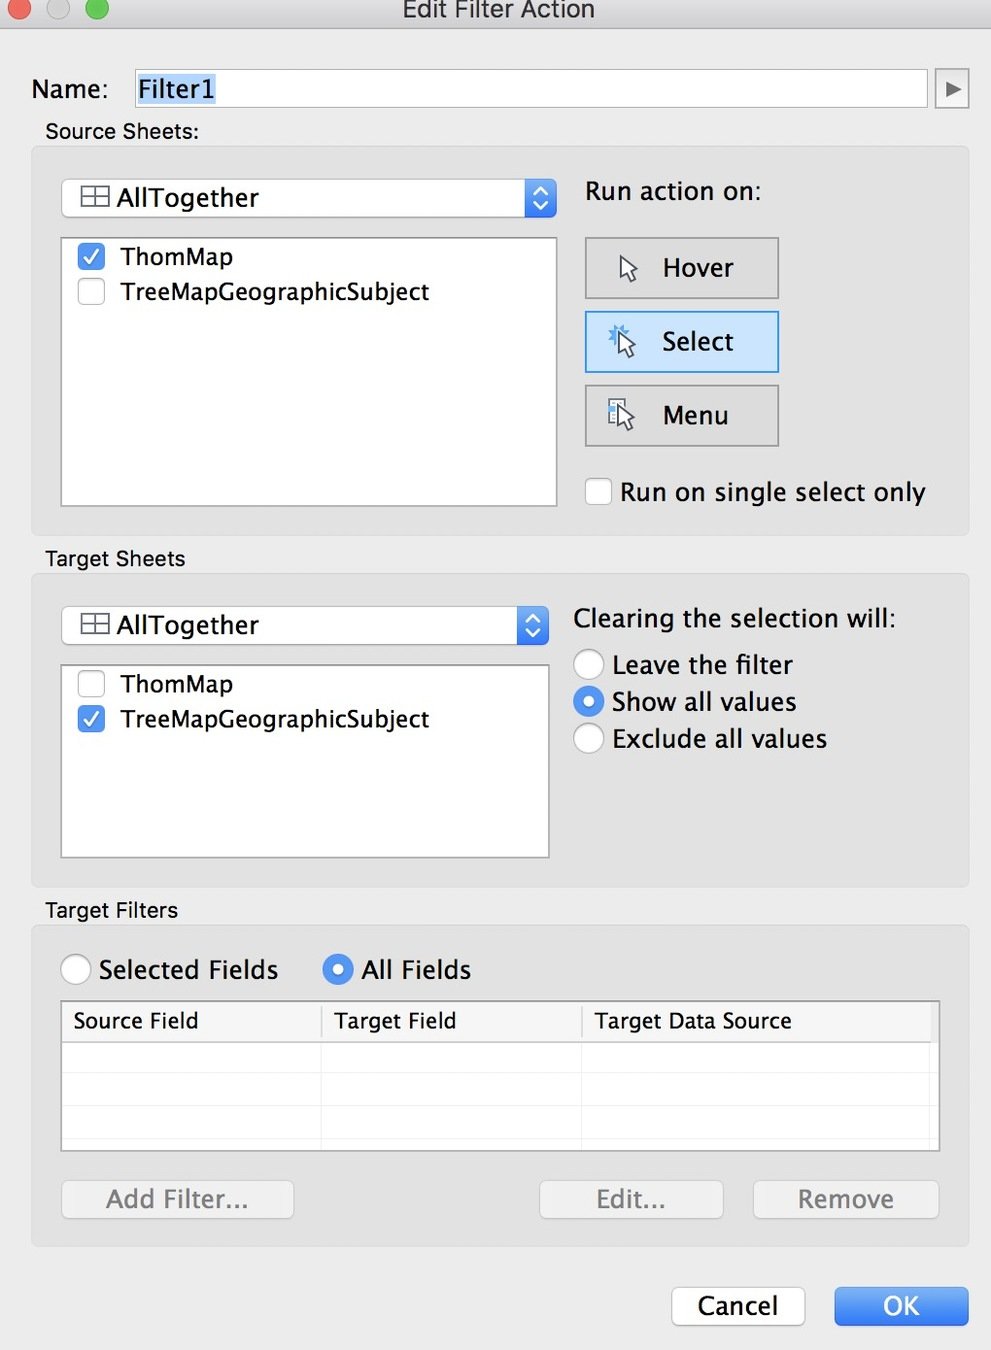
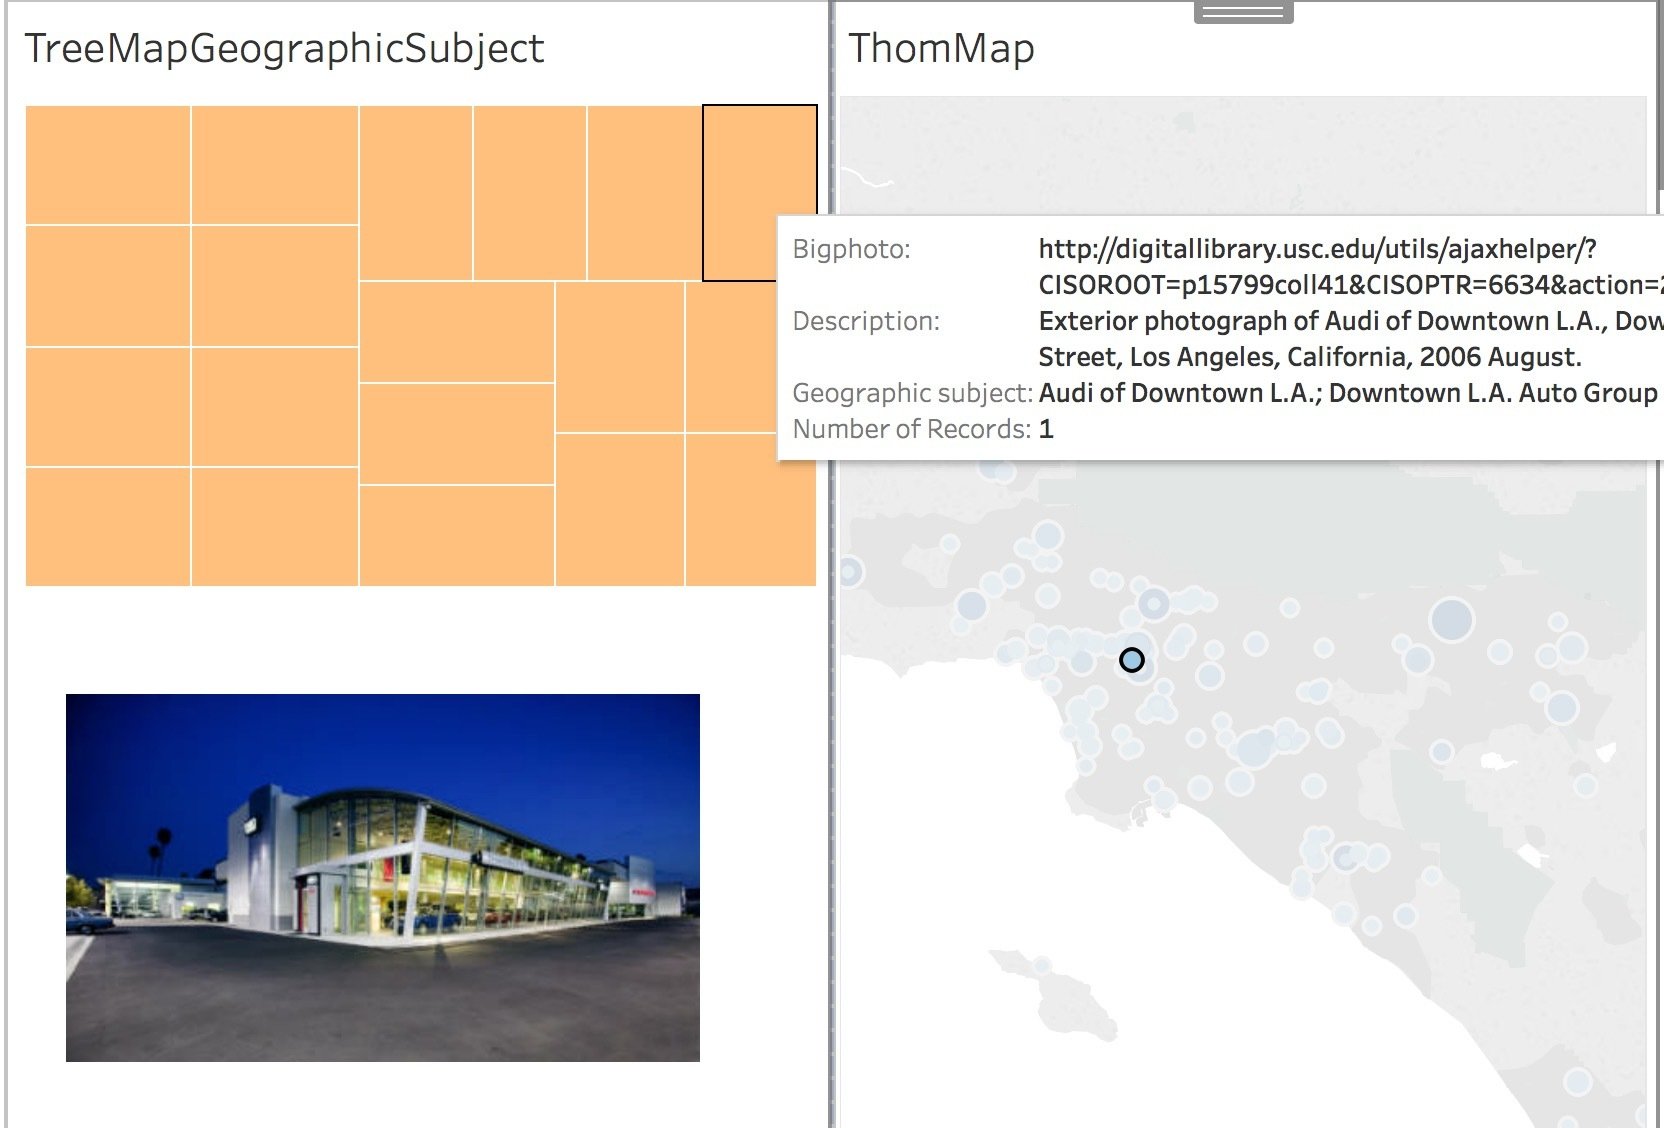
Lets do a new dashboard with the map and treemap. This time we will add an action so that we can use the map to filter the TreeMap. And we will add another photo viewer.
You can save these projects and use them again or share them on Tableau Public.
For another good intro to Tableau check out Kristen Mapes tutorial - http://www.kristenmapes.com/tableau/
By Andy Rutkowski


