A Thousand Cuts Down to 5
How to Keep Unity’s Drawcalls and Other Bottlenecks in Check
A tale of lessons learned developing for a platform that literally caught fire
by
Cratesmith
(aka Kieran Lord)
Disclaimer
As usual I may swear and rant.
This was really hard to make into a cohesive talk.
The name of the talk was going to have this really cool point in 5 steps...
However in re-writing this talk I found a better way to do it.
So lets fix up the title
Optimization Takes a whole team
How to Actually keep performance in check.
by
Cratesmith
(aka Kieran Lord who sucks at naming talks)
About me
I make games!
- PS2/XB: Destroy All Humans 2
- 360/PS3: The Dark Knight (Unreleased)
- Wii: Next big thing (Unreleased)
- Web: Alternator
- PC/PS3: Vessel
- iOS/Droid: Sim Cell
- iOS/Droid: Codebreakers
- PC/Mac: Kinect & VR support for Tail Drift
- GearVR: Small (unreleased)
- Cardboard: RACQ Bike VR
- GearVR: Zombie Nom Nom
Plus a bunch of middleware, consulting, professional education and R&D.
A deep dive into how to optimize for a particular kind of hardware or game.
Hard limits or rules on "don't use this feature" or "don't use more than X drawcalls"
What this talk isn't
A case study of a project that was a right nightmare to optimize all throughout development
The focus is going to be on looking at processes and guidelines that we used to finish it.
You're in a processes and workflow talk.
What this talk is
Overall philosophy

"Always shippable"
Everything put into a game should be in a state & quality where it could go into the final game.
Basic performance is a big part of that quality.
If performance is bad, work will need to be redone, crunched or cut.
(Obviously excluding prototyping & first passes)

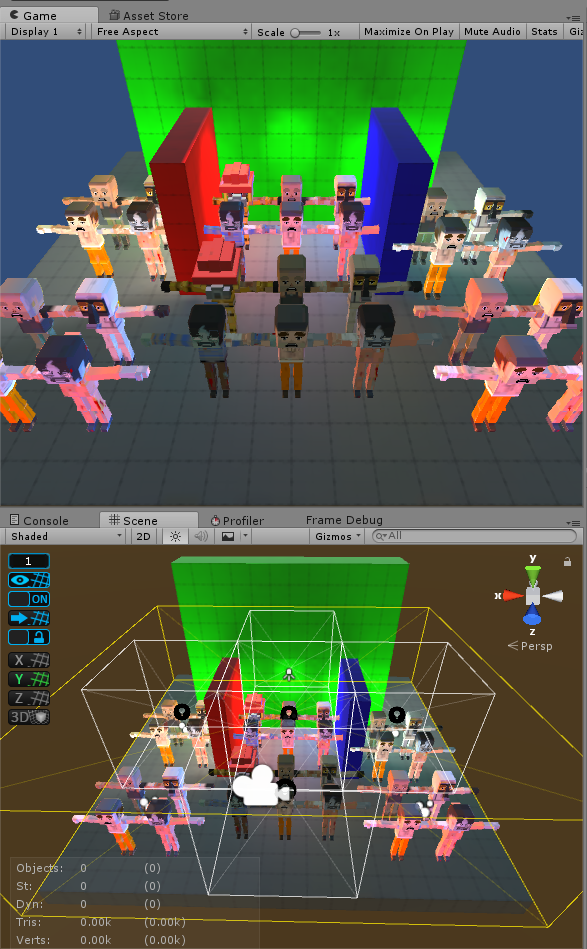
Fig1. Solution not shippable
"Baseline optimization'
You need baseline performance in order to make the game.
That means the game must run at target frame rate during development.
"Early optimization is the root of all evil"
- I don't like this phrase, because people take it as gospel.
- Deep optimization IS a rabbit hole that can stall development.
- ...But if the game is running under target frame rate, it's a bug!
- Worse, trying to regain acceptable performance late in development can be impossible!

Fig2. How poor performance affects designers & artists.
"Everyone is independent"
Performance is the entire team's responsibility.
Everyone in the team needs the tool & knowledge to manage performance for anything they're making independently of others.
You need to make tools and teach other members of the team how to use them.
If performance problems, common errors and or busywork can be automated DO IT.
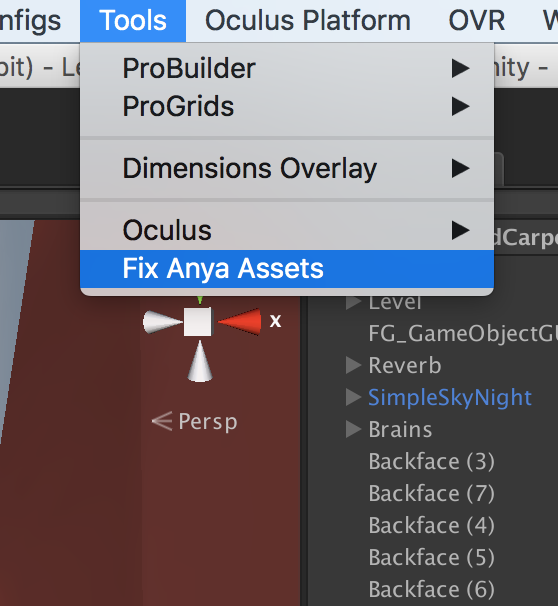
Fig3. A tool that saved hundreds of hours and took 5 minutes to make.
Case Study
GAme & PLATFORM
Programming guidelines
REndering Pipeline
Modelling/Texturing pipeline
Level design/Environment art pipeline
Build Pipeline
GAme: Zombie nom nom
First person walking game, always moving forward.
You're a zombie and you run into people to eat their brains.
The round ends if you go too long without eating any brains.
You look really dumb while playing it.
Small but visually complex environments (for GearVR)

Platform: The GEAR VR
Very rough S6 guidelines
- 75k static polys
- 8k dynamic polys
- 25 draw calls per eye
- Required 60fps
- No Instancing
- Not all support single pass stereo rendering
- Note7 model can explode
Weak GPU but much more easily CPU bound (mostly rendering)

Case Study
GAme & PLATFORM
Programming guidelines
REndering Pipeline
Modelling/Texturing pipeline
Level design/Environment art pipeline
Build Pipeline
Goals
The goal was to write code that was quick to make/edit and had a good baseline performance.
Always profile before/after each change.
Refactor or optimize areas that are running slow.
Focus on shortcuts that avoid major issues.
THe Profiler
Everyone on the project should be able to use the profiler.
But as a programmer, it should be used to test everything before it's put in the game.
It also shows when/where heap allocations are occuring in the callstack.
Never just rely on your gut feel that "it's faster". Always compare before/after in the profiler.
Tools and automation
Other roles need the tools to make content for the project as efficiently as possible.
If someone in a non-technical is spending time every iteration doing technical work... at least consider that for automation.
Don't just use the unity default features, turn it into an editor built around your team & game.
The most powerful feature unity has is how flexible it's editor scripting is.
Benchmarking & Limits
Everyone on the team needs to know at least rough limits of what they're working on (how many characters / sounds / fx / polys etc).
Finding those out/keeping them up to date is just as important as writing features.
Always ensure there's a small amount of breathing room in these numbers so that people can break them a little if needed.
Programming: problem areas
- GC/Heap
- Physics
- Update()
GC/HEAP #1
Heap allocations can be VERY slow.
A programmer specific performance problem.
PCs aren't nearly as badly effected by this as as consoles & mobile.
If unchecked this can make porting a nightmare.
GC/HEAP #2
Garbage collection happens when you allocate something and the heap is full/fragemented, too much time has passed or if you call GC.Collect()
There's significant CPU spike as the garbage collector cleans up deleted objects on the heap.
You can manage the severity of the next GC spike by calling GC.Collect when CPU usage is low.
List<Objective> m_tempObjectives
    = new List<Objective>();

public override void OnUpdate()
{
    base.OnUpdate();
    m_tempObjectives.AddRange(m_objectives);
    foreach (var objective in m_tempObjectives)
    {
        if (objective != null)
        {
            objective.Update();
        }
    }
    m_tempObjectives.Clear();
}
GC/HEAP #3
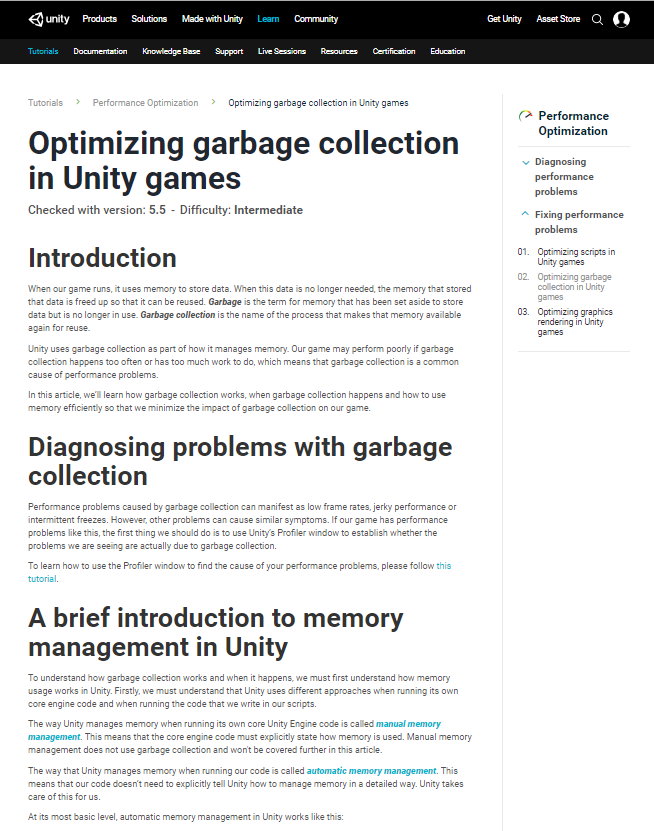
Go read the official Unity tutorial "Optimizing garbage collection in Unity Games" ... it's detailed! VERY detailed!
In Brief:
- Avoid using functions that return new objects (such as arrays).
- Understand the rules around boxing.
- Avoid Linq (unless you're checking IL it's generating)
- Pool & reuse allocations where possible.
Physics complexity
The cost of physics in CPU is heavily affected by on complexity and number of colliders near one another.
This can be cut down a lot.
Use layermasks extensively, especially for triggers & raycasts.
Also try to keep your physics environment "clean"
- Use primitive colliders instead of meshes
- Avoid mesh colliders for non-static objects
- Use convex mesh colliders when possible
Update()
If you don't need to update something every frame... don't!
Break expensive logic out from required updates, in the update make it animate correctly and blend any changes.
Use coroutines, jobs, timers or managers to update that independently of the framerate/physics timestep.
Lessons Learned
Profiling everything before/after each change revealed that our "gut feel" couldn't be trusted at all.
Getting everyone on board with GC alloc rules was a great time investment.
Regularly updated benchmarks & tools made for other team saved both their time and programmer time (less support needed!)
Case Study
Programming guidelines
REndering Pipeline
Modelling/Texturing pipeline
Level design/Environment art pipeline
Build Pipeline
GAme & PLATFORM
This section
Before explaining the process we need to briefly discuss the rendering pipeline.
To just make the core gameplay we were pushing the GearVR's rendering limits.
The requirements of the render pipeline dictated the art style, asset pipelines and the team's workflows.
Batching / Draw Calls
A drawcall is basically a SetPass call followed by one or more vertex buffers sent to the GPU.
SetPass is called between batches of objects to set textures & render parameters.
SetPass can be very slow on CPU
If the Render thread gets behind, the GPU can be left idle.
Batching is where unity tries to group objects together to minimize the number of SetPass calls.
Consoles, Standalone VR and mobile are much more affected by drawcalls than PC.
Batching vs Render API
Which render APIs your platform supports has a big impact on how expensive drawcalls are.
Unity is faster at submitting draw calls with the new APIs such as vulkan/metal/DX12 .
Additionally on some platforms they allow drawcall submission to be multithreaded heavily.
If you are only releasing for platforms that support this you'll generally be able to run many more drawcalls without becoming CPU bound.
Hardware support for these isn't universal however... and vulkan is presently unsupported on GearVR


Batching: STATIC
The first kind of batching unity supports is "Static Batching".
Works as "baked" batching for static geometry (though can be done at runtime).
Has significant memory overhead.
Reliably saves CPU time.
It performs significantly better with large "chunks" of geometry rather than hundreds of small objects.

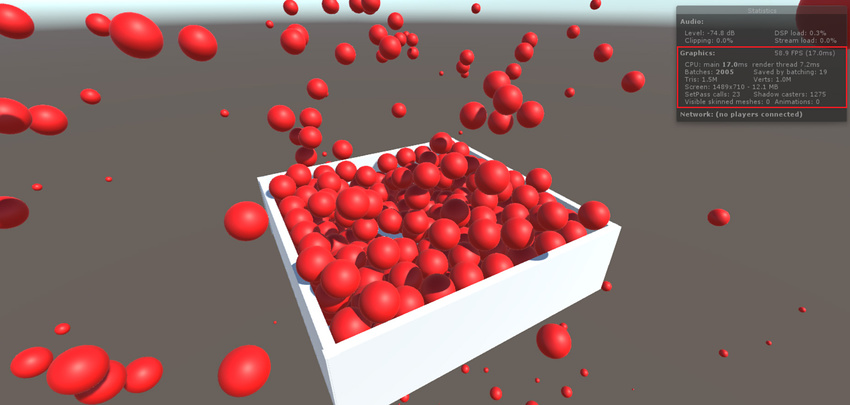
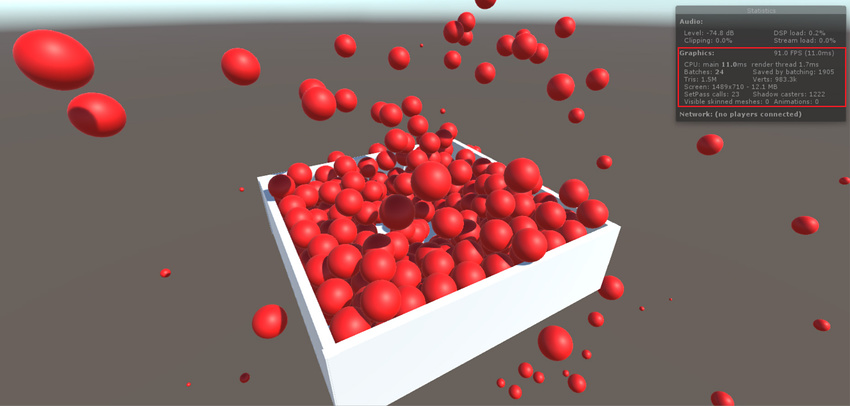
Batching: Dynamic
Dynamic batching merges groups of meshes each frame CPU for rendering.
Limited to meshes of ~300 verts or less, depending on your shader.
Only saves CPU on platforms where SetPass is very slow.
Test with/without dynamic batching.
Most games run faster with dynamic batching disabled!

Batching: Instancing
Draws a single mesh multiple times with different render parameters.
Very good performance compared to other batching methods.
This feature would have been perfect for Zombie...
...but it wasn't supported for GearVR at the time
Batching: For zombie
Zombie was unfortunately the worst case scenario.
- Crowds of characters
- Lots of dynamic objects
- High drawcall CPU cost
- Instancing not supported
So everything had to be static / dynamic batched.
All assets needed to be authored, processed compiled to make maximum use of both batching types
We were constantly alternating between being CPU and GPU bound
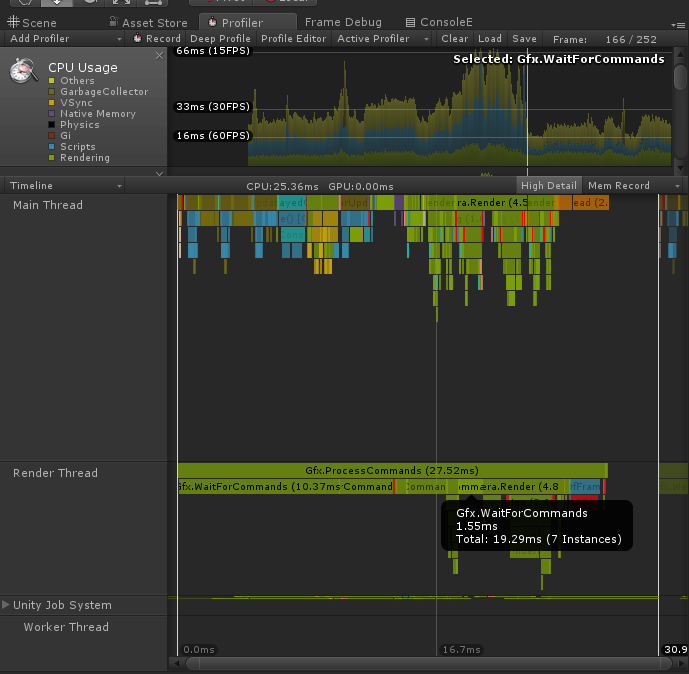
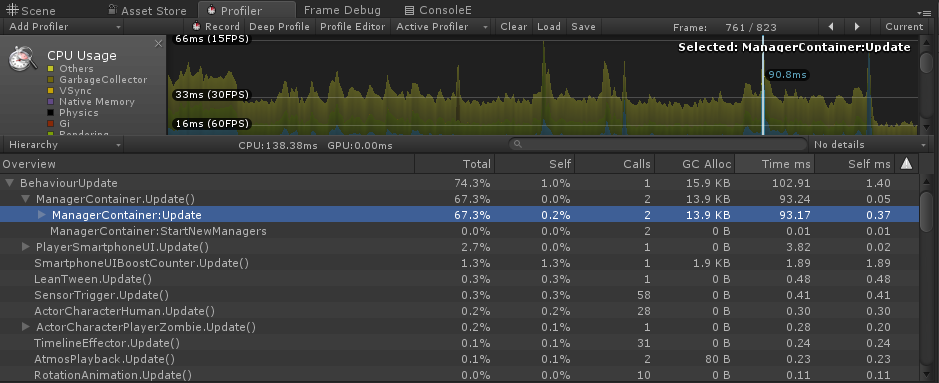
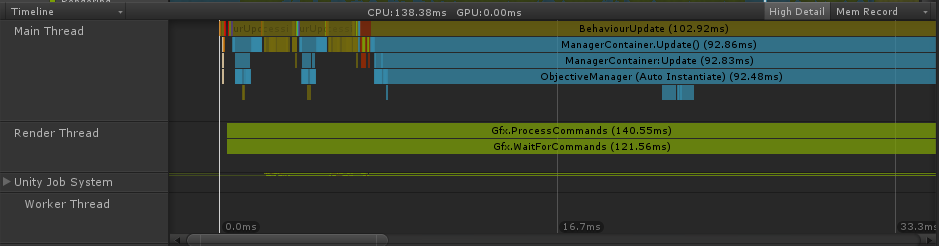
Draw Calls: PROFILER
The profiler was the easiest way to track if we were CPU or GPU bound and what was the cause.
Gfx.WaitForCommands will indicate when the render thread is waiting for the GPU.
Long processing in Camera.Render usually suggested being bound by drawcalls.
Profiler does affect performance significantly on device. So we had a "framerate info" overlay built into dev builds.

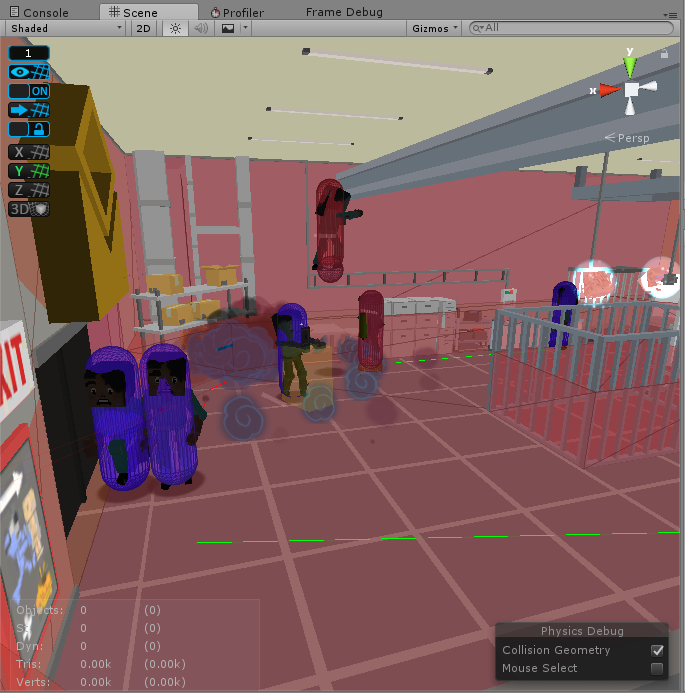
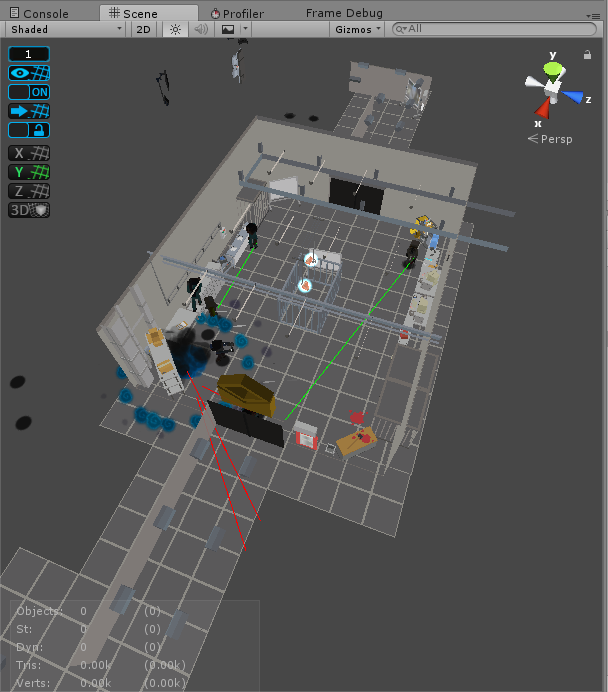
Frame Debugger
If we were CPU bound, we'd start by opening up the frame debugger to see what drawcalls could be cut or batched together.
It made tracking down when batching wasn't working a lot easier.
Additionally it helped us with ordering our rendering to minimize overdraw (the main way we were GPU bound)
Unfortunately the FD had issues with VR devices at the time, so we'd mostly use it in editor as a guide.
Lessons Learned
Static batching was always a saving for CPU.
We had to prevent certain objects static batching to avoid overdraw.
We were in the unfortunate position where needed dynamic batching to make the game work.
A lot of the problems we faced on this project could have been avoided if the platform supported instancing or newer APIs
Case Study
Programming guidelines
REndering Pipeline
Modelling/Texturing pipeline
Level design/Environment art pipeline
Build Pipeline
GAme & PLATFORM
Goals
The artists should be able to build models, put them into the game & test them.
Any technical busywork should be automated and have a fast iteration time.
The more of the time artists are focused on making content for the game (within constraints) the better the game gets.
Profiler again!
Teach artists how to use the profiler to check their work using the profiler!
Just the parts of the profiler relevant to their work.
How to check polygon budgets, drawcall restrictions etc.
Getting content in game
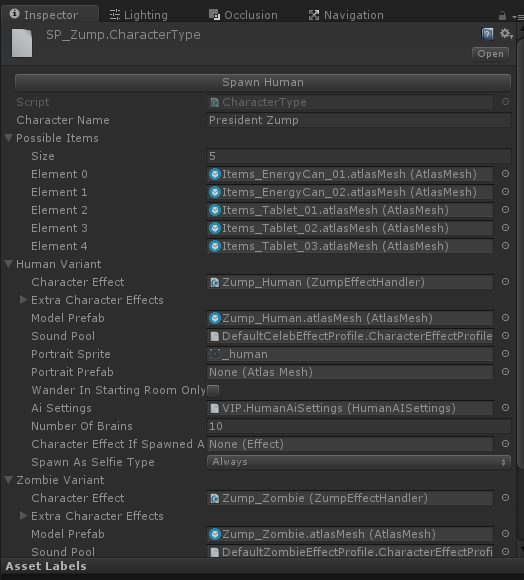
Everything had a specific, simple asset type.
Eg. All NPCs have a CharacterType asset as a central point for other assets that define how they look/sound/behave.
Testing characters, objects, effects etc in both empty scenes or levels in the game was supported and easy.
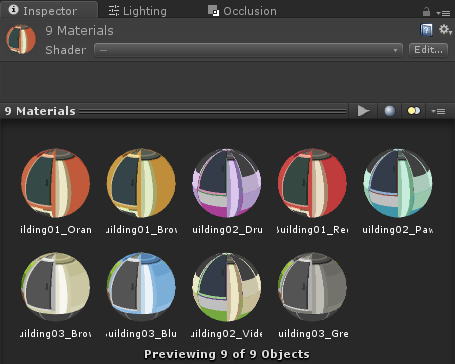
Atlasing
Drawcalls can only contain objects with the same material & params.
So if you need to reduce drawcalls, merging textures and materials is the first thing to do.
My preference is to generate altas textures, meshes & materials automatically in editor.
Unity does provide methods to combine textures for this, but getting a good automatic workflow takes a bit of editor scripting.
There's some tools on the Asset Store that do variations on this if you don't want to roll your own
Atlasing: Problems
The difficulty with atlases is keeping them up to date.
Editor scripts checked if any inputs to the atlas had changed. The atlas only auto-rebuilds if this has happened.
This kept iteration time down as reimporting atlases was quite slow.
Lessons learned
Auto-generating atlases was an easy win, and less work than expected.
Teaching artists to use the profiler was really valuable.
In future I'm going to make it so artists can export groups of models (eg, all characters) in a single fbx and import scripts break them up & fix transforms.
Case Study
Programming guidelines
REndering Pipeline
Modelling/Texturing pipeline
Level design/Environment art pipeline
Build Pipeline
GAme & PLATFORM
Goals
Everyone on the team had a hand in working on the levels.
Despite the restrictions, the tools and limitations had to be fully understood by everyone.
We also wanted to use probuilder (an in-unity level/mesh editor) in the pipeline as the team was already familiar with it.
Environments: Building
Each level is built in grey box using probuilder.
Visual meshes are arranged to cover the probuilder geometry.
Design focused geometry makes fast & clean collision and navigation meshes and is easier to tweak.
Environments: Saving
Editor scripts whenever the scene is saved
Navmeshes are built from probuilder geometry flagged as "colliders"
Occlusion is built for visual meshes (and probuilder objects flagged as "occluders")
Warnings are thrown for common mistakes.
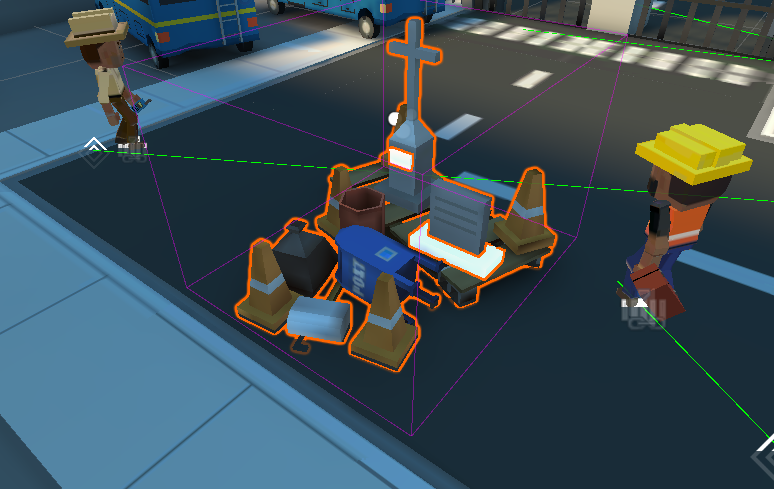
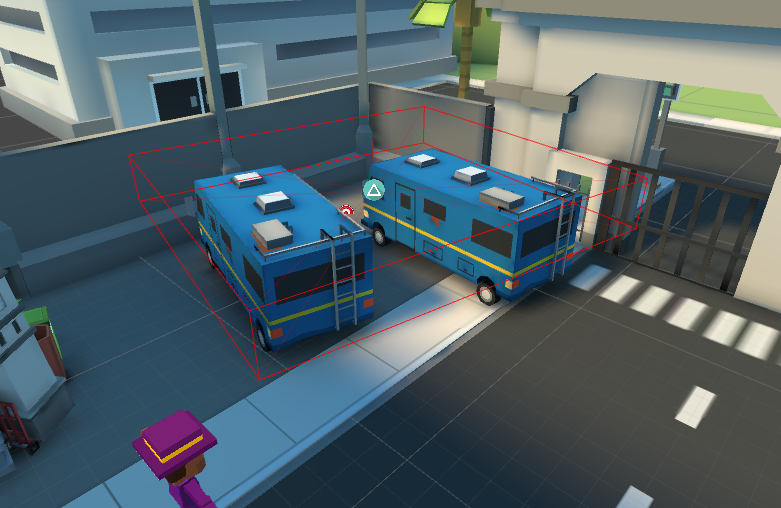
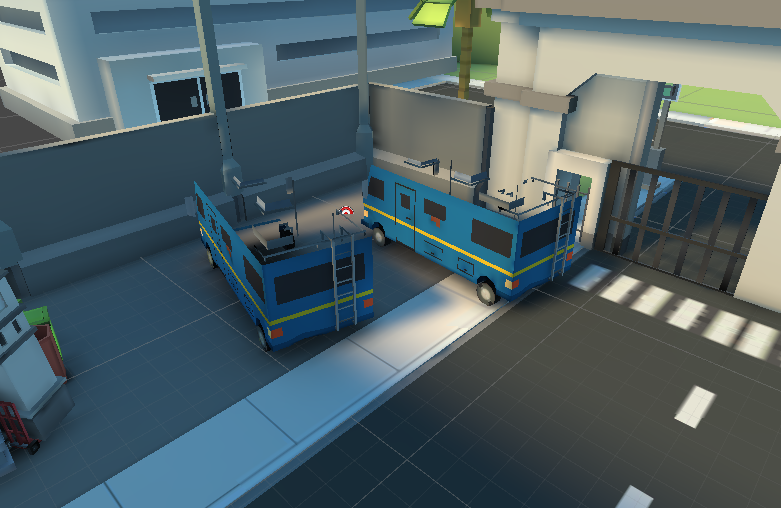
Environments: Chunks
Static visual meshes are grouped into chunks by hand.
Chunks are parent objects that atlas & merge all visual meshes under them on play/build.
Selecting which meshes were in each chunk was a tradeoff between drawcalls (better static batching) and polycount
Environments: LIMITS
From benchmarking we knew rough "safe limits" for drawcalls and polycount. (75k static, 8k dynamic, 25 drawcalls/eye)
Everyone was shown how to use the profiler to track drawcalls & polycount.
If anyone could reorganize chunks/occlusion to fit more polys, they could add more detail.
Quality skyrocketed.
Environments: Markup
Everyone wanted to minimize polys to fit more stuff but we had "wasted polys" on objects that were never seen.
So we added "Backface Cull Volumes" to the scenes to strip polygons during the chunking process.
Any face inside the volume that matches the direction of the volume gets discarded.
We generally saved 20% of polys per level using these.
The trimmed polys still wasted space in the lightmap, a tradeoff for it being a simple workflow.
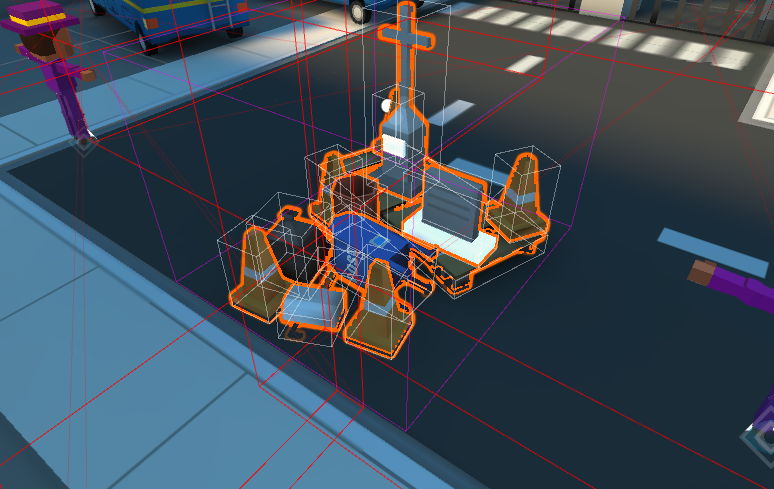
Environments: Culling
Chunks are parented to culling sectors. A parent with a bounding volume
A culling sector has a list of the other sectors that are visible when the camera is inside it.
Some sectors didn't have their own geometry, they were just "triggers" for visibility sets around doorways.
This is separate from unity's occlusion culling which is also used.
Lessons learned
We accidentally made a game out of fitting more detail into levels... and we got pretty good at it.
Automatic processes with simple markup volumes are really easy to explain and use.
Custom occlusion culling could have been easier to use but fit the needs of the project.
Having benchmarked limits that people can work against is essential (even if they're rough)
Case Study
Programming guidelines
REndering Pipeline
Modelling/Texturing pipeline
Level design/Environment art pipeline
Build Pipeline
GAme & PLATFORM
Goals
Wanted to make sure that everyone was testing on final hardware as much as possible
Or at the least checking everything in desktop VR.
People tend to avoid this as it's slower, espeically with GearVR build times.
Iteration time is key!
PRESS PLAY TO TEST
Every scene needs to work when you push play. No exceptions.
If any systems needed by the scene controller or any actor are auto-constructed.
BUILD & RUN ANY SCenE
Testing on device is slow enough as is. Being forced to make a full build is too much.
We usually just want to test one level, so we needed a way to one click build & run a single scene.
I'd maintained a fork of UBS (an opensource unity build manager) on previous projects which was expanded for this.
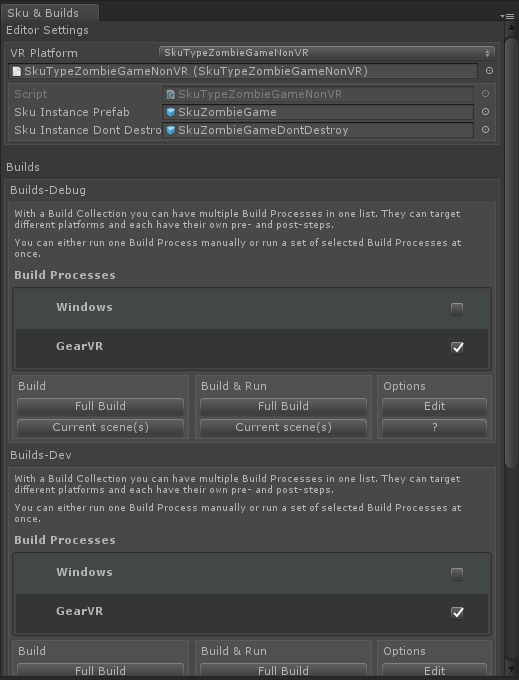
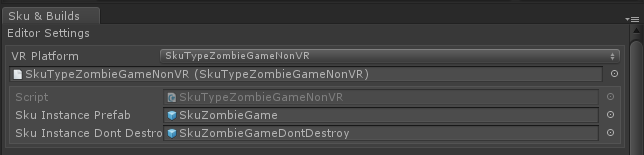
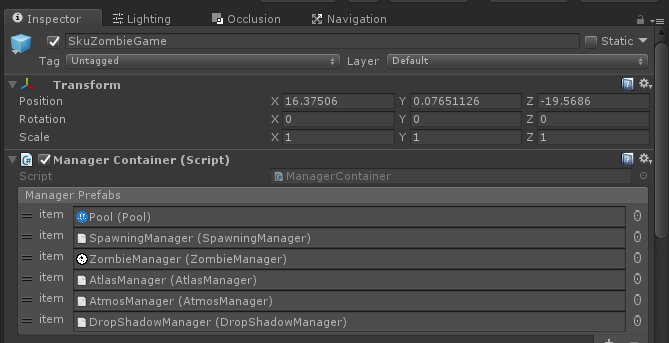
SKU types
We didn't have enough headsets go around. So we needed to support non-vr builds.
Expanded the build system to have a concept of plaforms (Skus)
Each SkuType was an editor script that configured the project & plugins to build or run in this mode.
Each SkuType also injects a prefab into each built scene based on the platform (eg, to handle different VR camera setups)
public class SkuTypeZombieGameNonVR
: SkuTypeZombieGame
{
#if UNITY_EDITOR
    public override void EnablePlatform()
    {
        base.EnablePlatform();
        UnityEditor.PlayerSettings
            .virtualRealitySupported = false;
    }
#endif

    public override bool vrSupported
    {
        get { return false; }
    }
}
Lessons learned
Unity generally has good iteration time during prototyping.
Keeping that iteration time up during development is up to you.
In our case level specific builds/non-vr versions helped a lot but each project is different!
QUESTIONS?
Example: Pooled temporary Lists
foreach(var mr in gameObject.GetComponentsInChildren<MeshRenderer>())
{
    // do stuff!
}
using(var mrList = gameObject.GetComponentsInChildrenTempList<MeshRenderer>())
foreach(var mr in mrList)
{
// do stuff!
}Fig1. Creates a new array on the heap
Fig2. Example using a pooled temporary list instead
GC/HEAP: Advice
Example: Pooled temporary Lists
public class TempList<T> : IDisposable, IList<T>
{
    private static readonly Queue<TempList<T>> s_lists = new Queue<TempList<T>>();
    public readonly List<T> list = new List<T>();

    private TempList() {}

    // acquire a temporary list
    public static TempList<T> Get()
    {
        lock(s_lists) return s_lists.Count > 0
                ? s_lists.Dequeue()
                : new TempList<T>();
    }

    // return a list back to the pool
    public void Dispose()
    {
	list.Clear();
        lock(s_lists) s_lists.Enqueue(this);
    }

    public static implicit operator List<T>(TempList<T> from)
    {
	return from != null ? from.list : null;
    }

    // ILIST IMPELMENTATION (call appropriate method on this.list)
}
Fig3. TempList implementation
GC/HEAP: Advice
Example: Pooled temporary Lists
public static TempList<T> GetComponentsInChildrenTempList<T>(this Component @this,
    bool includeInactive=false)
{
	var tempList = TempList<T>.Get();
	if(@this!=null)
	{
		@this.GetComponentsInChildren<T>(includeInactive, tempList.list);
	}
	return tempList;
}


public static TempList<T> GetComponentsInChildrenTempList<T>(this GameObject @this,
    bool includeInactive=false)
{
	var tempList = TempList<T>.Get();
	if(@this!=null)
	{
		@this.GetComponentsInChildren<T>(includeInactive, tempList.list);
	}
	return tempList;
}
Fig4. TempList extension methods
GC/HEAP: Advice
Atlasing: output Data
AtlasData stores info on how to map textures to
MeshGroups store all the meshes created for atlased models.
Prefabs are created for each of the atlased models.
AtlasMesh files created for each atlased model. Dummy assets that are lookup keys for the real models.
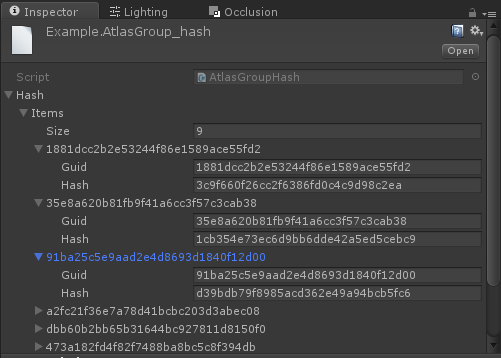
Atlasing: Versioning
In order to auto-rebuild atlases if they're needed we need to be able to track if contents have changed.
Building the atlas creates a hash asset which stores Unity's hash for each asset.
If the list of GUIDs/hashes for the AtlasGroup's inputs don't match the hash asset, the atlas is out of date
This worked really well! It's a reliable & general purpose solution for auto-generating assets.
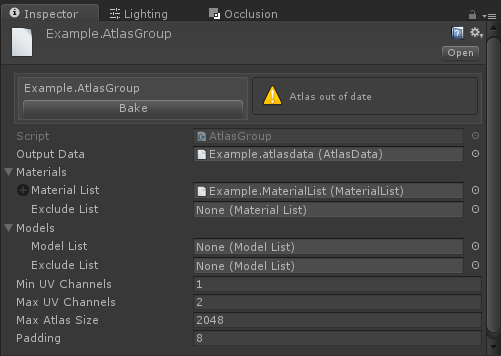
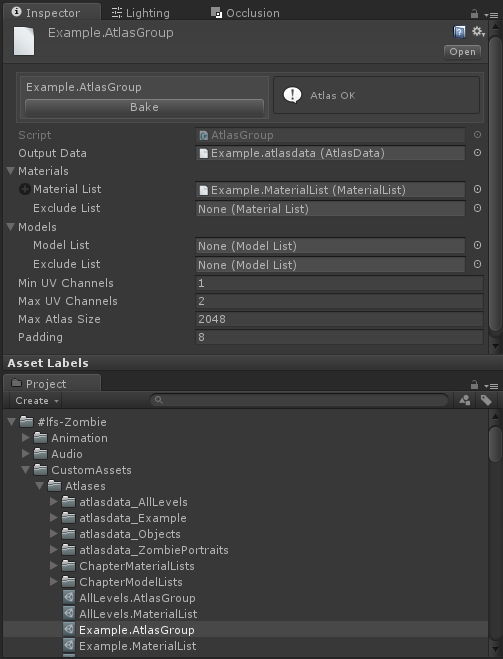
Atlasing: AtlasGroup
Defines what's going to be built into an atlas and how.
Takes Model/Material list assets as inputs.
Used as a handle for the atlas by the rest of the game.
When built it creates a child folder for all the output assets.
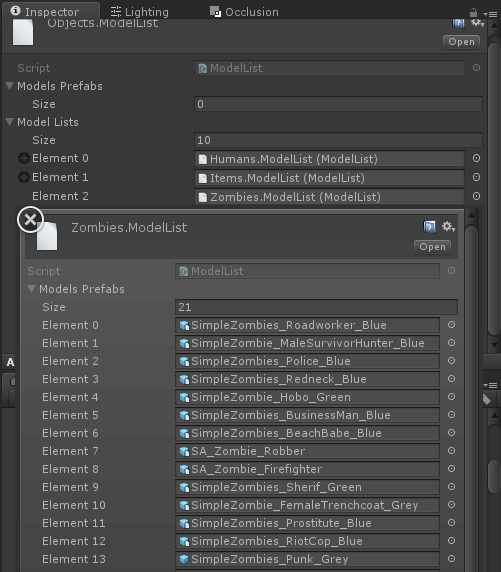
Atlasing: Input LISTS
Recursive list assets for models & materials as inputs for atlases.
List of assets and a list of child lists.
Easy to maintain lists of objects/characters by hand, but tracking what levels use wasn't.
Saving a level creates/updates a material list for all static meshes in that level.
Batching LIGHT PROBES
Problem: We used lightprobes instead of dynamic lighting + dynamic batching.
Light probes calculate SH values from the light probes for MeshRenderer's anchor transform.
Different SH values = different batches for dynamic batching.
Batching Light Probes
Characters drawcalls:
No anchor
1 character = up to 50 drawcalls
Waist bone as anchor
1 character = 1 drawcall.
(Same as using skinned meshes)
Multiple characters with shared anchor
up to 5 characters = 1 drawcall
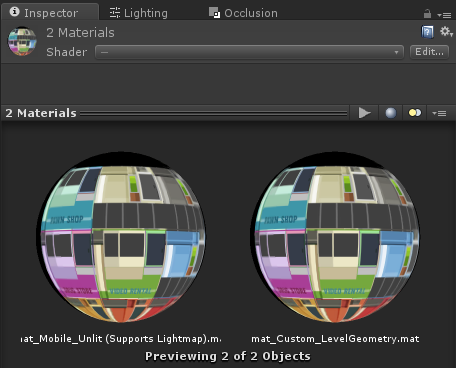
Atlasing: Problems #2
We also had the problem that applying the atlas UVs to meshes at runtime was too slow on the GearVR.
So "pre-atlased" versions of models for characters & objects needed to be built with the atlas texture.
Each atlas needed to have a lookup table for a prefab to use instead of the model.
Light Probe Sectors #1
Environments marked up with light sectors, bounding volumes.
Objects/Characters look up which light sector they're in and use it's transform as their light probe anchor.
Light sectors can overlap! Objects use the sector with the highest priority.
Have to be tweaked by hand to make it look right.
Light Probe Sectors #2
Pros:
Solved our batching problems!
Also simplified adding light probes to levels. The sectors automatically created light probes for each bounding volume.
Cons:
Placement of light sectors to look good became a level design/art problem. More on that soon!
Still paying for transforming/culling/occlusion on each mesh seperately.
GC/HEAP Boxing
Boxing occurs when a value type (struct, int, bool etc) is passed into a function that expects an interface or object.
The value type creates a temporary System.Object that contains the value so that the function can treat it like an object.
This is very easy to do without realising it.
If a function that shouldn't be allocating is showing up on the profiler with GC Alloc this is the likely culprit.
void SurpriseAlloc()
{
    int cost = 5;
    string displayString
        = String.Format("Price: {0} gold", cost);
}
public interface IInterface {}
public struct MyStruct : IInterface {}

void ThisIsBadToo()
{
    var val = new MyStruct();
    InterfaceBoxingExample(val)
}

void InterfaceBoxingExample(IInterface val)
{
    Debug.Log("dang");
}
bool AnotherExample(object thing)
{
int val = 5;
return thing!=null && thing.Equals(val);
}
Raycasting: PRoBLEM
Raycasting is incredibly useful, however it's very expensive on CPU (and operates in the main thread!).
Caspule/Sweep casts are even worse!
It's very easy to cause spikes even on PC if too many raycasts occur in one frame.
A thousand cuts down to 5
By cratesmith


