Intro to D3
Since presenting this deck years ago, jsbin has revoked embedding their live code editors for the free version. For now, follow the links to use the editors.
go to slides.com/evandana/d3-intro-3/live and play this d3 game
Getting Started with
D3.js
Evan Dana | Sapient
Class Overview
Evan Dana | Sapient
Evan Dana
JavaScript Developer
D3.chart.* | Sapient Global Markets | Putnam Investments
Rochester Institute of Technology
November Project | Ironman | Bike commuter
You
Interest in D3?
Daily occupation?
Programming experience?
This is a class on d3
so, what is d3?
Data Viz
SVG
Static D3
Dynamic D3
Objective
- Chart with SVG
- D3.js dynamic chart
- JS best-practices
Web basics
(HTML, CSS, DOM)
Programming basics
(JavaScript)
Assumptions
Focus
JSBin
Edit live | Sandboxed
change 'duration' to be 200 or 4000
Data Viz
Evan Dana | Sapient
Data Viz on web?

Canvas
<div>
SVG
HTML5
HTML
Pixels | Graphics API
Limited Shapes
Scalable | Direct Element Interaction
Selection of viz scripting libraries
| Library | Notes | Pros |
| D3.js | JS SVG Library | Event-driven |
| Highcharts | JS SVG Library, Free for non-commercial | IE6+ |
| Google Charts | JS SVG Library | Exceptional documentation |
| Raphael | JS SVG Library, VML for sub IE9 | Old browsers |
| Paper.js | canvas, PaperScript, good for games (frame-based, object-based animations) | Android |
| Processing.js | canvas, not easily interactive, meant to teach programming, ProcessingScript based on Java, fast rendering | Android |
data
documents
SVG | HTML | Canvas
elements | charts | information
general purpose visualization library
SVG


Image Credits: www.sitepoint.com/how-to-choose-between-canvas-and-svg/ and http://mbtaviz.github.io/
HiFi & Zoom
Interactive Charts
d3 libraries

d3.chart | nvd3.org | c3.js
Quick Review
Canvas vs SVG?
Pros & cons
Great use for each
D3 uses __ ?
SVG
Evan Dana | Sapient
Rectangle
SVG Basic Elements
<svg width="400" height="110">

    <rect width="300" height="100"
        style="fill:rgb(0,0,255);stroke-width:3;
        stroke:rgb(0,0,0)" />

    <circle cx="50" cy="50" r="40" stroke="black"
        stroke-width="3" fill="red" />

    <line x1="0" y1="0" x2="200" y2="200"
        style="stroke:rgb(255,0,0);stroke-width:2" />

    <text x="0" y="15" fill="red">I love SVG!</text>

</svg>
Common Attributes
width, height, fill, stroke
cx, cy, r, fill
x1, y1, x2, y2, stroke
x, y, fill
rect
circle
line
text
Line, Circle, Text
More SVG
SVG Tutorial:
SVG Filters:
SVG Gradients:
SVG Examples:
SVG Reference:
Challenge
Create the below chart using SVG elements
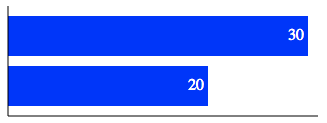
Click "Save" on left to Clone it
Color: 'blue'.
Longest bar is 300px wide.
10px vertical space between bars.
Tips
Style Sheets & SVG
Quick Review
Define with attrs:
SVG Rectangle
SVG Circle
SVG Line
SVG Text
JavaScript
Evan Dana | Sapient
An extremely brief review
JS Data Types
"a"
1
true
[1, 2, 3]
{a:1}
undefined
null
pro tip: test in your console: 'typeof "a"'
Comparison & Casting
(true)
(0)
(1==1)
(1=='1')
(1==='1')
({a:1}==={a:1})
pro tip: test in your console
Functions
function increment(x) {
    return x++;
}

increment(0);
pro tip: test in your console
Chaining
var carFactory = function () {

    var thisCar = this;

    function repaint (color) {
        // repaint thisCar
        return thisCar;
    }

    function changeExhaust () {
        // change exhaust
        return thisCar;
    }

    return {
        repaint: repaint
    };

}

var car = carFactory();

// chain operations
car.repaint().changeExhaust();
pro tip: test in your console
Join
Quick Review
List JS data types
({a: 1} == {a: 1}) = ?
What is chaining?
Explain enter/exit
D3 Primer
Evan Dana | Sapient
Preview
D3 Function Anatomy
selection
    .attr('cx', function (d, i) {return d*10;})
Function that gets your data
(or a static arg that becomes a functor)
Function
d3.selectAll('.chart')
.selectAll('circle')
.data(data)
.enter()
.append('circle')
.attr('cx', function (d) {return d*10;})
.attr('cy', 10)
.attr('r', 20)
.style('fill', 'blue');
In the document,
select every <circle> element
in every element that has a class of 'chart'
d3.selectAll('.chart')
.selectAll('circle')
Bind
to the selection
the data (based on an index)
.data(data)
For the selection of elements bound to data
that do not yet have existing elements
.enter()
To the selection of elements bound to data, for which elements are not created,
add a <circle> element
.append('circle')
To each appended element,
define these attributes
.attr('cx', function (d) {return d*10;})
.attr('cy', 10)
.attr('r', 20)
.style('fill', 'blue');
Quick Review
How do you...
Select all __ elements?
Bind those elements to data?
Add elements to the DOM?
Define attributes for elements?
Static D3
Evan Dana | Sapient
D3 + <div>
<div> vs <svg>
D3 + <svg>
define group
bind data to group
enter()
append group
define group attributes
append element to group
define element attributes
Group Pattern Example
Challenge
Partner up!
Create the chart of circles using d3
Click "Save" to Clone it
Dynamic D3
Evan Dana | Sapient
Dynamic Data
drawSVG = () {
selection | bind | enter | update | exit }
drawSVG()
updateData()
updateData = () {}
Use the code on the right as a template to create a d3 graphic with dynamic data
Setting up Dynamic Data
enter ()
update()
exit()
Use the code on the right as a template to
create a d3 graphic with dynamic data
Element Lifecycle
transition()
delay()
duration()
Use the code on the right as a template to
create a d3 graphic with dynamic data
Transitions
Constancy
enter, update, remove
transition, duration, delay
constancy
Dynamic D3 Review
Quick Review
Talk about
• Dynamic data template pattern
• Element lifecycle
• Transitions
• Constancy
Challenge
Partner up!
Create a chart with dynamic data
Click "Save" to Clone it
More D3
Evan Dana | Sapient
Scaling
Margin Conventions
Filling Container
Dynamic Line
d3 chart types
...
Pie Chart
Dynamic Pie Chart
Axes
Final Challenge
1. Bar chart that resizes with the window
2. Updates with dynamic data
3. Handles enter/exit
4. Add bonus!
Click "Save" to Clone it
Wrapping it up
Look at your d3!
What did you learn?
?
Thanks!
evan at evandana.com
Intro to D3
By evandana


