Intraday Models
Problem Definition
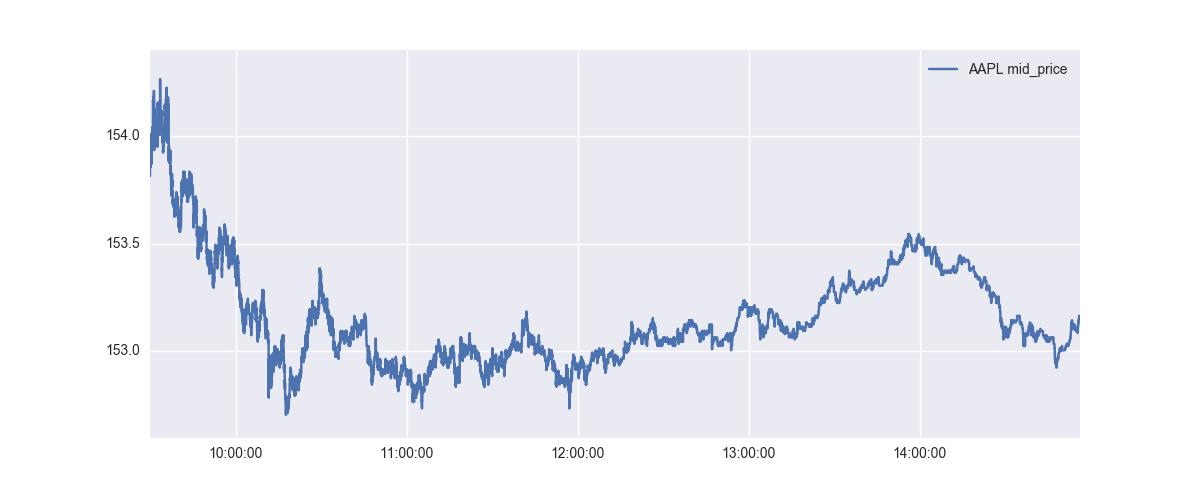
The goal is to predict the price change of a security.
At each point in the above graph, we want to predict the prices after 1 min.
Problem Definition
The following table shows the label for AAPL on 20170928.
| Timestamp (EST) | Current Price | Price Difference |
|---|---|---|
| 09:30:01.500000 | 153.905 | 0.125 |
| 09:30:01.550000 | 153.905 | 0.125 |
| 09:30:01.600000 | 153.9 | 0.13 |
| 09:30:01.650000 | 153.905 | 0.13 |
| 09:30:01.700000 | 153.905 | 0.13 |
Dataset
- Training Period: 20170901 to 20170915 (10 days)
- Testing Period: 20170918 to 20170922 (5 days)
- Numpy Array Shape: (2026106, 361) - before adding transformations
- Source securities: 'SPY', 'BND', 'XLK', 'XLU', 'VNQ', 'IEMG', 'AGG', 'VWO', 'XLF', 'EEM', 'QQQ', 'USO', 'GDX', 'IWM', 'VEA'
- Label mean: 0.0002, standard deviation: 0.0216 (This helps put the MAE values in context)
Features
- bid/ask/mid prices
- bid/ask sizes
- bid-ask spread
- bid/ask/mid moving averages over 1 min and 5 min
- bid/ask/mid trend over 1 min and 5 min
- volume/trades/updates over 1 min and 5 min
Normalization
- 0-1 normalization
- 0-1 normalization and division by mean
Linear Regression
- fit_intercept=False
- Unnormalized, 0-1 normalized and 0-1 mean normalized
LR Results
| InSample | OutSample | |
|---|---|---|
| MSE | 0.000242089 | 43997.8 |
| MAE | 0.0118442 | 151.201 |
| Original stdev | 0.0159 | 0.0202 |
| Predicted stdev | 0.0108 | 179.1057 |
- Simple LR on all features does not work.
L2 penalized LR Results
| InSample | OutSample | |
|---|---|---|
| MSE | 0.000219 | 0.000557 |
| MAE | 0.01101 | 0.01722 |
| Original stdev | 0.0159 | 0.0202 |
| Predicted stdev | 0.0050 | 0.0121 |
- Trained using ElasticNet learning algorithm.
- All 360 features are selected.
- Out of Sample stdev is good.
Lasso Results
| InSample | OutSample | |
|---|---|---|
| MSE | 0.000244 | 0.000412 |
| MAE | 0.01113 | 0.01313 |
| Original stdev | 0.0159 | 0.0202 |
| Predicted stdev | 0.0020 | 0.0018 |
- Selects 11 features out of 360
- fit_intercept=False
- alphas: 1e-3, 1e-4, 1e-5
L1 + L2 penalties
| InSample | OutSample | |
|---|---|---|
| MSE | 0.000244 | 0.000412 |
| MAE | 0.01114 | 0.01311 |
| Original stdev | 0.0159 | 0.0202 |
| Predicted stdev | 0.0020 | 0.0017 |
- Selects 19 features out of 360
- fit_intercept=False
- alphas: 1e-3, 1e-4, 1e-5
- l1_ratio = 0.1 (l1/l2)
Pre-selecting features
- Using standard feature selectors by themselves do not seem to work.
- Using PCA to reduce the number of features does not seem to make much difference.
Using Less Data
- Penalized LR results are same as long as there are >= 2000 datapoints representing most of the time periods.
- In other words, reducing the number of datapoints by 512 is still okay.
Using Less Data
- Penalized LR results are same as long as there are >= 2000 datapoints representing most of the time periods.
- In other words, reducing the number of datapoints by 512 is still okay.
Ensemble Methods
- Checked RandomForest, AdaBoosting and GradientBoosting algorithms.
- They are better at preserving the stdev and generalize relatively better out of sample.
| Algorithm | Stdev | OutSample MAE |
|---|---|---|
| Gradient Boosting | 0.0075 (0.0038) | 0.01583 |
| AdaBoosting | 0.0037 (0.0058) | 0.01345 |
| RandomForest | 0.0236 (0.0149) | 0.02638 |
FNN
- Feed forward neural networks are relatively worse in terms of generalization.
Lessons (re-)learned
- Pure market data features have very limited predictive abilities. (They can be exploited a bit more by adding a regime component on top.)
- Learning algorithms and algorithm parameters that preserve the standard deviation scale are more important than small differences in MSE/MAE scores.
- Out of sample generalization is non-obvious and important.
Intraday Models
By Hardik Patel


