Data Visualization 2.0
Thursday 9 november 2017
Recap
The purpose of your visualization
- Your data visualization allows the audience to access the dataset and find a meaning within the data.
- It helps people to understand what you are trying to tell them.
- Attracts people towards a story.
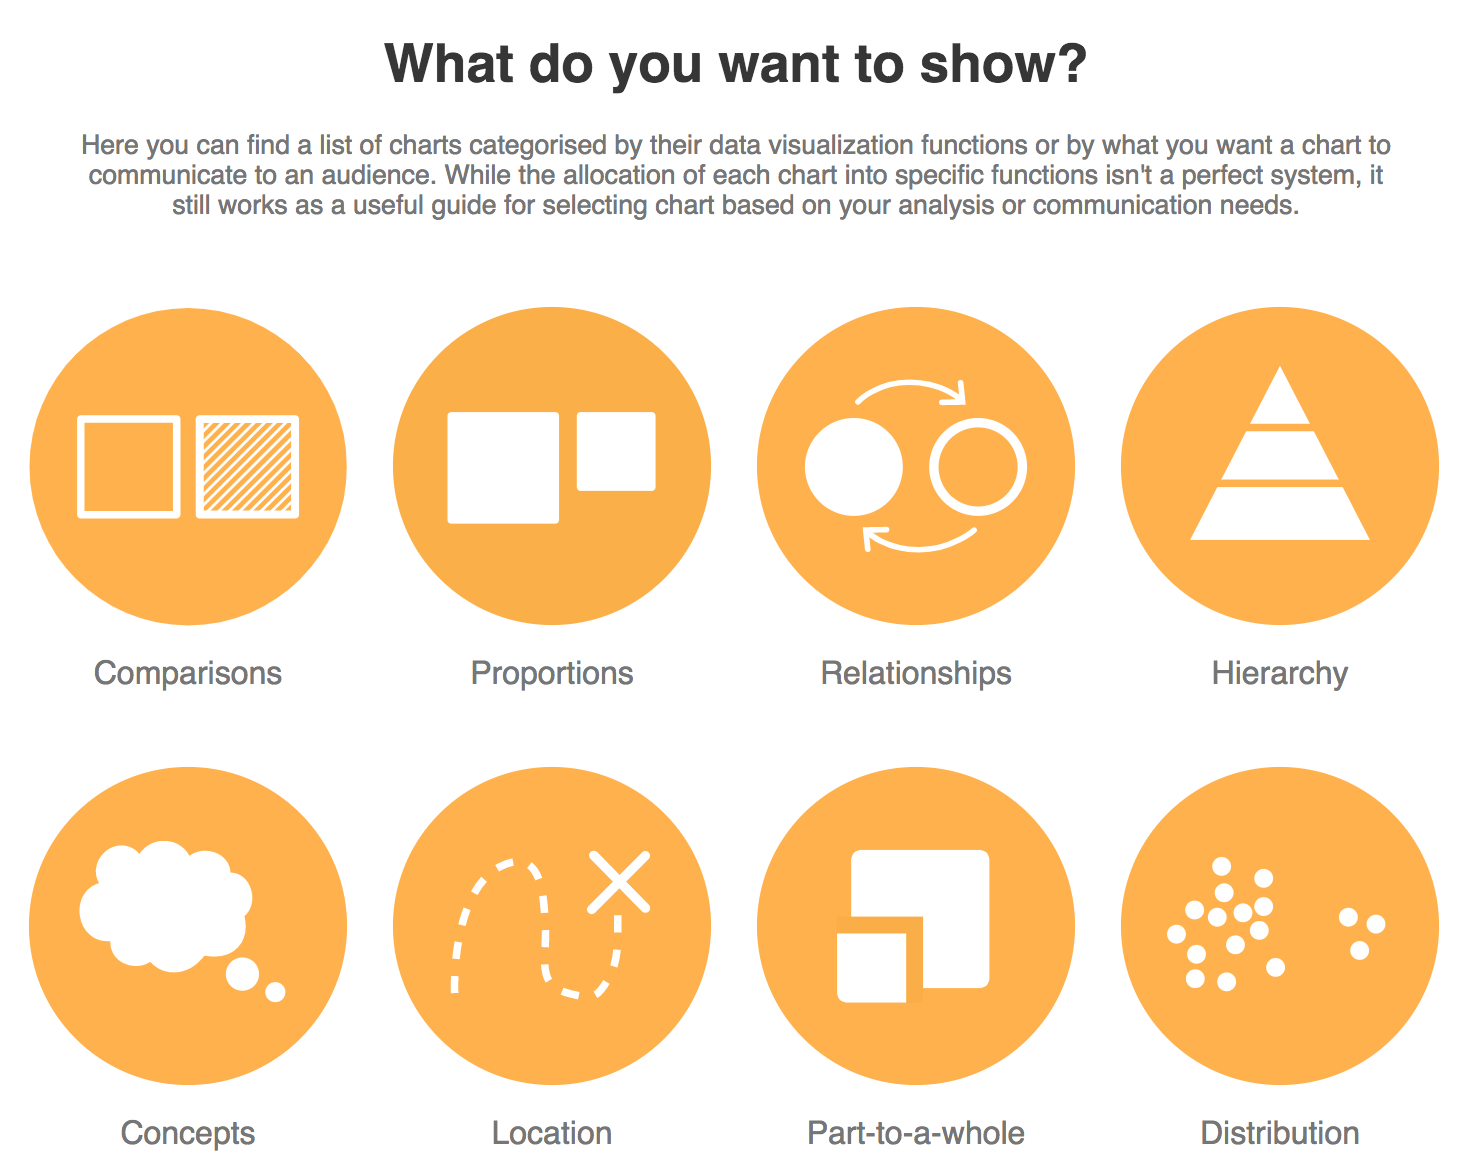
- The purpose is most important when you are selecting a form for your visualization.
Recap
Recap
Think about your
audience
-
Don't make your data visualization too complex.
-
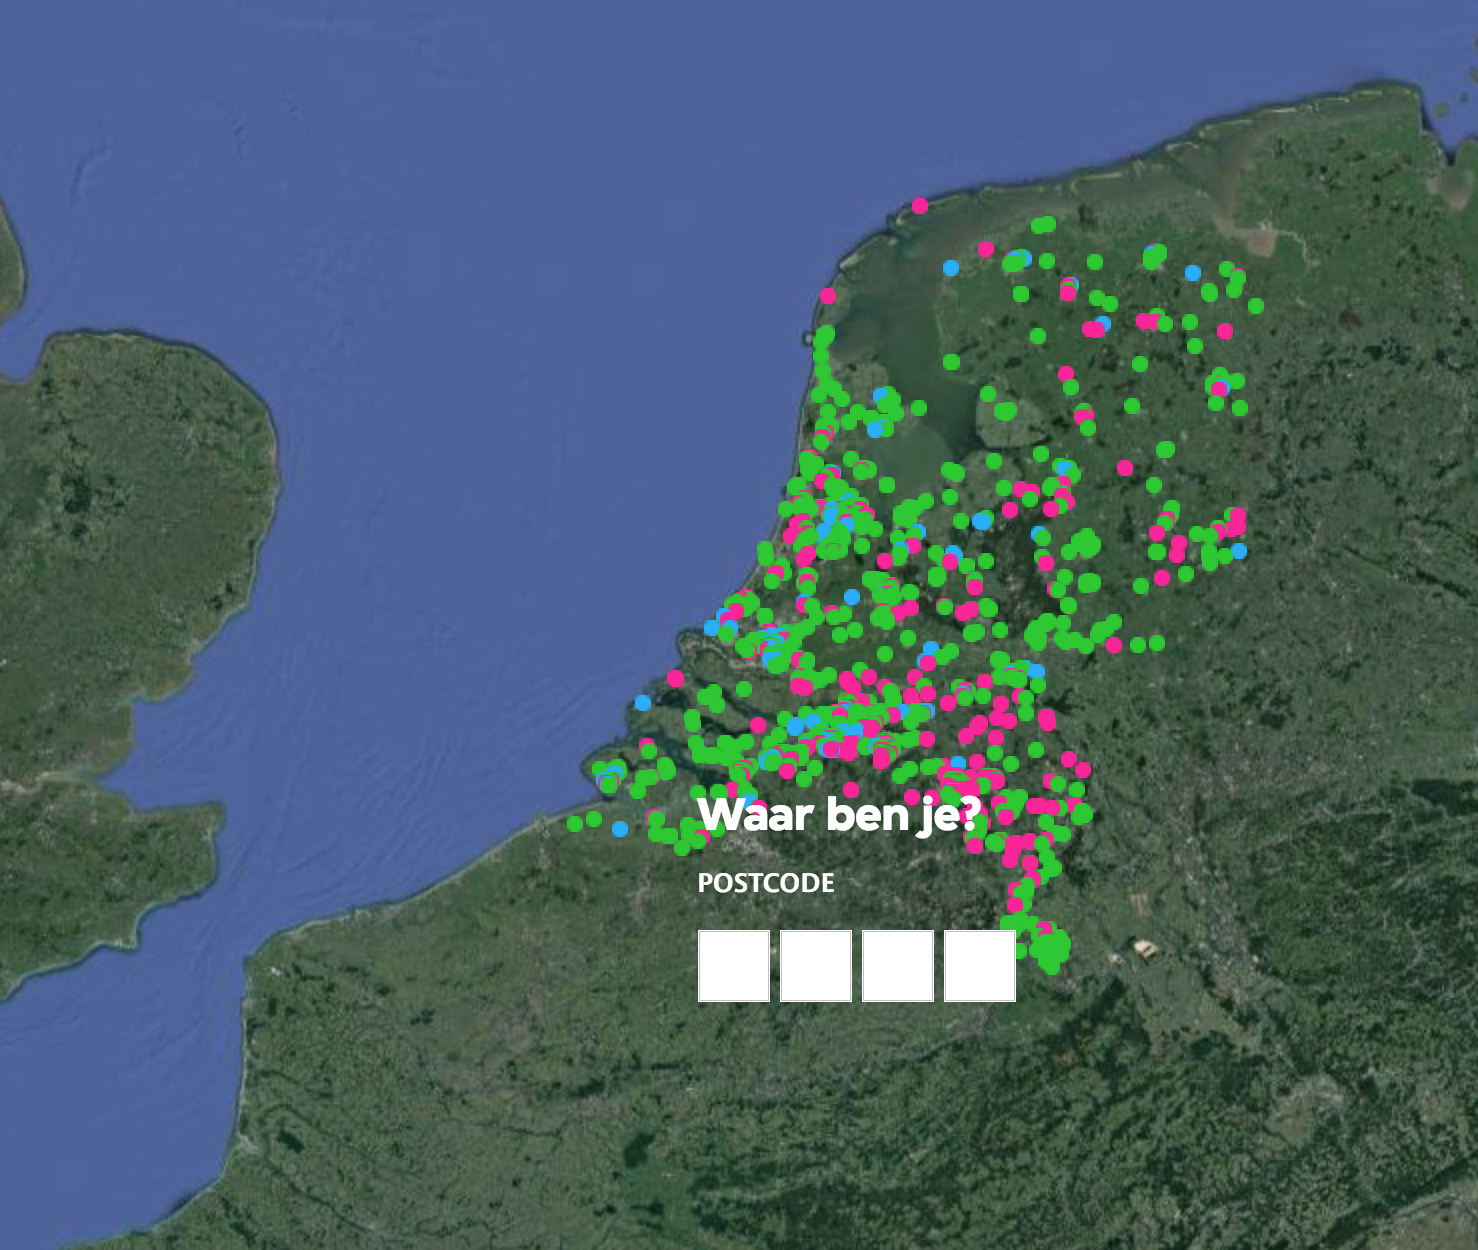
Don't make your data visualization too interactive.
-
Don't use a data visualization just to attract your audience. There has to be a purpose and a meaning.
Recap
Think about (ethical) issues
-
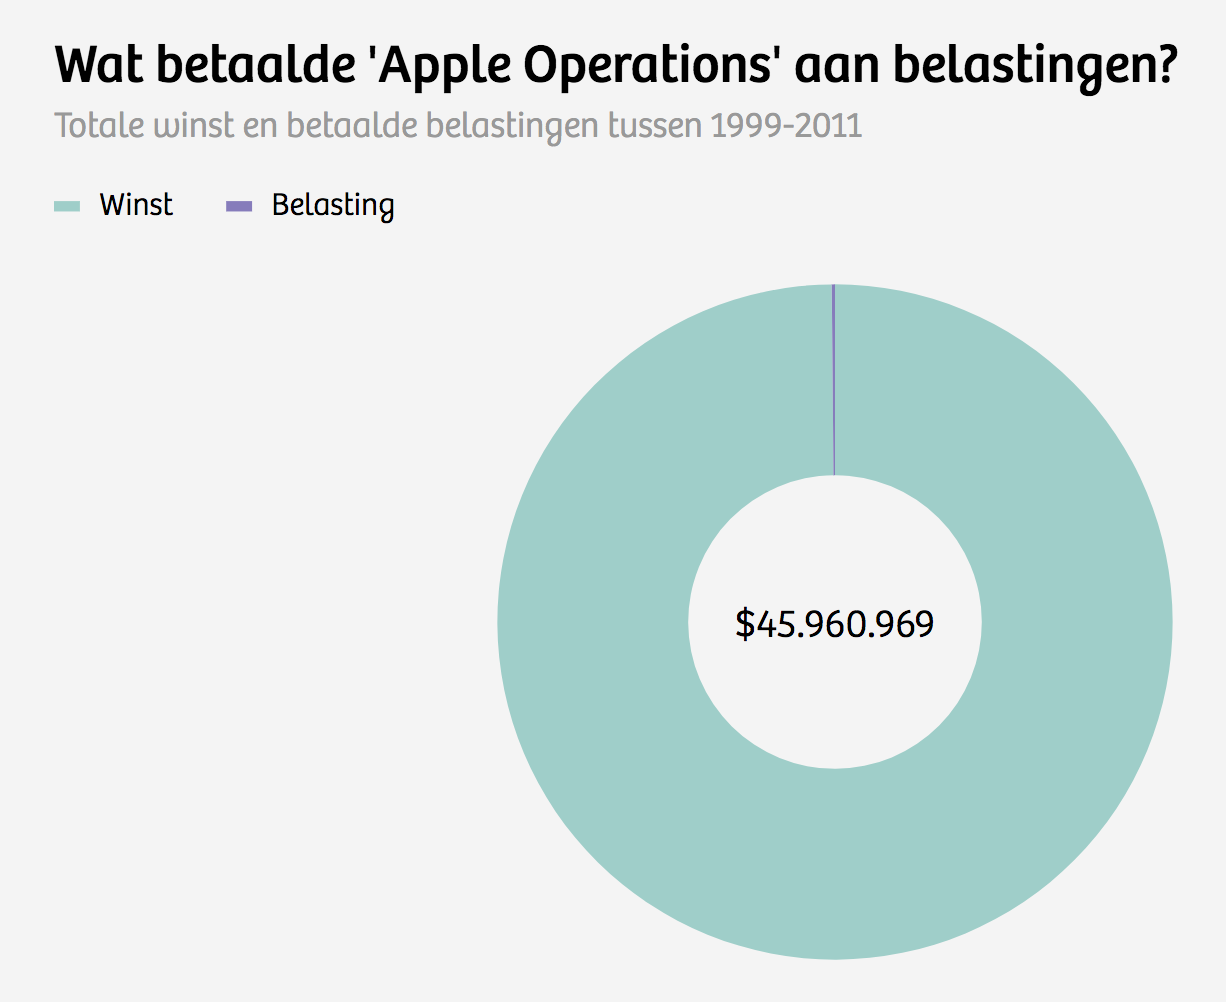
Make sure you are not manipulating your data.
-
Be aware of data sets that are incomplete or not accurate.
-
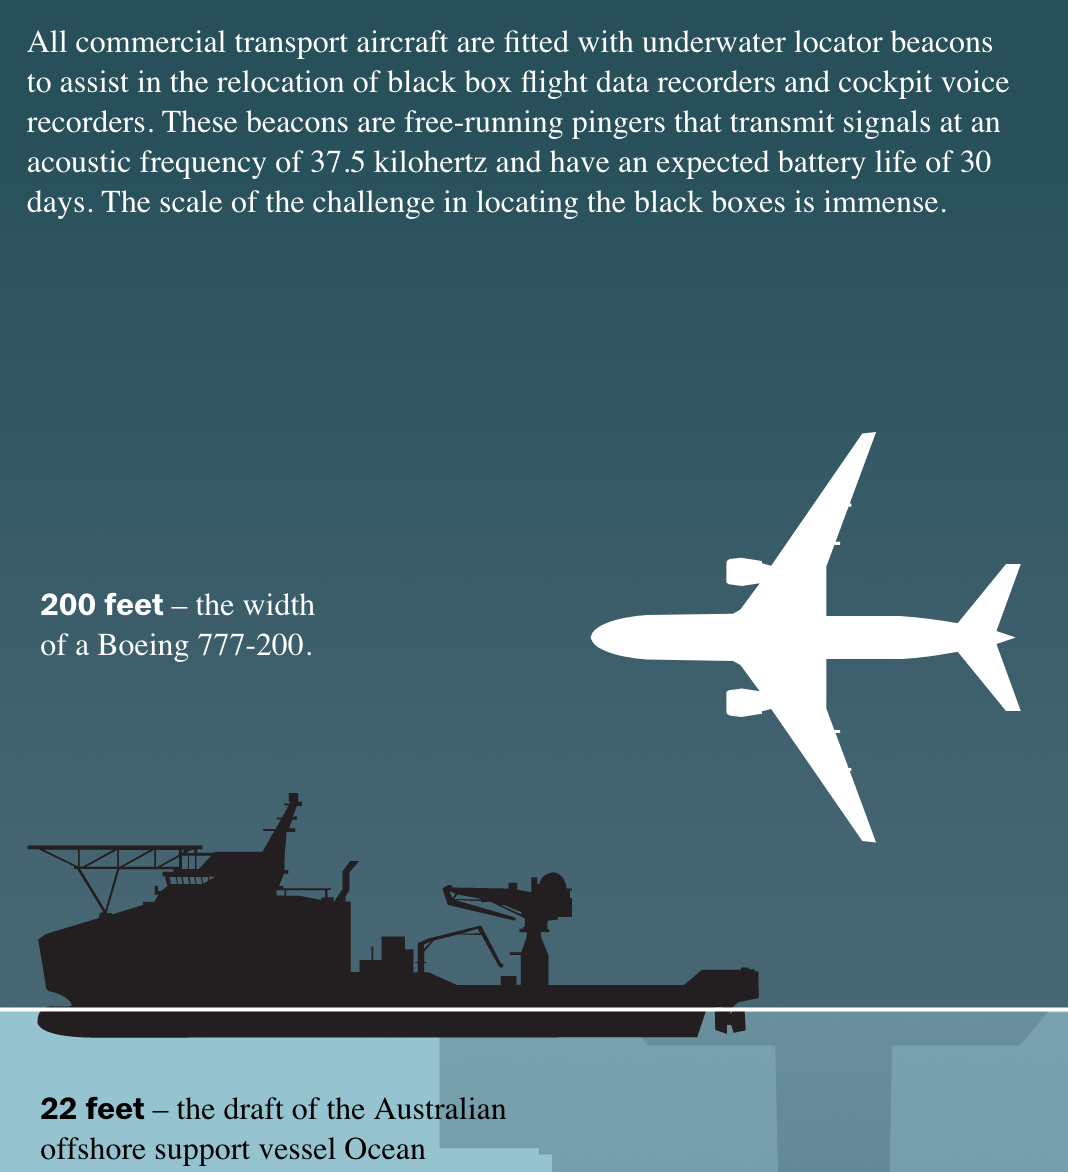
Data visualizations might dehumanize your subject.
Recap
Recap
Today
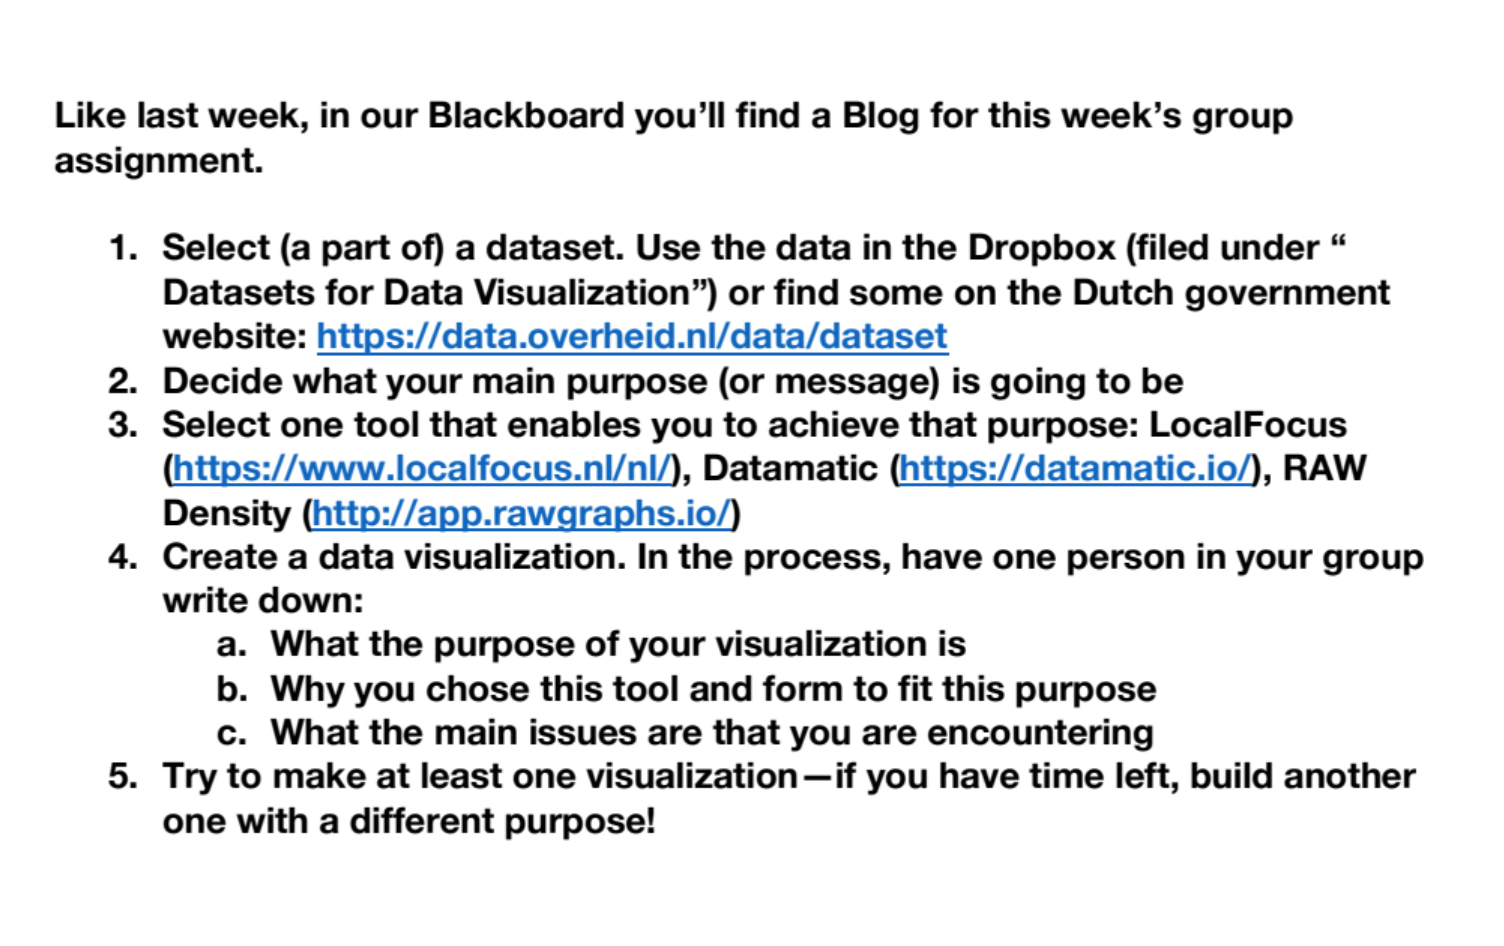
1. Pick a (part of a) dataset that you would like to visualize.
2. Decide what the purpose (/message) of your data visualization is going to be.
3. Create a data visualization. Use a data visualization tool.
What are data visualization tools and why should you use them?
We want to create data visualizations, but we don't want to...
- Spent to much time doing that.
- Work with dozens of people in one team (this also costs a lot of time and money).
Positive
-
Tools are webbased
-
They are easy to use
-
They are free (?) to use
-
They are embeddable
Negative
-
Tools are webbased
-
They are free (?) to use
-
They are not always stable
-
You have to work within their frame and use the functionalities the tool has to offer
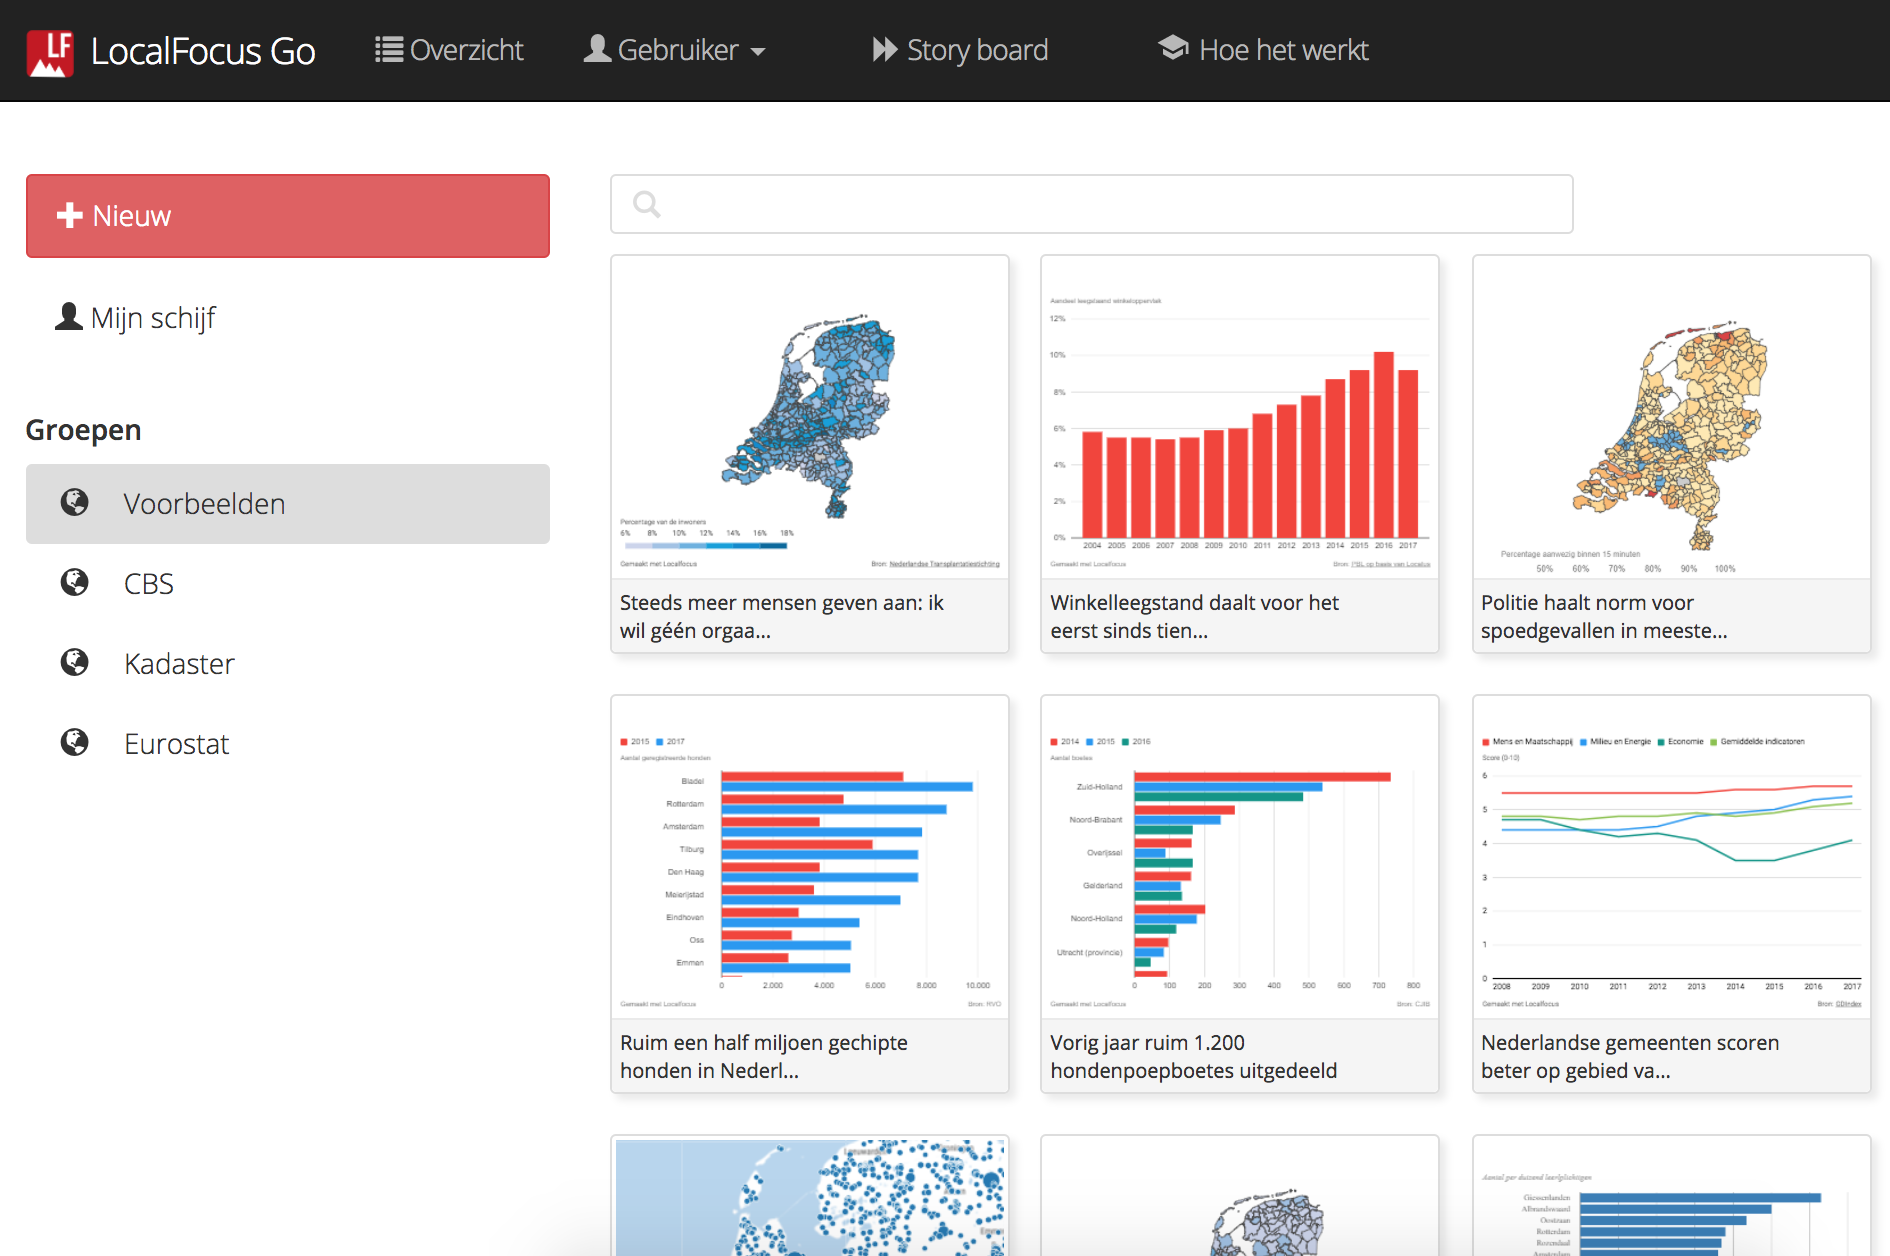
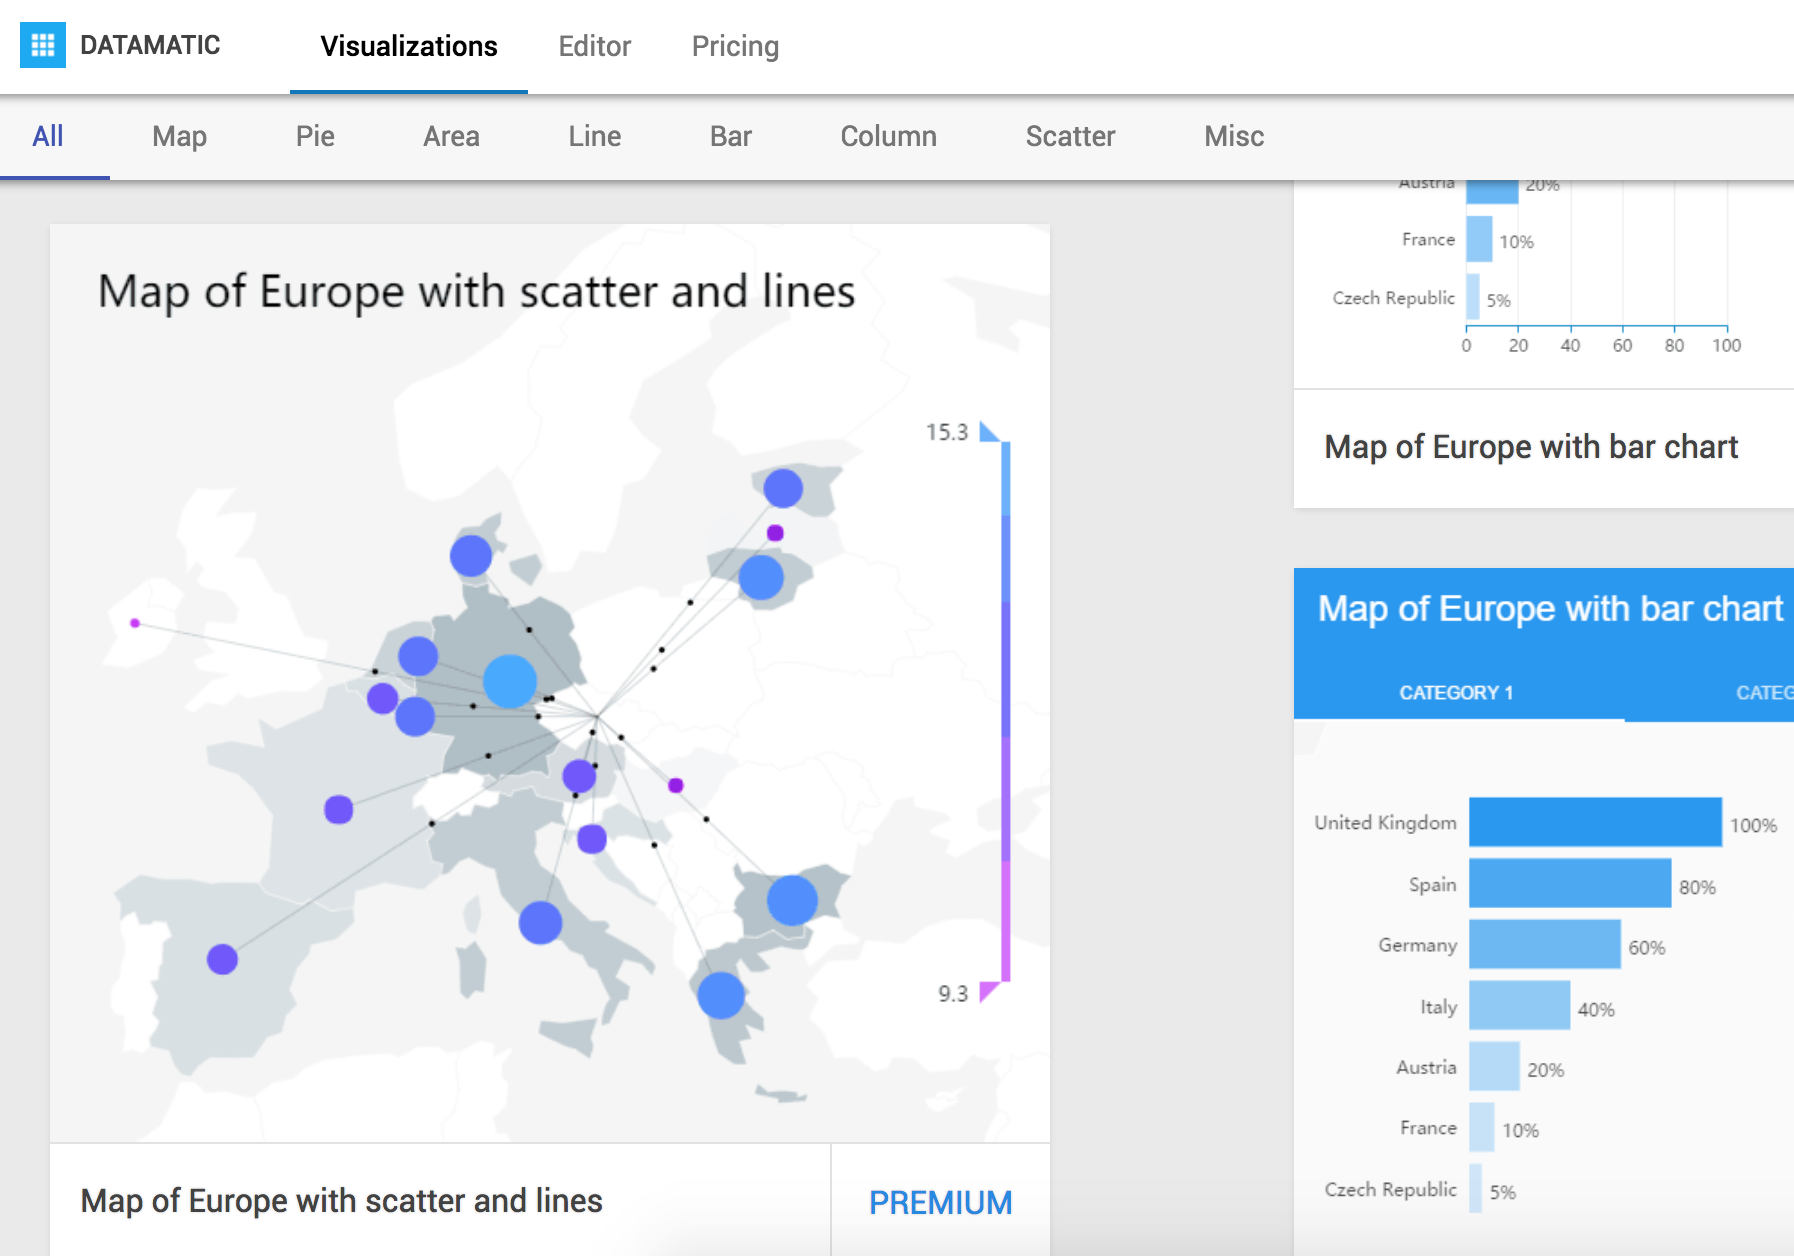
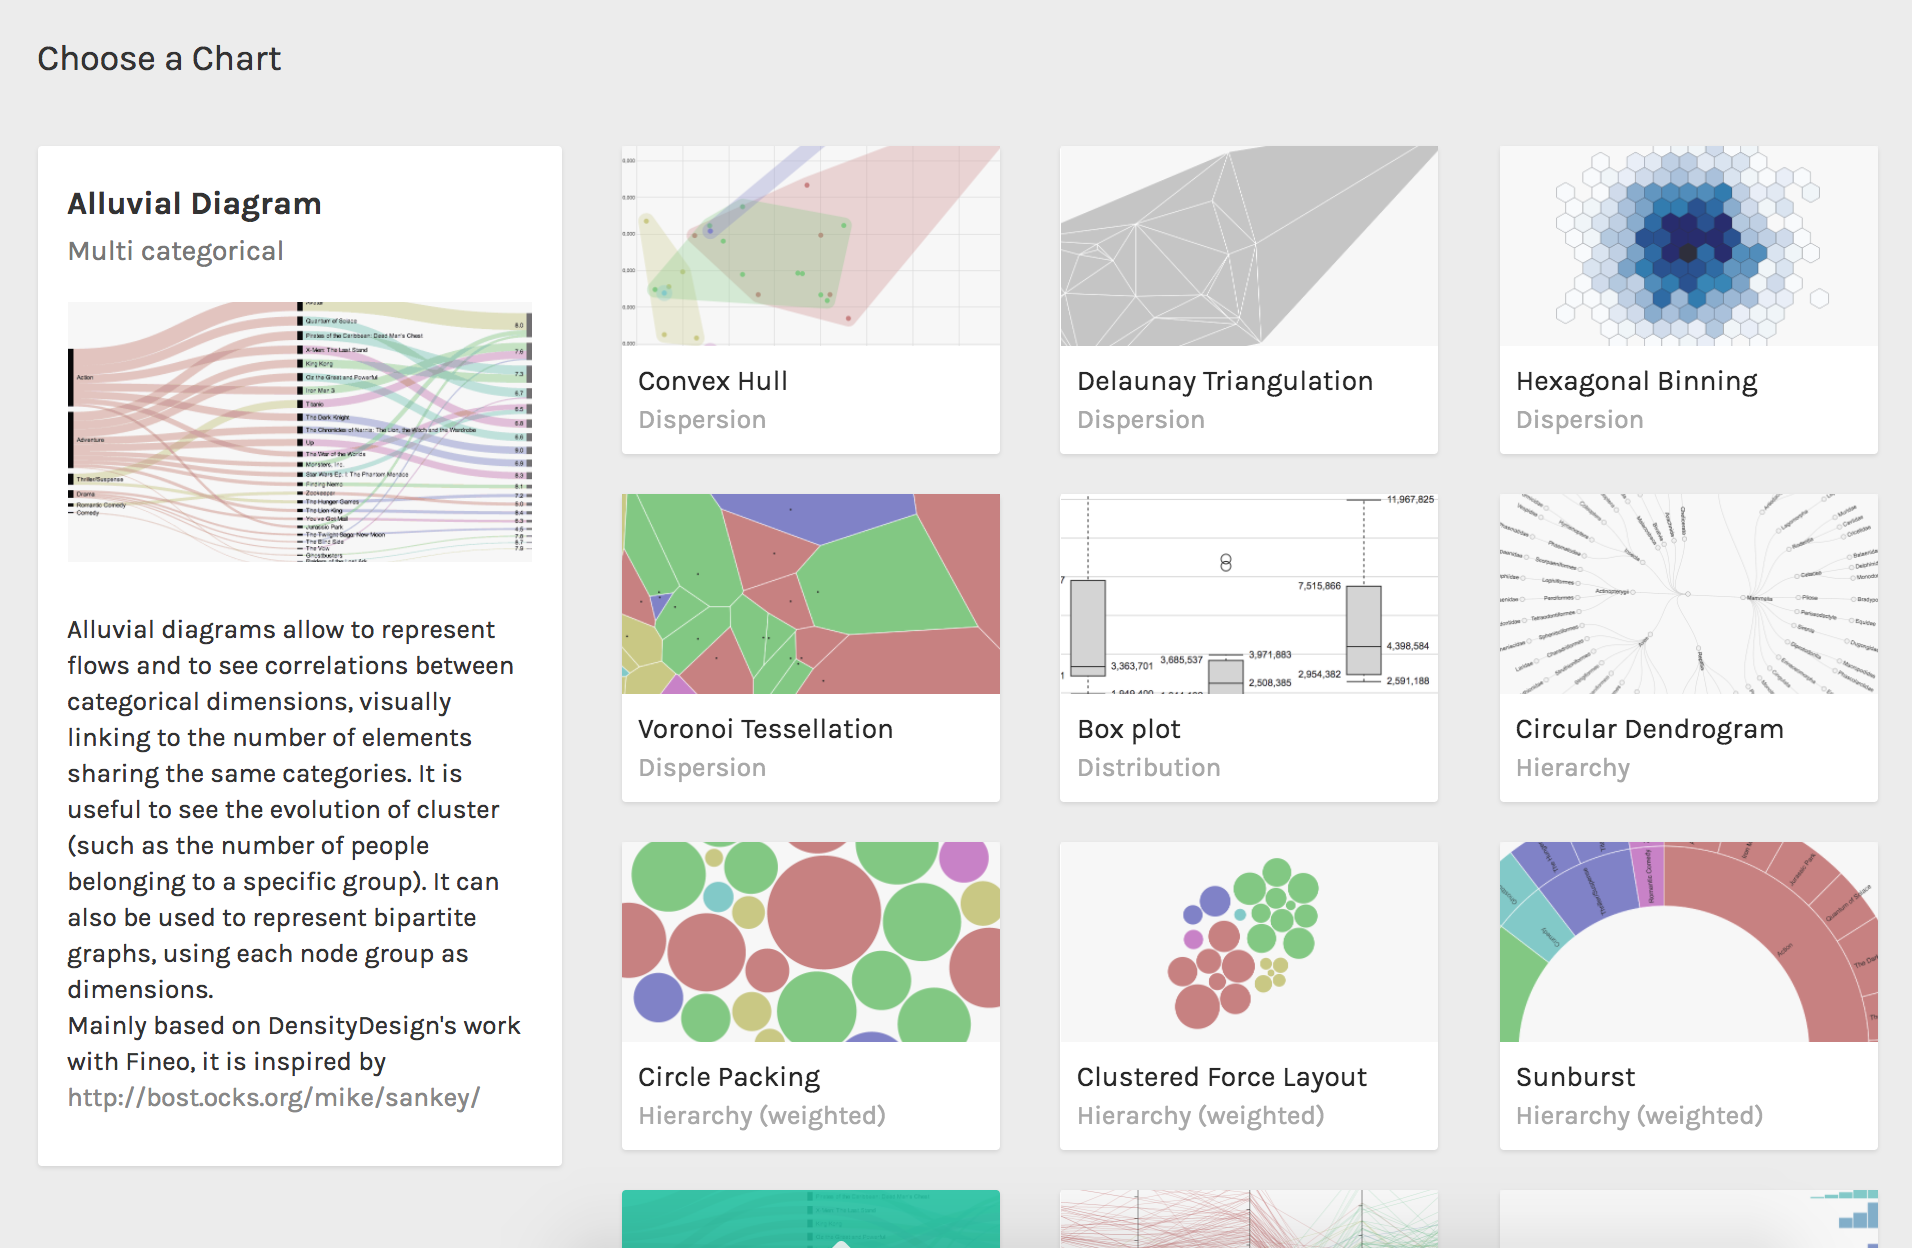
I've selected 3 tools for you to choose from...
Reflecting on what we just did
Data Visualization 2.0
By ingebeek


